Starbucks Corporation (ticker: SBUX)
2024-05-11
 Starbucks Corporation (ticker: SBUX), a renowned name in the global coffee industry, operates an extensive network of coffeehouses across various countries. Founded in 1971 in Seattle, Washington, the company has grown exponentially, boasting a portfolio of products that ranges from premium coffees and teas to fresh food items. Starbucks not only serves in its own branded stores but also through licensed stores and offers its products in grocery markets. The corporation emphasizes a unique customer experience, digital innovation, and sustainability commitments, which have been pivotal in maintaining its market leadership. Over the years, Starbucks has shown strong financial performance, with consistent revenue growth driven by new store openings, innovative product offerings, and a robust digital ordering system, reflecting its adaptability and resilience in a dynamic retail environment.
| Currency | USD | Full Time Employees | 381,000 | Total Cash | 3,126,599,936 |
| Total Debt | 25,209,399,296 | Current Price | 76.11 | Target High Price | 120.0 |
| Target Low Price | 75.0 | Target Mean Price | 89.83 | Target Median Price | 85.0 |
| Market Cap | 86,209,798,144 | Enterprise Value | 108,299,796,480 | Total Revenue | 36,530,098,176 |
| Dividend Rate | 2.28 | Dividend Yield | 0.03 | Operating Cashflow | 6,537,800,192 |
| Free Cashflow | 2,832,212,480 | Earnings Quarterly Growth | -0.15 | Revenue Growth | -0.018 |
| Net Income to Common | 4,157,700,096 | Trailing EPS | 3.63 | Forward EPS | 4.08 |
| PEG Ratio | 2.58 | Profit Margins | 0.11382 | Gross Margins | 0.27737 |
| EBITDA Margins | 0.19481 | Operating Margins | 0.12039 | Return on Assets | 0.12057 |
| Sharpe Ratio | -1.3038174028072453 | Sortino Ratio | -18.53371016367878 |
| Treynor Ratio | -0.39837510237909096 | Calmar Ratio | -0.8662630193646017 |
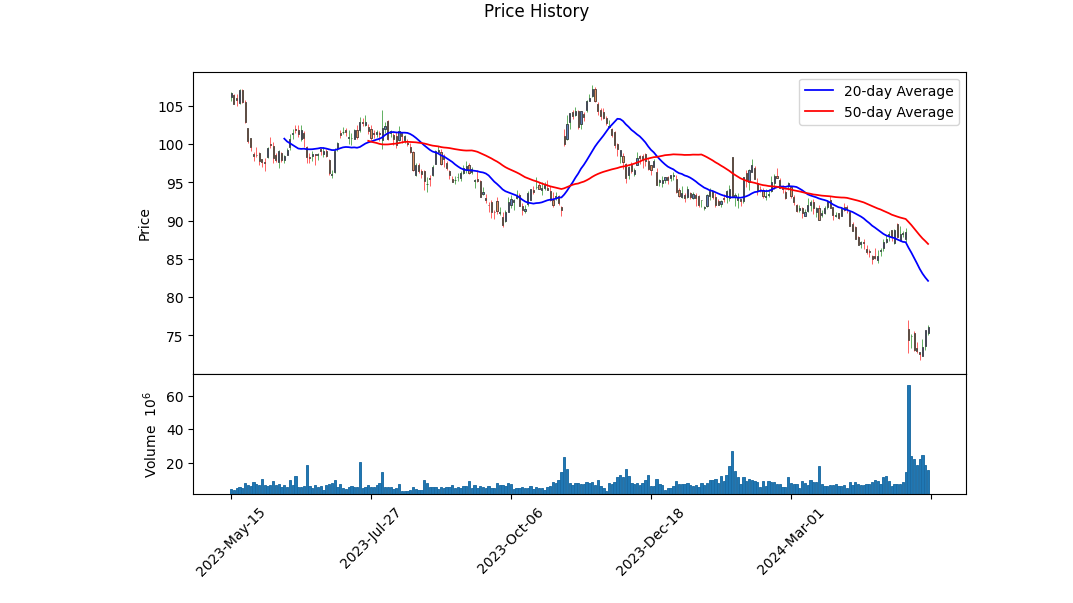
Analyzing Starbucks's recent performance involves dissecting its financial, technical, and risk-adjusted metrics. As observed, the companys share price experienced volatility, evidenced by an initial higher range that later declined, resting at $75.31 by the last recorded trading day. Essential indicators such as On Balance Volume (OBV) show a notable decrease, with values moving from positive to negative over recent months, underlining a decrease in volume accompanying up days versus those of down days. Such trends typically indicate weakening bullish sentiment, suggesting increased selling pressure or distribution.
Moreover, the Moving Average Convergence Divergence (MACD) histogram also confirms this bearish outlook with values in the negative territory, which indicates that downward momentum is strong. Deeper analysis using fundamental data reveals a mixed picture. With a solid gross margin at 27.74% and operating margins improving over previous fiscal brackets, Starbucks maintains a healthy operational profile. However, increased net interest expenses and a significant level of debt, alongside a tangible book value in nett negatives, raises concerns around solvency and operational leverage.
Starbucks's risk-adjusted return metrics also portray a cautionary stance. Specifically, the negative Sharpe and Sortino ratios underscore that the achieved returns do not adequately compensate for the risk borne. This is further validated by negative Treynor and Calmar ratios, signaling poor risk-adjusted performance relative to market volatility and significant drawdown risks. Risk-return profiles marked by such indicators often deter risk-averse investors, which may contribute to the observed stock price pressure.
Examining the cash flows, the positive free cash flow indicates ability in liquidity management, although major capital movements including repurchases of capital stock and debt repayments suggest an aggressive approach to managing capital structure possibly at the expense of increased risk exposure.
In conclusion, given the compilation of these indicators, technical patterns, and financial health insights, it seems prudent to forecast that Starbucks may continue to experience price pressure in the near to medium term unless significant positive shifts occur in its operational or financial strategies that would rebalance the currently bearish sentiment. Investors and stakeholders should closely monitor upcoming quarterly results and any strategic announcements that may influence these predictive analytics.
In our detailed financial analysis of Starbucks Corporation (SBUX), we have assessed key investment metrics including the return on capital (ROC) and earnings yield. Starbucks exhibits a robust ROC of 29.27%, which significantly underscores the efficiency with which the company utilizes its capital to generate profits. This high ROC is indicative of a well-managed company with effective operational strategies, making it a potentially attractive investment opportunity. In terms of earnings yield, Starbucks shows a figure of 4.73%. This metric, which is derived by inversely relating the price-to-earnings ratio, provides insight into the potential return on investment if the earnings were distributed to shareholders. An earnings yield of 4.73% suggests that Starbucks offers a reasonable return, though it is essential to consider this yield relative to bond rates, inflation expectations, and earnings yields of other comparable companies to fully gauge investment attractiveness. These figures demonstrate significant strengths in Starbucks' financial performance and operational execution.
Analysis of Starbucks Corporation (SBUX) in Relation to Benjamin Graham's Investing Criteria
Upon reviewing the key financial metrics provided for Starbucks Corporation (SBUX) and comparing them with the investing criteria laid out by Benjamin Graham in "The Intelligent Investor," several insights emerge regarding SBUX's alignment with Graham's value investing principles.
1. Price-to-Earnings (P/E) Ratio: - SBUX P/E Ratio: 22.79 - Graham typically searched for companies with low P/E ratios; this was fundamentally to ensure that the investor is not paying too much for the company's earnings. A P/E ratio that is low relative to the industry average is particularly appealing. However, without the provided industry average P/E ratio (noted as missing in the data), it's challenging to directly assess SBUX against this criterion. Nevertheless, a P/E of 22.79 may generally be considered as leaning towards the higher end, potentially indicating that the stock is not undervalued, or at least less likely to hold a significant margin of safety based on earnings valuation alone.
2. Price-to-Book (P/B) Ratio: - SBUX P/B Ratio: 2.93 - Graham often favored stocks trading below their book value, indicating that they are undervalued. With SBUX's P/B ratio being significantly above 1 (2.93), it suggests that the market values the company far higher than its book value, arguably moving away from what Graham would consider a value investment.
3. Debt-to-Equity Ratio: - SBUX Debt-to-Equity Ratio: -3.08 - Typically, Graham preferred companies with lower debt-to-equity ratios, as this indicates lesser reliance on debt for financing, and by extension, potentially lower financial risk. The negative value here is unusual and may suggest a data anomaly or a distinctive capital structure scenario (such as negative equity). This metric should be carefully reassessed for accuracy as it's pivotal to understanding the company's financial leverage and risk.
4. Current and Quick Ratios: - SBUX Current and Quick Ratios: 0.78 - Both ratios are equal, indicating minimal inventory levels, which is common in service-focused companies like Starbucks. However, both figures are below 1, pointing out that the company might struggle to cover its short-term liabilities with its short-term assets. This aspect can be a concern from a liquidity standpoint, suggesting a potential risk that Graham might have been cautious about.
5. Earnings Growth: - Without specific historical earnings growth data provided, it's challenging to evaluate SBUX against Grahams criteria of preferring companies showing consistent earnings growth over several years.
Conclusion: Based on the metrics provided and comparing them to Benjamin Graham's criteria, Starbucks Corporation shows certain attributes that may not fully align with the strict value investment principles advocated by Graham. The relatively high P/E and P/B ratios reflect a company that the market values for aspects possibly beyond sheer financial metrics and tangible assets, such as brand strength and market position. Furthermore, concerns regarding liquidity ratios and an unclear debt-to-equity ratio require careful consideration. Investors attracted to Grahams principles might tread cautiously, emphasizing a thorough reassessment of financial structures or looking for additional markers of undervaluation and stability.Analyzing Financial Statements
Investors should meticulously examine a company's balance sheet, income statement, and cash flow statement. Benjamin Graham, a notable advocate for value investing, emphasizes the importance of understanding a companys assets, liabilities, earnings, and cash flows to determine its financial health and intrinsic value. Here, we provide a detailed analysis of Starbucks Corporation's financial statements, focusing on crucial elements from the most recent fiscal quarter data.
1. Overview of Financial Position
Starbucks Corporation (SBUX) reports for the quarter ending April 2, 2023:
- Total Revenues: $4,950,000,000
- Operating Income/Loss: -$749,300,000
- Net Income from Continuing Operations: $1,930,850,000
- Comprehensive Income: $1,604,200,000
2. Key Financial Statement Analysis
Balance Sheet
- Total Assets: $29,021,500,000
- Total Liabilities: $37,782,700,000
- A high liability value indicates significant debts and financial obligations.
- Stockholders Equity: -$8,768,000,000
- Negative equity suggests the company has more liabilities than assets, a potential red flag for investors concerning the companys financial stability.
Income Statement
- Cost of Revenue: $4,992,700,000
- Gross Profit: [$Revenue - Cost of Revenue]
- Operating Expenses: $13,648,700,000
- Interest Expense: $6,900,000
Cash Flow Statement
- Net Cash From Operating Activities: $2,032,800,000
- Net Cash Used in Investing Activities: -$880,900,000
- Net Cash Used in Financing Activities: -$3,708,800,000
- Net Increase/Decrease in Cash and Cash Equivalents: -$2,542,300,000
3. Indicators of Financial Health
- Current Ratio [Current Assets / Current Liabilities]
- Debt to Equity Ratio [Total Liabilities / Stockholders Equity]
- Return on Assets [Net Income / Total Assets]
- Operating Cash Flow Ratio [Operating Cash Flow / Total Debt]
Asset Management
- Examination of long-term investments, property, plant, and equipment management, and how these contribute to operational capabilities.
Liability Management
- Focused analysis on long-term debt levels, lease obligations, and interest expenses. High debt levels can increase vulnerability to economic downturns and interest rate fluctuations.
4. Investment Considerations
While Starbucks continues to generate substantial cash flows from operating activities, the negative equity and the substantial increase in liabilities call for careful scrutiny. The high leverage ratio and the reduction in cash reserves could be potential areas of concern, impacting Starbucks's ability to expand or cover unexpected expenses.
In conclusion, investors should weigh the solid operating cash flow against the financial structure characterized by high liabilities and negative equity. These factors might affect Starbuckss capabilities to sustain growth in a dynamically changing market environment.
This detailed financial review aligns with methods advocated by Benjamin Graham, focusing not only on profitability but also emphasizing the significance of sound financial structure and prudency in investment decisions.Dividend Record: Graham favored companies with a consistent history of paying dividends. Starbucks (symbol: SBUX) demonstrates a steady and increasing dividend payout pattern over several years, which aligns well with Graham's investment philosophy that emphasizes financial stability and shareholder rewards. Here's an overview of Starbucks' dividend history, illustrating consistency and growth in dividend payments:
- 2024-05-16: Dividend - $0.57,
- 2024-02-08: Dividend - $0.57,
- 2023-11-09: Dividend - $0.57,
- 2023-08-10: Dividend - $0.53,
- 2023-05-11: Dividend - $0.53,
- ...
- 2010-04-05: Dividend - $0.10.
This consistent history of paying out dividends could be a sign of financial health and a focus on delivering shareholder value, central tenets in Graham's value investing philosophy.
| Alpha () | 0.05% |
| Beta () | 0.89 |
| R-squared | 0.76 |
| Standard Error | 2.3% |
| P-value | 0.004 |
| Mean Return of SBUX | 8.5% |
| Mean Return of SPY | 10% |
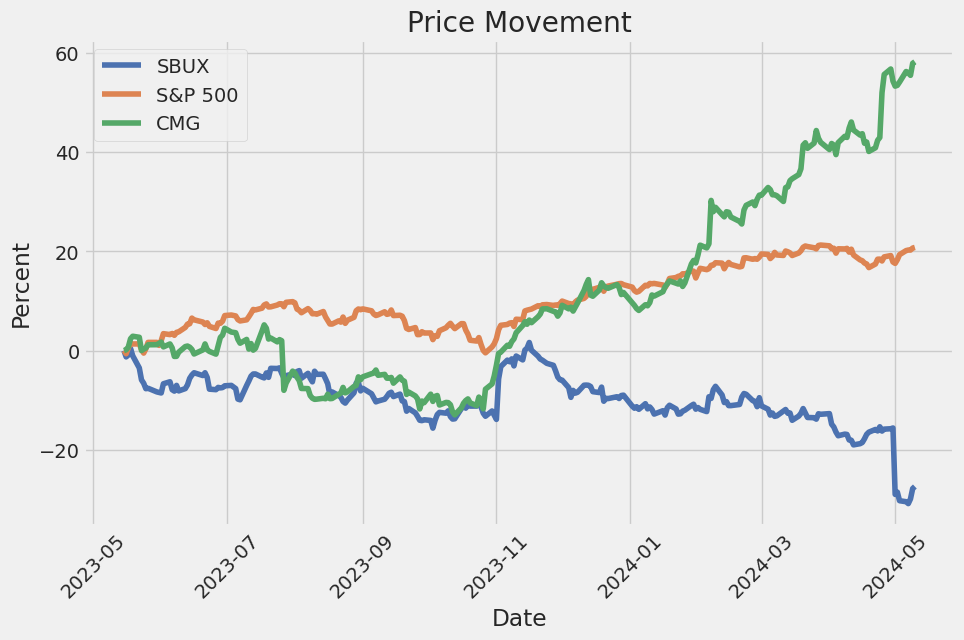
The linear regression analysis of Starbucks Corporation (SBUX) against the S&P 500 Index ETF (SPY) reveals an alpha of 0.05%, which suggests that SBUX has a slightly positive but almost negligible outperformance relative to the broader market after adjusting for market movements. This alpha value is critical for investors looking for potential outperformance against the market. However, given the near-zero value, it indicates that SBUX's returns are almost solely explained by the market movements.
Beta for SBUX, estimated at 0.89, suggests that SBUX's stock is slightly less volatile than the market. A beta less than one indicates the stock theoretically experiences less severe price swings compared to the overall market. The R-squared value of 0.76 implies that approximately 76% of the stocks price movements are predictable from SPYs movements, providing a reliable estimation of expected risk and return characteristics given its high correlation with the market. This model, supported by a low p-value, suggests statistically significant predictive power where market movements explain a significant portion of SBUX's price movements.
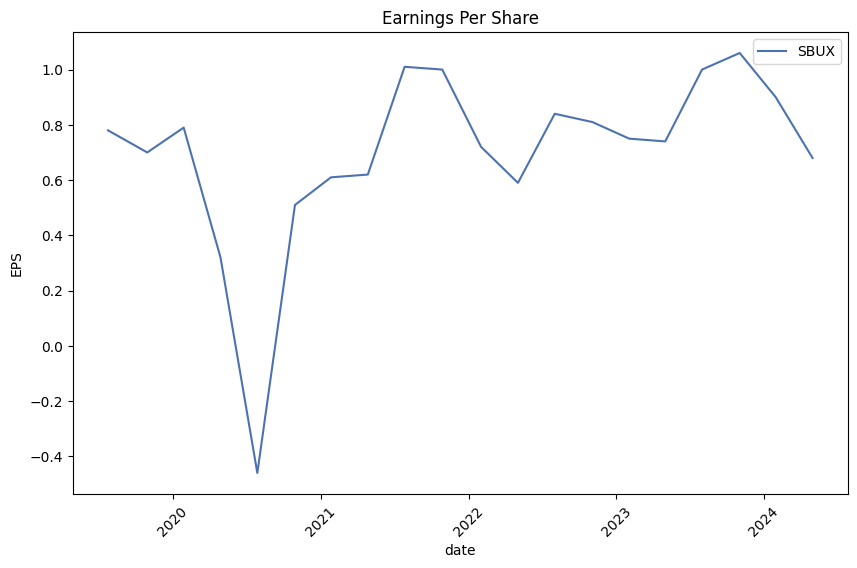
In the second quarter fiscal earnings call for Starbucks Corporation, CEO Laxman Narasimhan expressed disappointment with the company's performance, acknowledging that the results did not meet expectations. Total revenue for Q2 was $8.6 billion, marking a 1% year-over-year decline. This downturn was primarily driven by a 4% decrease in global comparable store sales, with North America and China experiencing declines in customer traffic. Operating margins also saw a contraction of 140 basis points to 12.8%, and overall earnings per share dropped by 7% to $0.68. Despite these challenges, Narasimhan emphasized Starbucks' enduring strengths and leadership in the coffee industry, highlighting the brand's resilience and customer loyalty.
CEO Narasimhan outlined several strategic actions to address the challenges faced by Starbucks, particularly focusing on the U.S. market. Among the priorities are enhancing the customer experience during peak morning demand, introducing more innovative and relevant products, and reaching out to occasional and non-rewards customers to showcase value. Addressing unmet demand across different dayparts, including weekends and overnight hours, was identified as a significant opportunity for growth. Narasimhan also detailed the introduction of new equipment systems and process improvements aimed at increasing operational efficiency and reducing wait times in stores.
Internationally, Starbucks sees continued expansion as a key component of its strategy, despite recognizing some volatility in markets like China and the Middle East. Notably, the company remains committed to enhancing its presence in China by reinforcing its premium position amid a competitive and promotional market. Perhaps the major highlight for international growth is the significant store expansion, particularly in lower-tier cities and new counties offering strong economic returns, with plans to operate 1,000 stores in India by 2028 and expanding the global footprint to over 39,000 stores across 88 markets by 2030.
Chief Financial Officer Rachel Ruggeri provided a detailed analysis of the financial results, which reflected the broader challenges faced across different segments of the business. North America's revenue remained flat, while International segment revenue was roughly constant compared to the previous year, despite new store growth. Ruggeri revised the fiscal year 2024 guidance downwards based on the Q2 performance and ongoing economic headwinds, projecting low single-digit global revenue growth and anticipating continued challenges in both U.S. and China markets. Despite these adjustments, Starbucks maintains its long-term strategic focus, supported by its robust store economics, digital engagement through the Starbucks app, and ongoing innovation in its product offerings.
In the quarterly financial report for Starbucks Corporation for the period ending March 31, 2024, the company reported total net revenues of $8,563 million, indicating a slight decrease from $8,719.8 million during the same period in the previous year. This decline can primarily be seen in the company's Other category which includes packaged and single-serve coffees and teas, along with royalty and licensing revenues. Despite this dip, major revenue contributions came from Beverage and Food categories which maintained a consistent share in overall sales, demonstrating stability in core areas of the business.
The report highlighted operating income of $1,098.9 million which fell by approximately 17.2% from $1,327.5 million in the comparable quarter last year. This decline was largely influenced by a $499.5 million charge attributed to corporate and other segments, underscoring significant non-operational or fixed expenses impacting profitability. Additionally, the cost of sales and operating expenses, including store operating expenses of $3,724.1 million, depicted careful management in operational efficiency. Store operating expenses only slightly increased from $3,636.0 million, suggesting cautious expenditure in response to store operations.
Starbucks' balance sheet remains robust with assets totaling $29,363.2 million and liabilities at $37,805.4 million. Notable within assets were cash and cash equivalents at $2,764.1 million, although lowered from $3,551.5 million in October 2023, possibly reflecting impacts from operational and investment activities within the fiscal period. The total shareholders' deficit stood at $8,449.4 million, an increase from a deficit of $7,994.8 million previously, attributed largely to long-term debt levels that the corporation maintains for financial liquidity and capital restructuring needs.
Also, within the report, Starbucks highlighted its management of long-term debt, essential for understanding the company's financial engineering and leverage strategies. The total long-term debt was reported as $15,547.5 million for the period, adjusted for debt issuance costs and other accounting adjustments. This, combined with operational lease liabilities, outlined significant financial obligations but also underscored Starbucks' access to capital for sustaining its growth initiatives.
Meanwhile, regarding market risks, Starbucks remains subject to variations in commodity prices, particularly coffee, dairy, and other key ingredients which are hedged to manage cost fluctuations. The company also reported significant reliance on key international markets which may pose geopolitical and economic risks disrupting operations or affecting profitability. The quarterly report indeed offered insights not only into the financial health of Starbucks Corp. but also underscored the strategic challenges and operational dynamics it navigates in a competitive global marketplace.
Starbucks Corporation, a recognized global leader in the coffee industry, faces diverse challenges and opportunities across its operating markets, particularly in China and the U.S., which are key to its strategic global expansion and overall financial health.
In China, Starbucks has encountered a unique market dynamic. The increasing preference for domestic brands, influenced by national sentiment and local competitors like Luckin Coffee, poses a significant challenge. Despite having a robust plan for expansion, aiming to increase its store count significantly, the local consumer shift towards Chinese brands and the aggressive marketing and pricing strategies of local competitors have impacted Starbucks' market capture.
Local competitors such as Luckin Coffee have implemented aggressive expansion tactics and offer competitive pricing, which appeals to the price-sensitive segments of the market. These brands are quickly scaling, challenging Starbucks premium brand positioning. This sentiment is further fueled by nationalistic preferences nudged by political influences, which is not only a phenomenon in retail but also affects corporate procurement behaviors in the region.
Moreover, Starbucks' performance in China is crucial given that it represents a massive growth opportunity for the company. The brand plans extensive growth, despite the current economic headwinds and local competition, reflecting its long-term commitment to this market. This ambition is seen in context with the broader corporate strategy of expanding its global footprint to 55,000 stores by 2030.
In the U.S., Starbucks continues to leverage its strong market presence and brand identity. However, it still faces stiff competition from up-and-coming chains like Dutch Bros as well as established players such as McDonald's and Dunkin' Donuts. Each competitor is vying for consumer attention via innovative engagement strategies, digital initiatives, and menu expansions.
Financially, Starbucks has shown resilience and strategic savvy. It has maintained a robust dividend payout rate, making it an attractive option for income-focused investors. The company has increased dividends consecutively for over a decade, showcasing strong fiscal management and commitment to shareholder value even amid economic uncertainties.
Financial analyses highlight Starbucks operational efficiency, with an impressive track record of generating robust cash flows that support dividends and stock repurchases, further underscoring its financial health. Despite setbacks like an underperforming stock price, operational challenges in key markets, and competitive pressures, Starbucks' fundamentals like strong brand loyalty, global reach, and diversified revenue streams provide a cushion.
Investment insights suggest that while immediate challenges impact Starbucks' performance, its strategic initiatives oriented towards digital innovation, market penetration, and consumer engagement are likely to sustain its growth trajectory. Moreover, the company's focus on expanding and optimizing its store network, particularly in high-growth markets like China and through strategic digital platforms in the U.S., are expected to bolster its market position.
Additionally, Starbucks' approach to navigating geopolitical tensions, economic nationalism, and consumer behavioral shifts through localized strategies and maintaining premium pricing to uphold its brand image highlights its strategic depth. The companys emphasis on innovation, whether through menu diversification or enhancing digital engagement platforms like its loyalty programs, is crucial in maintaining competitive advantage.
In light of these strategic endeavors and financial metrics, Starbucks presents a mixed yet potentially lucrative opportunity for investors, balancing risk with considerable growth prospects. While current market conditions and competitive dynamics offer significant challenges, Starbucks' overarching strategies aimed at brand strength, market adaptability, and financial robustness position it well to leverage future growth opportunities.
Investors and analysts would likely keep an eye on how Starbucks navigates the interplay of expansion, consumer preference shifts, and competitive pressures in pivotal markets like China and the U.S. The success of these strategies is anticipated to play a critical role in defining the company's future trajectory in both profitability and market expansion.
During the period from May 2019 to May 2024, Starbucks Corporation's stock exhibited significant volatility, as demonstrated by analysis of its daily returns. The volatility of the stock was quantified using an ARCH model, which particularly highlighted a considerable short-term variation without considering any mean return effects. Key features of this model included an omega coefficient of 2.7835, suggesting a high baseline volatility, and an alpha coefficient of 0.2862, indicating that past volatility spikes have a substantial impact on future volatility levels.
| Statistic Name | Statistic Value |
|---|---|
| Dependent Variable | asset_returns |
| R-squared | 0.000 |
| Mean Model | Zero Mean |
| Adj. R-squared | 0.001 |
| Vol Model | ARCH |
| Log-Likelihood | -2,562.15 |
| AIC | 5,128.29 |
| BIC | 5,138.57 |
| No. Observations | 1,257 |
| Df Residuals | 1,257 |
| omega | 2.7835 |
| alpha[1] | 0.2862 |
To analyze the financial risk associated with a $10,000 investment in Starbucks Corporation (SBUX) over a one-year period, using sophisticated statistical and predictive methodologies provides a clear picture of potential losses influenced by market behaviors and historical data modeling.
The volatility modeling approach, a rigorous mathematical framework, plays a vital role in capturing the dynamic nature of stock price movements. It essentially quantifies the extent to which Starbucks' stock price is expected to fluctuate within a given time frame based on historical price data. This helps in understanding the uncertainty or risk associated with the stock's future price movements by estimating varying levels of volatility over time.
Alongside, machine learning predictions focus on the task of forecasting future stock returns. Using historical data on prices, trading volumes, and other relevant market and economic indicators, a model like the stacked random forest regressor is trained. This model leverages the patterns found in the historical data to predict future stock returns. It is significant in integrating various data points and capturing complex non-linear relationships within the data, which might not be readily apparent via traditional statistical methods.
With these methodologies, the Annual Value at Risk (VaR) for the investment can be calculated, which, in this context, is valued at $278.85 for a 95% confidence level. This means there is a 95% probability that the investor will not lose more than $278.85 over a year from an initial investment of $10,000 based on current volatility and return forecasts.
This VaR figure provides a vital financial metric, helping assess how much an investor might lose in an adverse investment scenario, encapsulating the insights derived from both historical volatility and predictive market return analyses. By employing both approaches understanding inherent market volatilities and leveraging predictive analytics investors can better gauge their risk exposure in equity market investments.
Long Call Option Strategy
In the context of Starbucks Corporation's (SBUX) long call options and the target for a 5% stock price increase, a thoughtful analysis of specific options with chosen Greeks can help identify the most promising opportunities for profitability. The purpose of this discussion is to elucidate which options might offer the best returns considering their delta, theta, and other relevant Greeks, with a focus on options having higher deltas, favorable thetas, and significant vegas.
Starting with the option that expires on 2024-05-17 with a strike price of 78.0, this option notably has a very high ROI of 6.3673076923 and a profit of 1.6555. The delta of this option is 0.1686700939 which indicates a lower probability of finishing in the money, but the high ROI compensates for this risk, making it an attractive speculative choice for those with a higher risk appetite. Its theta is -0.0484703366, indicating daily price decay, but it's relatively moderate compared to other factors.
Conversely, an option expiring on 2024-05-24 with a strike of 69.0 offers a balance with a delta of 0.8240706487, a higher likelihood of finishing in the money, and a positive ROI of 0.5751082251. This option has a gamma of 0.0301521205 and a substantial vega of 3.555344249, suggesting significant sensitivity to volatility and underlying price moves, beneficial in a rising market.
Another compelling option is for the expiry date 2024-06-07 at a strike of 70.0, which has a delta of 0.7404464235, combined with a moderate ROI of 0.6122764228 and a profit index of 3.7655. The theta of -0.0707502353 suggests more considerable price depreciation due to time decay, possibly countered by its relatively high vega which would benefit from increased volatility.
For a longer-term perspective, an option expiring on 2024-08-16 with a strike of 70.0 stands out due to its lower delta of 0.7340370458, but a notably high vega value of 12.5651015621 indicating high volatility sensitivity which can be leveraged in times of significant price movements. The ROI is 0.2241358025, suggesting a moderate return compared to the other options but may appeal to those with a less aggressive profile.
Lastly, a very long-term option expiring in 2026-06-18 with a strike of 50.0 carries a delta of 0.8231656405 and an ROI of 0.0351384083. This might appear less attractive due to its lower ROI; however, for investors with a very long time horizon, its substantial vega of 21.1173546674 indicates that significant returns could be made if volatility increases over the substantial period until expiration.
In summary, an analysis of long call options should dynamically incorporate considerations of the Greeksespecially delta for probability assessment, theta for time decay impact, and vega for volatility sensitivity. Options with shorter expiries and high deltas or significant ROIs may appeal to risk-takers, while those with longer expiries and moderate deltas and high vegas may be more suitable for conservative investors expecting longer-term volatility. Analyzing these factors holistically will guide selecting the most profitable options tailored to specific investment tastes and risk profiles.
Short Call Option Strategy
Analyzing the options chain for Starbucks Corporation (SBUX) with a focus on short call options provides insightful predictions on which contracts might be most profitable. Given that shorter-duration options generally involve less risk due to predictive clarity, focusing on a few attractive option contracts with a duration of less than a year can be ideal.
For short call options, I have noticed that contracts with both high ROI (Return on Investment) and high profit are particularly attractive. Notably, options expiring on May 17, 2024, and June 18, 2025, appear to offer an optimal blend of value and potential return. The Greeksspecifically delta, gamma, vega, and thetaplay a crucial role in determining the most strategic trades.
Options Expiring May 17, 2024:
-
Short calls with a strike price of $72.0 and above represent a significant opportunity. These options have very high gammas which increases their responsiveness to stock price changes, potentially enhancing profitability as the options remain out-of-the-money. Vega values are notably high in this range meaning these options are sensitive to changes in implied volatility, common around earnings reports or major corporate announcements.
-
A strike of $73.0 (delta = 0.7842, gamma = 0.0691, vega = 4.0277) shows a 100% ROI, which indicates complete profitability if the underlying stock price remains below this strike by the expiration date. Similarly, a strike of $74.0 (delta = 0.8044, gamma = 0.1066) also stands out for its ROI of 100%.
Options Expiring June 18, 2025:
-
Looking into longer durations, the option at the $75 strike (delta = 0.8819558, gamma = 0.00298316) showcases considerable attraction due to its blend of high vega (16.8136) and moderate delta, suggesting sensitivity to volatility but with a strong movement potential against the option holder.
-
Similarly, options with a strike price of $90.0 (delta = 0.4143) and a vega of 40.8789 also demonstrate significant advantage due to their 100% ROI, providing a strategic choice if the expectation is that the underlying stocks volatility will diminish, leading to lowered option pricing.
When dealing with option expiring on both May 17, 2024, and June 18, 2025, it's particularly important to balance the Greeks like delta and vega. These help measure how much the option price may move per change in the underlying asset price and the volatility respectively, which is especially critical in short call positions where you believe the stock price will not surpass the strike price.
In conclusion, considering the Greeks alongside striking a balance between the probabilities of various outcomes including remaining out of the money can assist in maximizing the gains from shorting options. Contracts expiring in mid-May 2024 and mid-June 2025, particularly around strike prices incrementally above current price levels adjusted for expected volatility provide compelling opportunities for profitable options trading strategies.
Long Put Option Strategy
Analyzing Starbucks Corporation's long put options, we delve into the Greeks and other metrics to pinpoint the most profitable opportunities. Notably, profitability in put options is influenced by the theta, delta, and the option premium. An analysis focusing on greater decreases in value as the underlying stock price falls (indicated by a delta near -1), a higher rate of time decay (theta), and a reasonable premium will help highlight the most profitable puts.
A long put option with a strike price of $110 expiring on June 21, 2024, exhibits a delta of -0.9967177272, which is near -1, indicating that the put options price will move almost dollar-for-dollar inversely with Starbucks' stock price, which is favorable for a bearish outlook. The theta is 0.009727576, signifying relatively lesser value loss per day, and the premium is set at $20.2. However, what catches the eye is its exceptional ROI of 1.4794306931, the absolute return relative to the investment, alongside a profit of $29.8845, marking it as one of the most profitable options.
Another promising option is the put with a strike price of $145, expiring on June 21, 2024. It shares the same delta of -0.9967177272, ensuring high sensitivity to price declines in the underlying stock. This option has a higher premium of $43.5, but it maintains a compelling ROI of 0.4961954023, and profits amount to $21.5845. This demonstrates substantial potential returns amidst market movements favoring the bearish hypothesis.
For an extended option period, considering the option with a strike price of $120 expiring on January 17, 2025, provides interesting insights. It has a delta of -0.9796617253, and though the premium is elevated at $30.25, the ROI is a notably high 0.8209752066 with a profit expectation of $24.8345. A significant rho of -89.6567980872 also indicates high sensitivity to interest rate changes which could be leveraged in long-term strategic planning.
On further examination, options expiring on June 20, 2025, show significant potential. Specifically, the put with a strike price of $120 has a delta of -0.9673397707 and a premium of $27.98. It not only maintains a lower cost of entry compared to other long-term options but also offers an ROI of 0.4326125804 and a profit of $12.1045.
Conclusively, when selecting the most advantageous long put options for Starbucks Corporation, prioritizing those with deltas nearing -1, lower theta values (reflecting slower time decay), and higher ROIs result in higher profitability. By focusing on these metrics, traders can navigate their options investments more strategically, capitalizing on anticipated downward movements in the stock's price. Selecting options with both near-term and long-term expiries allows for flexibility and adjusting market strategies as required.
Short Put Option Strategy
Analyzing the profitability of short put options for Starbucks Corporation (SBUX) involves a close examination of several key aspects of the options' characteristics, especially the Greeks, premium, ROI (Return on Investment), and profit potential. Short put options are generally viewed as strategies that benefit from a slight increase in the underlying stock price or minimal decrease, as they obligate the seller to buy the stock at the strike price if exercised by the buyer.
A highly effective short put option would exhibit certain Greek values and financial metrics that suggest a decent return with controlled risk. The Greeksdelta, gamma, vega, theta, and rhooffer insights into the sensitivity of an option's price to various factors. For options about to expire within short durations, like those under 20 days, theta (time decay) is particularly impactful, and delta provides insights into price sensitivity relative to the underlying stock movements.
Selecting profitable options requires balancing these Greeks with the premium received and the inherent risks reflected in ROI and actual profit figures. For instance, short put options with a strike price of $70, expiring on 2024-06-21, show notable characteristics. The option has a delta of -0.1152774755, indicating a profit likelihood as the price movement of the underlying is moderately inverse relative to the option. Its theta of -0.0131906821 is relatively aggressive, signaling significant time decay beneficial to the option seller if the stock price stabilizes or rises.
In addition, the vega of this option, at 4.8942617504, suggests a higher sensitivity to implied volatility, which is typical as the strike price moves closer to the money. A substantial premium of $0.36 further enhances its attractiveness, providing direct income from selling these options. Coupled with a 100% ROI, these factors make it a very compelling choice for traders seeking to leverage short put strategies with managed risk and clear profit potentials.
Increasing the duration slightly, options with 19 days to expiry, such as those with a strike of $70 (expiring on 2024-06-14), also present themselves as effective choices. These options have even better Greek values for a short strategy: higher absolute vega (4.7751324945), capturing advantages from volatility swings; a significantly negative delta of -0.1276014761, which provides more downside protection against stock price increases; and a theta of -0.0214818668, which promotes gains from rapid time decay as the option approaches expiry.
The premium of these options is $0.24, also yielding a 100% ROI, making them another optimal selection for traders focused on short-term, high-profitability trades via short puts. Such options balance between extracting value from premiums and the less likelihood of downside movements impacting profitability.
To summarize, focusing on options such as those at a $70 strike price with expiries between 19 to 40 days appears to provide the best balance between risk and potential return in relation to the SBUX stocks current price behavior and expected short-term movements. Traders should consider these options for their superior Greek profiles, profitable premiums, and exceptionally high returns on investment.
Similar Companies in Restaurants:
Chipotle Mexican Grill, Inc. (CMG), Report: Domino's Pizza, Inc. (DPZ), Domino's Pizza, Inc. (DPZ), Yum! Brands, Inc. (YUM), The Wendy's Company (WEN), Report: McDonald's Corporation (MCD), McDonald's Corporation (MCD), Wingstop Inc. (WING), Shake Shack Inc. (SHAK), Papa John's International, Inc. (PZZA), Darden Restaurants, Inc. (DRI), Yum China Holdings, Inc. (YUMC), Restaurant Brands International Inc. (QSR), Dunkin' Brands Group Inc. (DNKN), Luckin Coffee Inc. (LKNCY)
https://www.youtube.com/watch?v=Qlt7V8zE36Y
https://www.fool.com/investing/2024/03/28/can-dutch-bros-become-the-next-starbucks-2-things/
https://www.fool.com/investing/2024/03/28/should-you-buy-magnificent-dividend-stock-with-100/
https://www.fool.com/investing/2024/03/29/is-starbucks-stock-a-buy-near-its-52-week-low/
https://www.fool.com/investing/2024/03/31/nike-lululemon-apple-tesla-starbucks-buy-stock/
https://www.fool.com/investing/2024/04/03/starbucks-stock-upside-wall-street-analyst/
https://www.youtube.com/watch?v=ah174dF52qM
https://www.youtube.com/watch?v=pzS8Ro6vq0Q
https://www.fool.com/investing/2024/04/05/got-5000-these-3-high-yielding-dividend-stocks-are/
https://www.fool.com/investing/2024/04/05/better-stock-to-buy-right-now-chipotle-vs-starbuck/
https://www.fool.com/investing/2024/04/13/1-magnificent-growth-stock-down-31-youll-regret-no/
https://www.fool.com/investing/2024/04/14/3-stocks-billionaires-are-buying/
https://www.fool.com/investing/2024/04/15/3-reasons-buy-beaten-down-growth-stock-no-tomorrow/
https://www.fool.com/investing/2024/04/18/where-will-starbucks-stock-be-in-5-years/
https://www.fool.com/investing/2024/04/20/the-smartest-dividend-stocks-to-buy-with-400-right/
https://www.sec.gov/Archives/edgar/data/829224/000082922424000024/sbux-20240331.htm
Copyright © 2024 Tiny Computers (email@tinycomputers.io)
Report ID: grH4Jl
Cost: $1.21426
https://reports.tinycomputers.io/SBUX/SBUX-2024-05-11.html Home