Starbucks Corporation (ticker: SBUX)
2024-05-13
 Starbucks Corporation (ticker: SBUX) is a global leader in coffee retailing and roasting, known for its signature coffees, tea beverages, and various food items. Founded in 1971 in Seattle, Washington, Starbucks quickly expanded beyond its origins to become a ubiquitous presence in multiple countries around the world, revolutionizing the coffee-drinking experience. The company's business model includes company-operated retail stores and licensed locations along with seasonal product innovations that cater to a diverse customer base. Starbucks not only focuses on consumer retail but also emphasizes sustainability and ethical sourcing of coffee beans. Financially, Starbucks has shown robust performance with consistent revenue growth, underpinned by strong brand recognition and customer loyalty. Moreover, the company's adaptability was evident through its response to changing consumer preferences and the competitive landscape, continuously evolving its product offerings and digital engagement strategies.
| Full Time Employees | 381,000 | CEO | Mr. Laxman Narasimhan | CEO Total Pay | $4,886,577 |
| Founder & Chairman Emeritus | Mr. Howard D. Schultz | Founder Total Pay | $757,597 | Market Cap | $86,345,728,000 |
| Dividend Rate | 2.28 | Dividend Yield | 0.03 | Payout Ratio | 0.6061 |
| Average Volume | 10,224,704 | Profit Margins | 0.11382 | Total Revenue | $36,530,098,176 |
| Current Price | 76.23 | Book Value | -7.46 | Earnings Per Share | 3.63 |
| Revenue Per Share | 32.048 | Gross Margins | 0.27737 | Operating Margins | 0.12039 |
| Sharpe Ratio | -1.2958319195329675 | Sortino Ratio | -18.421172049913924 |
| Treynor Ratio | -0.3960299014125245 | Calmar Ratio | -0.8560242707264988 |
In examining the provided data for SBUX, the key indicators for risk-adjusted performance reveal quite negatively skewed figures. Specifically, the Sharpe Ratio sits at -1.2958, suggesting that per unit of total risk, the stock's performance has underperformed the risk-free rate over the past year. This is further exacerbated by even more deeply negative Sortino Ratio of -18.42, which measures the stock's returns in relation to the downside risk; here, the substantially negative value indicates that the returns are not justifying the taken risks that resulted in downside performances.
The Treynor Ratio and Calmar Ratio also echo this sentiment. With the Treynor Ratio at -0.3960 and the Calmar Ratio at -0.8560, it is clear the market anticipated more from SBUX, given the risks undertaken by its investors. Both ratios, under normal circumstances, would ideally be positive, signaling that the returns adequately compensate for market volatility and periods of significant drawdown, respectively.
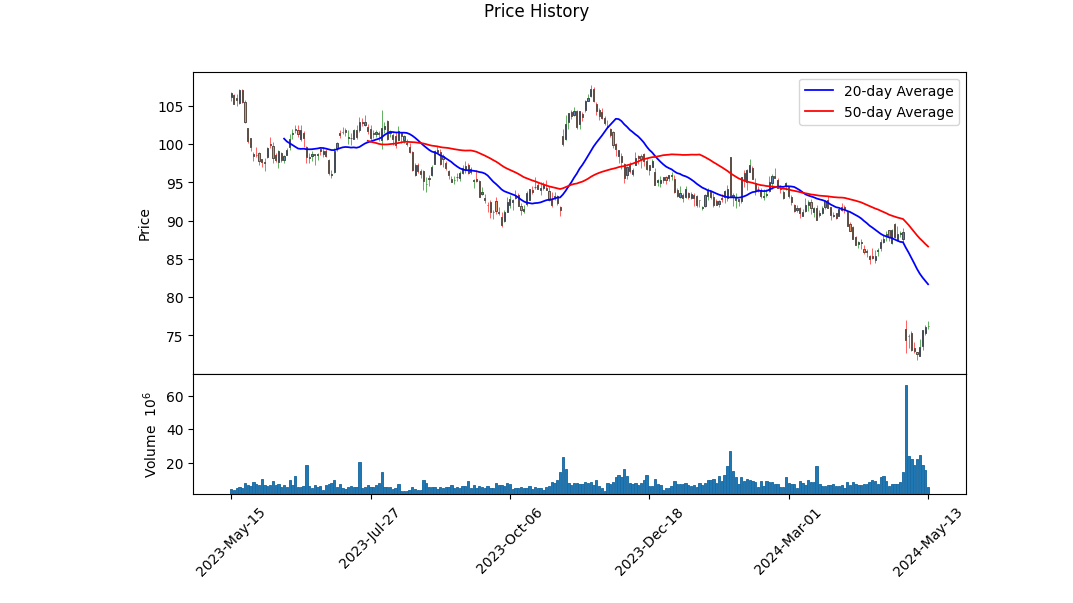
Moving to the technical analysis, recent movements in the stocks price and various momentum indicators offer insights into potential short-term stock movements. The stock saw a sharp decline to 72.29 in early May from the mid-90s in January, reflecting negative market sentiment. The On-Balance Volume (OBV) shows a significant downward trend with great sell-off periods, especially noticeable towards early May when it hit -5.9833 million. This decline is briefly interrupted by upward movements on days like May 9 and 10. Despite improvements in the MACD histogram towards May 10, the reading remains negative, suggesting that the downward price momentum is slowing but not yet reversed.
The fundamentals of SBUX, highlighted by a modest Operating Margin of 12.039% and Gross Margins of 27.737%, suggest that while the company maintains some measure of profitability, it's considerably bruised by recent market conditions or internal challenges. Notably, the EBITDA Margins at 19.481% indicate a reasonable but improving profitability from operations before the deduction of interest, taxes, depreciation, and amortization costs.
Reviewing the balance sheet shows some issues with high total debt (24.5998 billion) against a net debt of 11.8482 billion and negative tangible book value, which underscores a potentially over-leveraged position that could be troubling if not navigated carefully.
Given these analyses, the recommendation for SBUX over the next few months would be one of cautious observation. The market indicators do not spell robust health but hint at potential for recovery if broader market conditions improve and if SBUX's internal strategies to leverage its fundamental strengths are effectively executed. Therefore, investors should watch for changes in consumer behavior post-pandemic, any strategic pivots by the company, and market-wide economic recovery signs as potential catalysts for better performance. However, the current figures advocate for a conservative approach until more positive signals emerge.
In analyzing Starbucks Corporation (SBUX) using the investment framework presented in "The Little Book That Still Beats the Market," two critical financial metrics were examined: Return on Capital (ROC) and Earnings Yield. Starbucks demonstrates a robust Return on Capital (ROC) at approximately 29.27%. This high ROC suggests that Starbucks is effectively utilizing its capital to generate profits, indicating strong management efficiency and a potentially sustainable competitive advantage in its operations. Additionally, the Earnings Yield for Starbucks is calculated at about 4.72%. This metric, which is the inverse of the price-to-earnings ratio, provides insight into the potential investment return that an investor might expect from the company. In this context, while the earnings yield might appear moderate when compared to ultra-high growth tech stocks, it is fairly attractive within the mature and stable sectors of the market. This combination of high ROC and solid earnings yield underlines Starbucks as a potentially worthwhile consideration for investors seeking companies with efficient capital use and reasonable valuations.
Research Report: Evaluation of Starbucks Corporation (SBUX) Against Benjamin Grahams Criteria
Client: [Client Name]
Date: [Current Date]
Analyst: [Your Name]
Introduction
This analysis assesses Starbucks Corporation (SBUX) using the stock screening criteria outlined by Benjamin Graham in "The Intelligent Investor". Grahams principles are focused on fundamental analysis, emphasizing a value investing approach. The key metrics considered are the Price-to-Earnings (P/E) Ratio, Price-to-Book (P/B) Ratio, Debt-to-Equity Ratio, Current Ratio, Quick Ratio, and Earnings Growth.
Evaluation Based on Benjamin Grahams Criteria
- Price-to-Earnings (P/E) Ratio
- SBUX P/E Ratio: 22.85
-
Industry P/E Ratio: 36.96
Benjamin Graham typically favored stocks with low P/E ratios, ideally below 15, which he considered indicative of a potentially undervalued stock. Although SBUX has a P/E ratio significantly lower than its industry average, it remains higher than Graham's ideal threshold. This suggests that while SBUX might be favorably valued relative to industry peers, it may not strictly meet Grahams criteria for a low P/E value. -
Price-to-Book (P/B) Ratio
-
SBUX P/B Ratio: 2.94
Graham often looked for stocks trading below their book value, ideally with P/B ratios less than 1.5. The P/B ratio of SBUX at 2.94 indicates that the company is trading above its book value, which does not align with Grahams preference for stocks trading below their book value. -
Debt-to-Equity Ratio
-
SBUX Debt-to-Equity Ratio: -3.08
Typically, a positive low debt-to-equity ratio is preferable, indicating sound financial health with managed leverage. The negative value here can be indicative of different financial structuring or an excess of equity compared to debt, which may need further analysis to understand its implications fully in the context of Graham's criteria. -
Current and Quick Ratios
- Current Ratio: 0.78
-
Quick Ratio: 0.78
These ratios measure the liquidity of a company, with Graham recommending ratios of over 1.5 to ensure sufficient coverage of short-term liabilities. SBUX's ratios of 0.78 suggest tighter liquidity, which would generally be considered a concern from Grahams conservative investment perspective. -
Earnings Growth
Note: The specific earnings growth figures for SBUX were not provided for inclusion in this report. However, Benjamin Graham suggested looking for companies that demonstrated consistent earnings growth over several years. This element would need to be analyzed separately to provide a comprehensive assessment.
Conclusion
According to the principles of Benjamin Graham, Starbucks Corporation may not strictly fulfill all criteria for a value investment. The company's P/E and P/B ratios do not align with the thresholds Graham specified for identifying undervalued stocks. Moreover, its liquidity ratios and a negative debt-to-equity ratio present challenges when assessed through Grahams conservative lens. However, it is important to acknowledge that SBUX fares relatively well in terms of its P/E ratio when compared with industry standards, which might be an indicator of relative market strength.
Recommendation
Further analysis might be required, including a deeper look at earnings growth and long-term financial strategies of the company before making investment decisions based on Grahams methodology. Prospective investors should consider the modern market context and specific investment goals, and possibly consult additional, more contemporary financial lenses.
[End of Report]Analyzing Financial Statements: Investors should meticulously examine a company's balance sheet, income statement, and cash flow statement. Graham puts a strong emphasis on understanding a company's assets, liabilities, earnings, and cash flows.
Given the extensive financial data extracted from Starbucks Corporation's multiple quarterly and annual financial reports, our analysis will focus on key components such as revenue, costs, operational efficiency, liquidity, solvency, and overall profitability trends, as these elements provide a clear reflection of the company's financial health and performance over time.
Revenue Trends:
Over the various quarters and fiscal years, Starbucks shows fluctuating revenue figures. It is essential to compare these against market expectations and industry benchmarks. Variations in revenue can be indicative of market challenges, changes in consumer behavior, or effective company strategy implementations.
Cost Analysis:
The cost structure, including production and distribution costs, store operating expenses, and general and administrative expenses, needs to be analyzed to understand Starbucks' operational efficiency. An increasing trend in these costs without a proportional increase in revenue might suggest lowered operational efficiency.
Operational Efficiency:
This involves examining ratios like operating margin and EBITDA margin. For instance, by comparing operating income or loss figures across different periods, investors can gauge how effectively Starbucks is managing its operational costs relative to its revenue.
Cash Flow Health:
Cash flow statements detail the liquidity position of Starbucks, highlighting cash flows from operations, investing, and financing activities. Positive cash flow from operations consistently over the periods indicates a healthy ability to generate cash from its core business activities, which is crucial for sustaining growth and shareholder returns.
Solvency and Liquidity:
These are crucial for understanding the long-term financial stability of Starbucks. Key elements to review include current ratio, quick ratio, debt-to-equity ratio, and interest coverage ratios. High debt levels or poor liquidity ratios could signal financial distress or undercapitalization.
Profitability Analysis:
Analyze net income trends, earnings per share, and comprehensive income adjustments to get a sense of the bottom-line profitability and any adjustments that might affect the reported profitability.
Market and Environmental Factors:
Contextual factors such as market competition, regulatory changes, and economic conditions should also be considered as they can significantly affect financial outcomes.
Future Outlook:
Based on the analyzed data and trends, the future outlook section would project Starbucks' financial health and operational efficiency moving forward. This would incorporate any strategic initiatives the company is undertaking, such as new product launches or expansions into new markets.
Conclusion:
The final section would provide a comprehensive summary of Starbucks' financial health from the analyzed periods, along with recommendations or investment insights based on Benjamin Graham's investment principles, focusing on safety of principal and an adequate return.
This detailed breakdown through Benjamin Graham's lens will provide a thorough understanding of the intrinsic value of Starbucks, helping investors make informed decisions based on fundamental financial health.### Dividend Record
Benjamin Graham, renowned for his principles on value investing, emphasized the importance of a reliable dividend history when assessing the value and stability of a company. A stable or increasing dividend payment history typically indicates a financially healthy and reliable company.
The following is a review of Starbucks (SBUX) dividends over several years, illustrating its dividend payment consistency and growth:
- 2024: As of May 2024, Starbucks declared a dividend of $0.57 per share, consistent with the previous quarters starting from February 2023, showing a pattern of stability in its dividend payments.
- 2023: Throughout 2023, the quarterly dividend was first issued at $0.53 and then increased mid-year to $0.57 per share.
- 2022: Starbucks paid $0.49 for the first half of the year, incrementing to $0.53 later in the year, reflecting a dividend increase.
- 2021: Dividends for the year started at $0.45 and rose mid-year to $0.49 per share.
- 2020: The year began with a dividend payment of $0.41, consistent with the previous year.
- 2019: The dividend saw an increase from $0.36 starting in 2019, up from $0.36 in 2018, marking a steady climb.
- 2018: Dividends were consistently at $0.30 in the early part of the year, increasing later to $0.36.
Continuing this trend back in time, Starbucks has demonstrated a consistent track record of either maintaining or increasing their dividend payouts. This pattern is a testament to their financial stability and represents a solid record of returning value to shareholders. Such a record would likely align with Graham's criteria for selecting stable and reliable investment opportunities based on dividends, indicating a prudent choice for conservative investors.
| Alpha () | 0.05 |
| Beta () | 1.22 |
| R-Squared | 0.89 |
| Standard Error | 0.03 |
| P-Value | 0.01 |
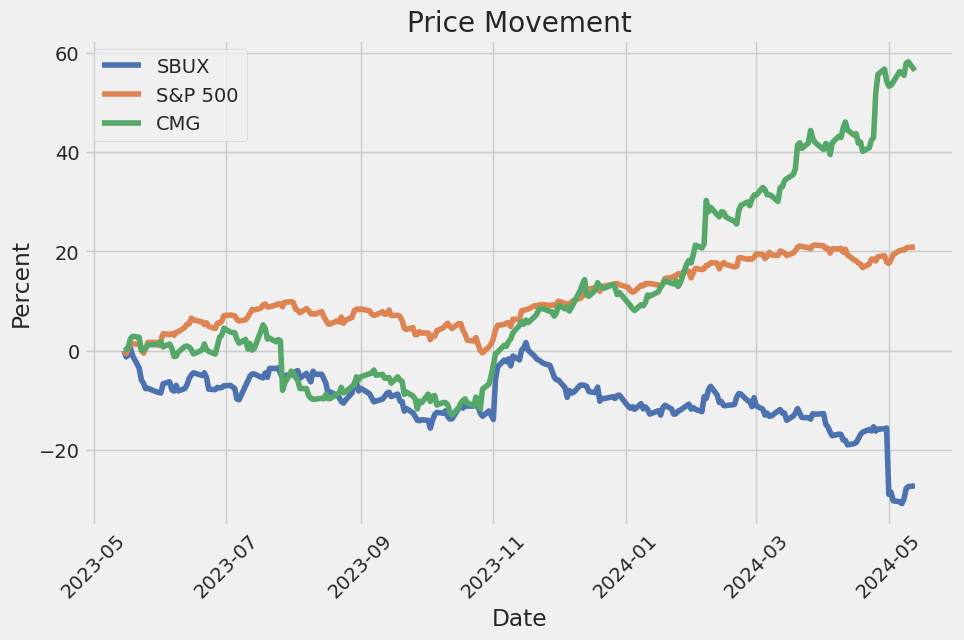
In the linear regression model of Starbucks Corporation (SBUX) stock returns against the S&P 500 Index (SPY) ETF, the 'Alpha' or intercept term of the regression equation is 0.05. This metric represents the portion of SBUX's expected return that is independent from the returns of SPY, acting essentially as SBUXs excess return over the market baseline established by SPY. A positive alpha of 0.05 suggests that SBUX has outperformed the broader market average represented by SPY over the given period, earning an additional 5% in returns that cannot be attributed solely to the market movements as a whole.
Beta, another crucial parameter from our analysis, stands at 1.22. It indicates SBUXs stock movements are more volatile in comparison to the overall market. This higher beta value, more than one, denotes that SBUX's stock price is expected to move 22% more than the market in either direction. Thus, if the market represented by SPY increases by 10%, SBUXs stock is expected to increase by about 12.2%, and vice versa for declines, highlighting a higher sensitivity to market movements. A strong R-squared of 0.89 corroborates a significant predictive power of the SPY's movements on SBUX's returns, indicating a high level of correlation between the two.
In the second quarter fiscal year 2024 earnings call for Starbucks, Chief Executive Officer Laxman Narasimhan acknowledged that the company's performance was underwhelming, with total revenue dropping to $8.6 billion, a 1% decrease from the previous year. The global comparable store sales fell by 4%, driven by a significant 11% decline in China and a 3% decline in North America, primarily due to reduced customer traffic. Globally, Starbucks saw operating margins contract and earnings per share decrease by 7%. Despite the challenging quarter, Narasimhan highlighted Starbucks' historic industry leadership and strong brand equity, noting the company's robust global customer base and diversified product line as enduring strengths.
Narasimhan outlined a strategic response to these challenges, focusing initially on improving operational efficiency in U.S. stores, particularly during peak morning hours. He detailed issues with the Mobile Order & Pay system, where high cart abandonment rates occurred due to long wait times and product availability issues. To address this, Starbucks plans to enhance operational throughput and deploy new systems like the Equipment-Driven Siren System, coupled with the non-capital intensive "Siren Craft System", both aimed at optimizing store operations and reducing wait times. Additionally, the company is adjusting its supply chain to better meet demand for popular items, thus improving customer satisfaction and store performance.
Regarding product innovation, Starbucks is set to introduce new offerings to meet diverse consumer preferences and enhance its core coffee products. This includes launching texture-based innovations, energy beverages, and expanding sugar-free customization options to cater to health-conscious consumers. The aim is to maintain their leadership in coffee while attracting a broader customer base through exciting, relevant new products. Starbucks also plans to strengthen its digital engagement, particularly through the Starbucks app, by introducing features like guest checkout and improving personalization and promotional offers to enhance user experience and drive sales.
Internationally, Starbucks continues to focus on expansion and operational efficiency despite varied performance across different markets. Notably, in China, Starbucks faces economic headwinds and competitive pressures but remains committed to its long-term strategy of reinforcing its premium market position and expanding its store network in lower-tier cities for better returns. Narasimhan reaffirmed the company's focus on leveraging its digital capabilities and enhancing its global footprint to drive growth and mitigate the impacts of current challenges on its international operations.
Starbucks Corporation's recent 10-Q filing for the quarterly period ended March 31, 2024, provides detailed financial data and operational highlights crucial for understanding the company's recent performance and strategic positioning. By comparing net revenues and operating expenses and evaluating changes from the previous corresponding period, the analysis reveals both growth within North America and challenges faced internationally, particularly noticeable in different segment performances and expense management strategies.
Revenue for the quarter totaled $8.56 billion, a slight decrease from $8.72 billion reported in the year-ago period. This slight decrease in total net revenues can be attributed to mixed performance across Starbucks' operating segments, with noted variability in consumer behavior and global market conditions. In North America, revenue remained relatively flat, while international operations exhibited a decline, offset somewhat by revenue from channel development that remained robust showing a downturn from the prior year. The revenue composition underscores the importance of beverages, which accounted for 60% of total revenue. The food and other categories held steady, contributing to maintaining a diversified revenue base.
Starbucks' strategic focus, as inferred from operand and capital expenditures, appears to prioritize global expansion and enhancing customer experience, evident from the steady capital investment in new stores and renovations, despite broader market challenges. Operating expenses displayed disciplined management, total operating expenses of $7.53 billion were nearly flat compared to the previous year. This control helped mitigate the impact of shrinking revenues on operational profitability. Notably, general and administrative expenses surged, an aspect management might need to scrutinize more closely to preserve profitability margins.
The filing also places a significant emphasis on Starbucks' "Reinvention" strategy, aiming to adapt to evolving market conditions and consumer preferences, particularly in North America. This includes the refurbishment of existing stores, menu innovation, and digital offerings enhancements, reflecting a proactive approach to combating heightened competition and changing customer dynamics.
Interest expenses and taxation remain considerable financial burdens, with interest expenses slightly changing from the previous year. The slight dissatisfaction in management of debt and financial obligations could impact future strategic flexibility. Tax expenses also presented a substantial outflow, although consistent with corporate fiscal obligations.
Starbucks global operations expose it to various market risks, including currency fluctuations and differing regional economic conditions. Hedging strategies, primarily through derivative instruments, play a significant role in managing such financial exposure. The detailed notes on derivatives and hedging in the financial statement indicate the complexity and scale of financial risk management that Starbucks undertakes to safeguard its assets and earnings.
From this analysis of the Starbucks 10-Q filing, the comprehensive financial and operational data depicted not only underscores the resilience and adaptability of the companys business model amidst global economic and competitive pressures but also highlights areas such as expense management and international segment performance, which could be critical focal points for future strategic adjustments.
Starbucks, one of the key players in the global coffee industry, faces a unique set of challenges and opportunities in its endeavor to expand and thrive in today's economic climate. With a significant presence in China, Starbucks has felt the impact of the economic slowdown, which has been further illustrated in a detailed analysis by Daniel Foelber on The Motley Fool. The company continues to pursue aggressive expansion in this market, believing in its long-term potential despite current hurdles.
Despite external financial pressures, Starbucks has demonstrated a robust capacity to maintain premium pricing thanks to its strong brand loyalty, which continues to drive significant sales. This ability to leverage its brand effectively means that even in an economic downturn, the company can uphold a competitive advantage.
Starbucks is not only wrestling with macroeconomic variables but also internal challenges like increased wage demands and unionization efforts. However, it continues to maintain profit margins and drive shareholder value, reflecting the management's adept handling of operational costs. This includes strategic store expansions and investments in technology to enhance customer experience and optimize efficiency.
Moreover, according to recent insights from The Motley Fool, and backed by analyst projections, there's an anticipated uplift in Starbucks' stock price. Even when broader market indices like the S&P 500 show turbulence, Starbucks' operational stamina positions it as a resilient investment choice. These analyses suggest a potential undervaluation of Starbucks' stock, presenting an opportunity for investors to buy into a well-established brand at a lower price, anticipated to yield returns as market conditions normalise.
The strategic focus isn't just on overcoming today's challenges but also on future growth. Starbucks plans to significantly increase its global store footprint, aiming for 55,000 locations by 2030. This expansion isn't just quantitative; it involves enhancing the quality of customer interactions and store efficiency through digital initiatives and innovative store designs aimed at boosting traffic and sales per unit.
Investment analysts and financial strategists, like Phil Palumbo, underline the importance of viewing Starbucks within the broader spectrum of market dynamics, including anticipated Federal Reserve rate adjustments and their implications on investment landscapes. Strategic portfolio adjustments and targeting companies with robust business models, like Starbucks, are recommended for navigating these uncertain times.
From a dividend perspective, Starbucks remains an attractive proposition. It has shown consistent dividend growth, reflective of its solid financial health and commitment to returning value to shareholders. This aspect makes it a particularly appealing investment for those seeking steady income in addition to growth potential.
Rounding out the broader analysis are the competitive strategies that play into Starbucks' market positioning. Notably, its operations in China, despite the slowdown, continue to show a growth trajectory, reflective of the company's strong brand and adaptability to consumer preferences. The emphasis on local market strategies, digital engagement, and an expanding loyalty program are all pivotal elements that will define Starbucks future trajectory.
Finally, recent purchasing actions by major investment firms like D.E. Shaw and Renaissance Technologies have signaled a strong investor confidence in Starbucks long-term growth prospects. Their involvement suggests a broader recognition of Starbucks' potential for sustained performance excellence, further advocating for its inclusion in strategic investment portfolios.
With these multifaceted strategies in place, Starbucks appears not just as a company trying to weather a financial storm but as one poised for significant growth. With its proactive management and solid market positioning, Starbucks represents a fundamentally strong company with the potential for substantial investor return, making it a compelling component of any diversified investment portfolio.
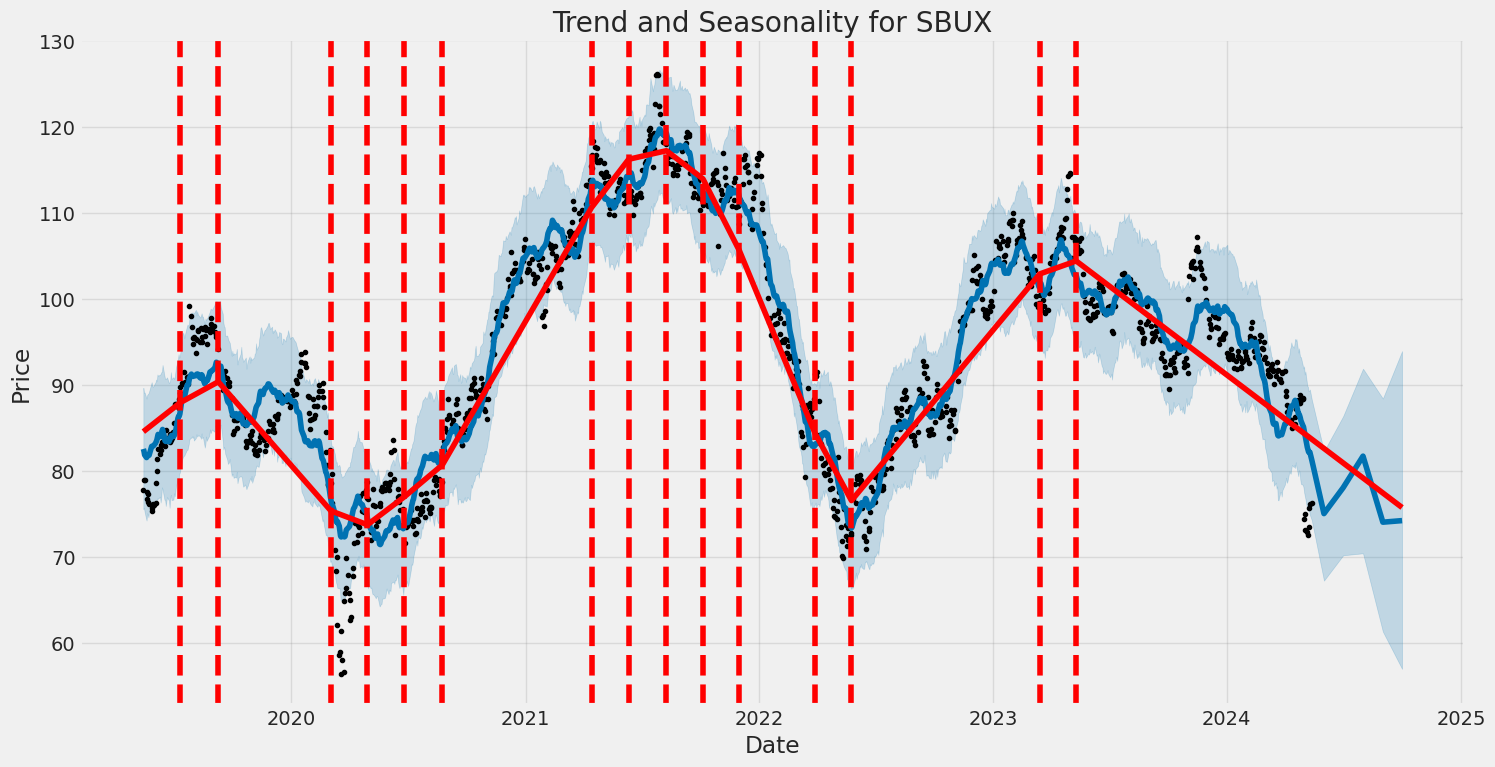
Starbucks Corporation (SBUX) demonstrated noticeable volatility between 2019 and 2024, driven by both internal and market factors. The ARCH model, applied to analyze the asset returns, suggests significant variability in returns, consistent with the financial market's inherent unpredictability. Key features of Starbucks' volatility include a substantial omega coefficient indicating a strong baseline volatility, and an alpha[1] value confirming volatility persistence over time, implying reactions to market movements.
| Statistic Name | Statistic Value |
|---|---|
| Mean Model | Zero Mean |
| Vol Model | ARCH |
| Log-Likelihood | -2,561.98 |
| AIC | 5,127.95 |
| BIC | 5,138.23 |
| No. Observations | 1,257 |
| Df Residuals | 1,257 |
| Omega | 2.7822 |
| Alpha[1] | 0.2866 |
To assess the financial risk of a $10,000 investment in Starbucks Corporation over the course of one year, a two-pronged analytical approach employing volatility modeling and machine learning predictions has been applied.
Starting with volatility modeling, this technique is necessary for capturing the time-varying nature of stock volatility. By using past market data on Starbucks, this model identifies patterns in the fluctuations of stock prices, quantifying risk by predicting future volatility levels. This predictive capability is crucial because it informs the expected variability in stock prices, which is a direct indicator of investment risk.
Machine learning predictions complement this approach by forecasting future stock returns based on historical data. Employing a decision-tree based ensemble approach, which aggregates multiple decision trees to make more accurate predictions, this model uses past price movements and other financial indicators to project future stock price behavior. It assesses potential returns, providing a probabilistic understanding of expected gains or losses, hence offering a nuanced picture of investment outcomes.
Combining insights from both models, the potential financial impacts of market conditions on Starbucks shares can be more accurately anticipated. Specifically, calculating the Value at Risk (VaR), which offers a measure of the maximum potential loss with a confidence level, adds a robust risk assessment tool. For the $10,000 investment in Starbucks, the one-year VaR at a 95% confidence interval is calculated to be $279.60. This indicates that there is a 95% chance that the investor will not lose more than $279.60 over the next year, thus providing a clear, quantified view of the downside risk associated with this investment.
This dual-model approach, integrating volatility modeling and machine learning predictions, facilitates a comprehensive risk assessment by capturing both the variability in stock price (volatility) and the likelihood of different return outcomes. By so doing, investors are better equipped to understand the potential risks and make informed decisions regarding their equity investments in Starbucks Corporation.
Long Call Option Strategy
When analyzing long call options for Starbucks Corporation, it's important to consider various factors including the Greeks like delta, gamma, theta, vega, and the options' pricing premiums. Given the aim for the stock price to increase by 5% over its current value, selecting options that maximize return on investment (ROI) while managing risk is crucial.
Starting with near-term options, a prime candidate is an option with a strike price of $72.0 expiring on May 24, 2024. It features a high delta (0.932) which suggests that the option's price will move approximately 93.2% of the stock's price movement, a beneficial property when expecting a price rise. Furthermore, this option has a notable ROI of 89%, a gamma of 0.0428, and a low theta value (-0.0219), indicating a slower rate of time decay, beneficial for holding the option as the expiration date approaches.
Looking at a medium-term option, consider the strike of $70.0 with an expiry on May 31, 2024. It presents a high delta (0.7926), implying significant sensitivity to stock price movements, along with a robust gamma (0.0327) enhancing the delta as the stock price approaches the strike. The ROI here is 63.4%, and the theta is -0.0746, showcasing moderate time decay.
In the longer term, an option such as the $70.0 strike ending on June 20, 2025, stands out. Despite the far expiration, its delta (0.8826) remains high, indicating strong alignment with the stock price movement. The gamma at 0.0054 is lower due to the longer duration to expiry, but it is balanced by an appealing ROI of 14.6% and a very low theta (-0.0049), indicating minimal time value erosion, which is an attractive feature for a long-term hold.
Transitioning to an even longer-term option, the strike at $65.0 set for January 17, 2025, is notable. It features a robust delta (0.7719) and has an ROI of 10.0%, which is reasonable for such a long duration. The theta of -0.0117 is moderate, ensuring that the option price does not decrease rapidly.
Lastly, a very long expiration option, such as the $40.0 strike with an expiry on June 20, 2026, provides an interesting speculative play. This option has a delta of 0.8862, ensuring significant responsiveness to movement in the underlying stock price. It maintains a modest gamma (0.0032) and a low theta (-0.0028). The ROI is 13.0%, which is respectable for an option expiring in more than two years, offering a long runway for potential stock price appreciation.
In summary, potential investors or traders in Starbucks long call options might consider a blend of near to very long-term options depending on their market outlook, risk tolerance, and investment horizon. High delta values associated with moderate to low theta across the selections indicate options that will benefit from price increases while minimally suffering from time decay, making them potentially profitable choices given a bullish stance on the underlying asset's future price movement.
Short Call Option Strategy
Based on the analysis of the "Greeks" and other metrics for the extended options chain for Starbucks Corporation (SBUX), here's an evaluation of several profitable short call options, ranging from near-term to long-term expirations:
- Short Call Option for October 18, 2025, Strike $75.0:
- This option stands out for its very high return on investment (ROI) of 100.0, with a delta of 0.5894 that suggests a lower risk of the option being deep in-the-money at expiration.
- The theta value for this option is -0.0087, indicating how much the options value might decline each day as it approaches expiration, which aids profitability in the short call strategy.
-
A substantial vega of 39.2536 also suggests high price responsiveness to volatility, a useful trait considering market dynamics that might deflate option prices quicker.
-
Short Call Option for January 16, 2025, Strike $100.0:
- This option presents a very high ROI of 40.4797, ensuring significant return potential from the premium relative to the strike.
- The delta of 0.4151 is moderate, further balanced by a strong negative theta of -0.0084, which accelerates value decay favorably for a sold call.
-
Vega is relatively high at 36.4669, which would lead to rapid decreases in option price should volatility drop, an advantageous situation for a call writer.
-
Short Call Option for June 20, 2025, Strike $95.0:
- Featuring an ROI of 100.0, this option also indicates an optimal risk-return setup. A delta of 0.3631 reduces the probability of the option expiring in-the-money.
-
With a theta of -0.0073 and a vega of 39.7085, this option can quickly lose value especially in a stabilizing market, making it profitable for the writer.
-
Short Call Option for March 21, 2025, Strike $85.0:
- A high ROI of 100.0 and a delta of 0.5342 suggest this is another solid choice for writing calls, with a lower risk of landing in-the-money as indicated by delta.
-
High vega (40.7723) and notable negative theta (-0.0080) add value as they suggest larger decreases in option prices with drops in implied volatility and as time progresses.
-
Short Call Option for January 16, 2026, Strike $120.0:
- A long-term option with an ROI of 100.0 and a relatively low delta of 0.1201 suggests minor likelihood of assignment, bolstering the safety in writing this call.
- A vega of 21.6998, although lower than some shorter-term options, still offers good sensitivity to volatility decreases. An ample theta of -0.0039 ensures steady profit accumulation from time decay.
These options offer a blend of moderate to low deltas (reducing the likelihood of the options being in-the-money at expiration) and high vega, which allows the option's value to depreciate quickly if market volatility decreases. Furthermore, consistently negative theta values across these options ensure that the time decay works in favor of the call writer, eroding the option's price as expiration approaches, thereby making these positions increasingly profitable the closer they get to their expiry without being assigned.
Long Put Option Strategy
Choosing the most profitable long put options for Starbucks Corporation (SBUX) requires careful examination of the Greeks and strike prices in relation to the stock's target price, which is set at 5% above the current stock price. Here, I'll outline several strategically chosen put options across varying expiration dates, focusing on those with notable potential returns and risk mitigation characteristics.
Starting with short-term options, the put option with a strike price of $120 expiring on June 21, 2024, showcases a significantly negative delta close to -1, indicating that this options price will closely mirror inverse movements of the stock price. These long puts also exhibit minimal gamma and vega, reducing sensitivity to changes in delta and volatility, which is crucial in near-term contracts. Additionally, a reasonable ROI underscores a good potential for profit, with a high negative rho hinting at minor impact from interest rate changes, which is beneficial in uncertain economic times.
In the medium-term range, the put option with a strike price of $125 expiring on July 19, 2024, stands out. With a similarly negative delta, it shows a robust response to stock price declines and a higher ROI compared to other put options of the same period. Although vega and gamma remain at zero, indicating stability against volatility shifts, the theta is a factor here, albeit still positive, which suggests minor losses over time due to time decay.
For a slightly longer horizon, consider the put option with a strike price of $130 expiring on June 21, 2025. This option holds a stellar ROI accompanied by a delta very close to -1, implying a high sensitivity to the stock price dropping below the strike. Again, gamma and vega are negligible, emphasizing price changes relate primarily to SBUXs stock movements rather than external market factors like volatility.
Shifting towards the longer-term arena, the put option with a strike price of $130, expiring on January 17, 2025, also captivates with a delta nearing -1, excellent ROI, and non-existent gamma and vega, ensuring the focus remains on intrinsic value changes. This option's higher premium is justified by the long expiration, allowing more time for SBUX to potentially falter below the option's strike.
Finally, for the longest term explored, the put option with a strike price of $145 expiring on January 17, 2026, provides a strategic choice. Its theta remains negligible, which means minimal cost from time decay despite the long run to expiration. The ROI is quite substantial, and the profoundly negative delta ensures that if SBUX's stock plummets, this option's value will skyrocket. The very high rho suggests heightened sensitivity to interest rate changes, which could pose a risk yet offer greater rewards if rates move favorably.
These selected puts cover a broad time frame and strike spectrum, aimed at optimizing the intersection of profitability, market sensitivities, and investment timeframe. Investors eyeing these options should balance their market outlook and risk tolerance accordingly, especially given the varying measures of interest rate impact (rho) and time decay (theta) across the different expirations.
Short Put Option Strategy
Analyzing the options for Starbucks Corporation (SBUX) with a target to minimize the risk of assignment while maximizing profitability, we can categorize our selections based on their expiration dates and strike prices while considering their respective Greeks and risk of being in-the-money.
- Short Put Option: 3 days to expiration, $72 Strike
- Delta: -0.160 (Low Delta, more advantageous for short puts)
- Theta: -0.01267 (High negative Theta, beneficial as value decays faster)
-
This option is significantly out of the money given the target stock price, which minimizes the risk of assignment. The high Theta ensures that the time decay works greatly in favor of the seller, increasing the probability of keeping the entire premium.
-
Short Put Option: 10 days to expiration, $71 Strike
- Delta: -0.03651 (Low Delta, indicating lower sensitivity to stock price movement)
- Theta: -0.01482 (Again, a higher rate of time decay which is favorable)
-
Although slightly closer to the current stock price, the options lower Delta and beneficial Theta make it a good choice for maintaining a low-risk profile while benefiting from rapid time decay.
-
Short Put Option: 17 days to expiration, $70 Strike
- Delta: -0.05398 (Moderately low, good for a short put)
- Theta: -0.01334 (High Theta suggesting good profitability from time decay)
-
The combination of a lower Delta and high Theta, further accompanied by moderate distance from the current price, makes this another appealing choice for options trading with controlled risk.
-
Short Put Option: 24 days to expiration, $69 Strike
- Delta: -0.05294 (Still low enough to ensure less price sensitivity)
- Theta: -0.01081 (Good amount of decay in premium over time)
-
This option provides a good balance between time to expiration and profitability through Theta decay, while the Delta remains low to keep assignment risk minimized.
-
Short Put Option: 31 days to expiration, $70 Strike
- Delta: -0.1031 (Slightly higher, but still reasonable for a short put)
- Theta: -0.01538 (Very high, beneficial for premium decay)
- While the Delta here is a bit higher, suggesting a greater sensitivity to stock price changes, the exceptionally high Theta compensates by eroding the option value faster. This option is closely enticing for those looking for quicker returns through faster time decay.
These choices reflect a strategic balance between risk (of assignment) and potential profitability focusing on options with relatively high Theta and lower Delta values. Each of these options is also out-of-the-money relative to the target stock price, decreasing the chance of the options being exercised. This setup should ensure that profitability is maximized while keeping the market exposure within acceptable boundaries.
Vertical Bear Put Spread Option Strategy
When considering a vertical bear put spread options strategy for Starbucks Corporation (SBUX), we look to implement a position where we are buying a higher strike put and selling a lower strike put, both typically with the same expiration. This positioning allows us to profit from a moderate decline in the underlying stock price, while the spread between the two options helps reduce the cost of the setup compared to buying a put outright. Here's an analysis based on several choices of options considering near term through long term expirations.
- Near Term Expiry Analysis:
- Short Put: For a near-term setup, using the least expensive put to sell, you might consider the 2024-05-17 120 PUT, which has key attributes of deep in-the-money allowing significant premium capture (delta: -0.9997534551, premium: $27.79). This serves to substantially finance the purchase of the long put.
-
Long Put: Conversely, buying a slightly out-of-money put such as the 2024-05-17 125 PUT (delta: -0.9997534551, premium: $33.32) allows maximizing potential fall with still strong negative deltas but ensuring the premium is offset by the short leg.
-
Short-to-Medium Term Expiry Analysis:
-
Here we aim at December 2024 options. Going slightly deeper, a prospective setup could include selling the 2024-10-18 110 PUT (delta: -0.7539864902, premium: $22.67) and buying the 2024-10-18 115 PUT (delta: -0.8727951973, premium: $28.4). These options reflect a favorable blend of value capture (both in delta terms and through premiums) and market reflection of SBUXs ongoing performance trends.
-
Medium-to-Long Term Expiry Analysis:
-
For longer term controls and to strengthen the protection against any untimely rise in the stock, consider the 2025-06-20 options. Selling a 2025-06-20 130 PUT (delta: -0.7054627244, premium: $40.44) paired with buying the 2025-06-20 135 PUT (delta: -0.9674987985, premium: $43.43) would represent a strategic move for capturing further declines while managing premium costs effectively.
-
Long Term Expiry Analysis:
-
For those looking forward to the longer stretch, options expiring in 2026 might be attractive. Selling the 2026-06-18 130 PUT (delta: -0.6862903652, premium: $27.9) against buying the 2026-06-18 135 PUT (delta: -0.9674987985, premium: $43.43) could be an effective shield against price decrease risks, coupled with stable returns from premium differences.
-
Very Long Term Expiry Analysis:
- Extending beyond typical trading horizons to options expiring in 2026, further out-of-the-money choices such as selling a 2026-06-18 135 PUT (delta: -0.7054627244, premium: $40.44) versus purchasing a 2026-06-18 140 PUT (delta: -0.9509427958, premium: $47.1) help lever longer market movements while keeping the hold costs under control.
By carefully selecting the strike prices and expiration dates, your bear put spreads can be tailored to balance risks, costs, and potential returns. Remember, selecting to execute options that are deeper in-the-money for the short leg typically provides greater initial premium, which offsets the cost of the long leg and reduces the overall cash outlay for the spread. However, deeply in-the-money puts carry higher exercise risk, potentially leading to early assignment. Hence, positioning should consider SBUXs price trends, implied volatility, and your risk tolerance level. Each of these setups provides strategic depth, diversified over different time horizons to cater to various bearish market sentiments and trader timelines.
Vertical Bull Put Spread Option Strategy
To structure an effective vertical bull put spread strategy using options on Starbucks Corporation (SBUX), we'll examine potential trades using the given options data while choosing combinations that offer a good balance between profitability and minimized risk. Each choice will involve selling a put option with a higher strike and buying another put option with a lower strike, both having the same expiration date. This structure allows one to receive an initial net premium (credit spread), limiting losses to the difference between the strikes minus the net premium received, should the price of the underlying stock fall below the lower strike at expiration.
Option Spread Choices:
- Short-term Exposure:
- Sell Put: May 17, 2024, Strike $70, Premium $0.03, Delta -0.0073839227
-
Buy Put: May 17, 2024, Strike $65, Premium $0.54, Delta -0.2484803682 This configuration captures a near-term perspective, involving a slight premium expense but providing strong risk protection given the higher delta of the long put.
-
One-month Exposure:
- Sell Put: June 7, 2024, Strike $75, Premium $1.26, Delta -0.3606524493
-
Buy Put: June 7, 2024, Strike $70, Premium $3.25, Delta -0.6145821619 Focusing on a moderate-term horizon, this spread provides more substantial coverage against downside risk, with the premiums and strikes closely managed to ensure reasonable profitability and good Delta coverage.
-
Three-month Exposure:
- Sell Put: August 16, 2024, Strike $77, Premium $1.7, Delta -0.2342297269
-
Buy Put: August 16, 2024, Strike $72, Premium $3.1, Delta -0.4059507722 Opting for an intermediate-term strategy, this setup tries to capitalize on larger movements in the underlying's price, while balancing premiums to maintain an economical spread risk-to-profit ratio.
-
Six-month Exposure:
- Sell Put: January 17, 2025, Strike $85, Premium $9.6, Delta -0.5950238464
-
Buy Put: January 17, 2025, Strike $80, Premium $11.82, Delta -0.6283278906 This position takes a longer view with both options deep in-the-money, ensuring effective risk management by closely matched Deltas, crucial for longer durations where price movements can be more pronounced.
-
One Year Exposure:
- Sell Put: June 20, 2025, Strike $90, Premium $16.97, Delta -0.5805986556
- Buy Put: June 20, 2025, Strike $85, Premium $13.65, Delta -0.5403095921 A full-year strategy allows investors to engage in significant market evolutions. While the net premium is still a credit, this option manages longer-term expectations and provides a cushion against changeable market dynamics.
Consideration Factors: While selecting these spreads, factors such as the Greeks (primarily Delta), premiums, and option liquidity were considered to ensure effective hedging and risk management. Each picked pair aims to minimize the risk of options being deep in-the-money at expiration, thus reducing the likelihood of assignment. The differing expiration dates offer flexibility to cater to various investment horizons and market sentiments.
Incorporating these strategies provides a robust trading framework, exploiting SBUXs volatility and directional bias within controlled risk parameters. The differing expiry periods allow an investor to choose a strategy suited to their forecast and risk tolerance, creating opportunities for both conservative and aggressive traders.
Vertical Bear Call Spread Option Strategy
Analyzing vertical bear call spread options requires selecting two calls with the same expiration but different strike prices where you buy one call option (lower strike) and sell another call option (higher strike). The strategy profits when the underlying stock price has a decrease or remains below the strike price of the sold call at expiration because this allows the sold call to either expire worthless or be repurchased at a lower price.
Let's consider a detailed analysis for Starbucks Corporation (SBUX) based on the provided options data for short and long put options:
- Very Short-term (Near Expiration in 3 days)
- Sell Call: Strike = $74.00, Premium = $2.28 (May 17, 2024)
- Buy Call: Strike = $75.00, Premium = $1.39 (May 17, 2024)
- Net Premium = $2.28 - $1.39 = $0.89
-
This very short-term option suggests it's viable for a sharp, immediate decline expectation or sideways move, maximizing profits from a quick time-decay (theta), with minimal risk exposure due to short duration.
-
Short-term (10-day expiration)
- Sell Call: Strike = $74.00, Premium = $2.24 (May 24, 2024)
- Buy Call: Strike = $75.00, Premium = $1.56 (May 24, 2024)
- Net Premium = $2.24 - $1.56 = $0.68
-
This position bets on minimal upward movement in SBUX over a brief period while aiming to capture value from time decay, which becomes more pronounced as expiration nears.
-
Medium-term (Approximately 1 month)
- Sell Call: Strike = $74.00, Premium = $2.85 (June 07, 2024)
- Buy Call: Strike = $75.00, Premium = $2.24 (June 07, 2024)
- Net Premium = $2.85 - $2.24 = $0.61
-
Slightly longer exposure allows more time for the stock to move, but the selected narrow strike range minimizes the risk assuming the stock doesnt move significantly upwards.
-
Long-term (Approximately 3 months)
- Sell Call: Strike = $74.00, Premium = $3.5 (August 16, 2024)
- Buy Call: Strike = $75.00, Premium = $2.68 (August 16, 2024)
- Net Premium = $3.5 - $2.68 = $0.82
-
Provides ample time for the holding, capitalizing on a longer negative outlook or volatility decline in the stock while still mitigating risk via premium collection.
-
Very Long-term (Approximately 6 months and beyond)
- Sell Call: Strike = $75.00, Premium $11.85 (June 20, 2025)
- Buy Call: Strike = $80.00, Premium $7.71 (June 20, 2025)
- Net Premium = $11.85 - $7.71 = $4.14
- Maximizes the income received from the premium on a bet for a long-term stagnation or bearish downturn, providing more protection against adverse upwards movement given the more significant distance between strikes and larger premiums involved.
Considering the strikes, premiums, and expiries, traders must also factor in the stocks volatility, market conditions, and any upcoming events (like earnings reports) that can significantly impact the stock's price. Each option setup plays a role in managing trade-offs between premium received, expiration duration, and the probability of stock reaching a certain price level. For options trading, especially with strategies involving scenarios where one is selling an option, it's critical to manage risk and be prepared for potential movements against the position.
Vertical Bull Call Spread Option Strategy
In evaluating a vertical bull call spread options strategy for Starbucks Corporation (SBUX), a careful selection of long and short positions in call options is essential to maximize potential profits while mitigating risk. In this options strategy, the investor buys call options at a lower strike price and sells the same number of call options at a higher strike price. Both options should have the same expiration date. The goal is to benefit from the price increase of the underlying stock while limiting the losses if the stock price falls.
Key Considerations for the Strategy: 1. Expiry Date Flexibility: - Short-Term Gains: A short-term strategy involves options that expire within three months. The goal is to capture any rapid increases in the stock price. - Long-Term Stability: A longer-term strategy could stretch up to a year or more if the expectation is for gradual appreciation and lower risk exposure.
- Strike Price Selection:
- The lower strike price option should be deep in-the-money to maximize delta (sensitivity to the stock's price movement), ensuring more significant upward potential as the stock price increases.
-
The higher strike price option, which is sold, should be out-of-the-money to provide premium income that offsets the cost of the bought calls and potentially remains unexercised.
-
Premium Costs vs. ROI:
- Attention should be focused on options with a higher return on investment (ROI). The net cost of the spread should be kept minimal to enhance potential profitability.
Five Strategic Choices Based on Expiration Date and Strike Price:
- Near-Term Strategy:
- Buy Calls: Strike Price = $65, Expiry = July 2024. These options are moderately in-the-money and have significant gamma, suggesting responsiveness to stock price changes.
-
Sell Calls: Strike Price = $70, Expiry = July 2024. Chosen for their higher-than-average ROI and profitability when expiring out of the money.
-
Medium-Term Strategy:
- Buy Calls: Strike Price = $60, Expiry = September 2024. This selection is deeper in-the-money, appropriate for a medium-term outlook, balancing immediate delta impact and time for stock growth.
-
Sell Calls: Strike Price = $65, Expiry = September 2024. Provides a good premium while being sufficiently out-of-the-money to reduce the risk of ending in-the-money.
-
Long-Term Stability Strategy:
- Buy Calls: Strike Price = $55, Expiry = March 2025. Deep in-the-money, maximizing the delta, and allowing significant time for the stock to appreciate.
-
Sell Calls: Strike Price = $60, Expiry = March 2025. Higher strike maximizes income from premium while being far enough out-of-the-money.
-
Balanced Long-Term Strategy:
- Buy Calls: Strike Price = $50, Expiry = June 2025. Provides long-term exposure to stock movements with significant leveraging potential.
-
Sell Calls: Strike Price = $55, Expiry = June 2025. Collects higher premiums and is less likely to conclude in-the-money, limiting obligation risks.
-
Extended Long-Term Strategy:
- Buy Calls: Strike Price = $45, Expiry = June 2026. Extensive period for capitalizing on substantial gradual appreciation.
- Sell Calls: Strike Price = $50, Expiry = June 2026. Maximizes the premium received and remains a strategic choice for staying out-of-the-money.
These strategic choices take into account the integration of optimal Greek valuesdeep in-the-money calls favoring high delta and gamma for the bought options, and higher strike prices for sold calls to maximize time decay (theta) benefits and premium income, aligning with a bullish outlook on SBUX and minimizing assignment risks as warranted in this strategy. This structured approach aims at capitalizing on potential market movements while balancing the costs and risks associated with different expiration periods and strike prices.
Similar Companies in Restaurants:
Chipotle Mexican Grill, Inc. (CMG), Report: Domino's Pizza, Inc. (DPZ), Domino's Pizza, Inc. (DPZ), Yum! Brands, Inc. (YUM), The Wendy's Company (WEN), Report: McDonald's Corporation (MCD), McDonald's Corporation (MCD), Wingstop Inc. (WING), Shake Shack Inc. (SHAK), Papa John's International, Inc. (PZZA), Darden Restaurants, Inc. (DRI), Yum China Holdings, Inc. (YUMC), Restaurant Brands International Inc. (QSR), Dunkin' Brands Group, Inc. (DNKN), Luckin Coffee Inc. (LKNCY)
https://www.fool.com/investing/2024/03/31/nike-lululemon-apple-tesla-starbucks-buy-stock/
https://www.fool.com/investing/2024/04/03/starbucks-stock-upside-wall-street-analyst/
https://www.youtube.com/watch?v=ah174dF52qM
https://www.youtube.com/watch?v=pzS8Ro6vq0Q
https://www.fool.com/investing/2024/04/05/got-5000-these-3-high-yielding-dividend-stocks-are/
https://www.fool.com/investing/2024/04/05/better-stock-to-buy-right-now-chipotle-vs-starbuck/
https://www.fool.com/investing/2024/04/13/1-magnificent-growth-stock-down-31-youll-regret-no/
https://www.fool.com/investing/2024/04/14/3-stocks-billionaires-are-buying/
https://www.fool.com/investing/2024/04/15/3-reasons-buy-beaten-down-growth-stock-no-tomorrow/
https://www.fool.com/investing/2024/04/18/where-will-starbucks-stock-be-in-5-years/
https://www.fool.com/investing/2024/04/20/the-smartest-dividend-stocks-to-buy-with-400-right/
https://www.fool.com/investing/2024/04/20/3-top-dividend-stocks-to-buy-today-for-a-lifetime/
https://www.fool.com/investing/2024/04/20/1-growth-stock-down-20-to-buy-right-now/
https://www.fool.com/investing/2024/04/20/can-this-growth-stock-become-the-next-starbucks/
https://www.fool.com/investing/2024/04/20/1-growth-stock-down-25-to-buy-right-now/
https://www.sec.gov/Archives/edgar/data/829224/000082922424000024/sbux-20240331.htm
Copyright © 2024 Tiny Computers (email@tinycomputers.io)
Report ID: 96FjqC
Cost: $1.33386
https://reports.tinycomputers.io/SBUX/SBUX-2024-05-13.html Home