Starbucks Corporation (ticker: SBUX)
2024-05-14
 Starbucks Corporation (NASDAQ: SBUX) is a globally renowned coffeehouse chain, established in 1971 in Seattle, Washington. It operates a substantial number of outlets worldwide, offering a diverse range of products that include premium coffee, handcrafted beverages, fresh food items, and consumer goods such as coffee beans and equipment. Over the years, Starbucks has leveraged its strong brand identity and innovative offerings to become one of the most recognized names in the food and beverage industry. The company has consistently focused on enhancing customer experience through digital innovation like its mobile app and loyalty programs. In addition to its core retail operations, Starbucks also emphasizes corporate social responsibility, aiming for sustainable sourcing and ethical business practices across its supply chain. Analyst consensus often points to Starbucks as a resilient entity in the market, backed by robust financial performance and strategic global expansion plans.
| Full-Time Employees | 381,000 | Previous Close | 76.18 | Open | 76.25 |
| Day Low | 75.55 | Day High | 76.73 | Dividend Rate | 2.28 |
| Dividend Yield | 0.0299 | Ex-Dividend Date | 1715817600 | Payout Ratio | 0.6061 |
| Five Year Avg Dividend Yield | 1.95 | Beta | 0.966 | Trailing P/E | 20.82507 |
| Forward P/E | 19.945911 | Volume | 5,023,739 | Average Volume | 10,314,096 |
| Market Cap | 85,626,462,208 | 52-Week Low | 71.80 | 52-Week High | 107.66 |
| Price to Sales Trailing 12 Months | 2.3439975 | 50-Day Average | 86.608 | 200-Day Average | 93.87105 |
| Trailing Annual Dividend Rate | 2.24 | Trailing Annual Dividend Yield | 0.029404042 | Enterprise Value | 108,379,086,848 |
| Profit Margins | 0.11382 | Float Shares | 1,108,029,794 | Shares Outstanding | 1,132,700,032 |
| Shares Short | 17,534,800 | Shares Percent Shares Out | 0.0155 | Held Percent Insiders | 0.0204 |
| Held Percent Institutions | 0.77045 | Short Ratio | 2.17 | Book Value | -7.46 |
| Earnings Quarterly Growth | -0.15 | Net Income to Common | 4,157,700,096 | Trailing EPS | 3.63 |
| Forward EPS | 3.79 | PEG Ratio | 3.02 | Enterprise to Revenue | 2.967 |
| Enterprise to EBITDA | 15.23 | 52-Week Change | -0.27640575 | S&P 52-Week Change | 0.2704494 |
| Last Dividend Value | 0.57 | Current Price | 75.595 | Target High Price | 111.42 |
| Target Low Price | 69.64 | Target Mean Price | 83.4 | Total Cash | 3,126,599,936 |
| Total Cash Per Share | 2.76 | EBITDA | 7,116,299,776 | Total Debt | 25,209,399,296 |
| Quick Ratio | 0.563 | Current Ratio | 0.859 | Total Revenue | 36,530,098,176 |
| Revenue Per Share | 32.048 | Return on Assets | 0.12057 | Free Cashflow | 2,832,212,480 |
| Operating Cashflow | 6,537,800,192 | Earnings Growth | -0.139 | Revenue Growth | -0.018 |
| Gross Margins | 0.27737 | EBITDA Margins | 0.19481 | Operating Margins | 0.12039 |
| Sharpe Ratio | -1.3283 | Sortino Ratio | -18.9473 |
| Treynor Ratio | -0.4058 | Calmar Ratio | -0.8737 |
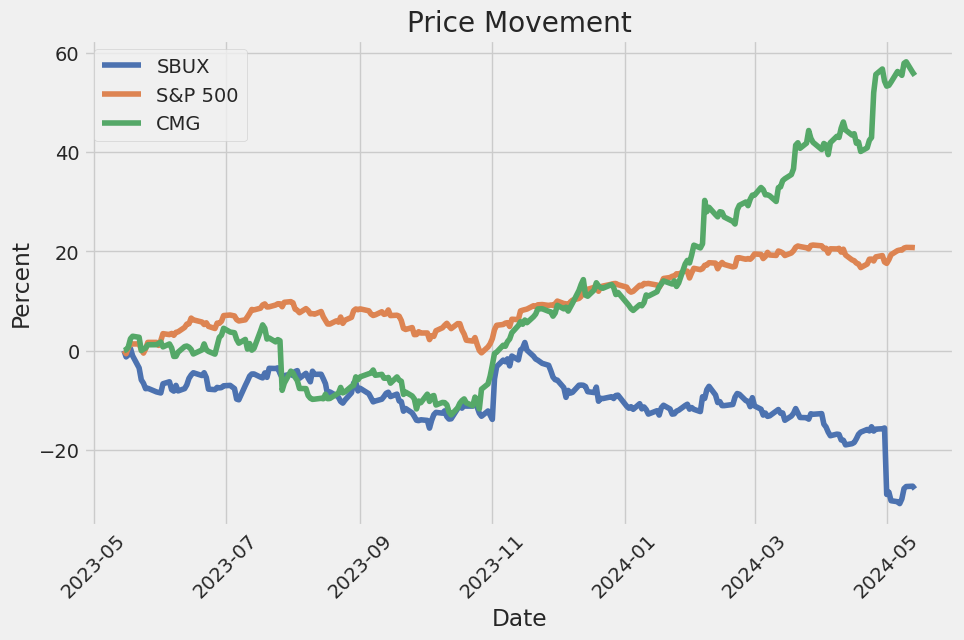
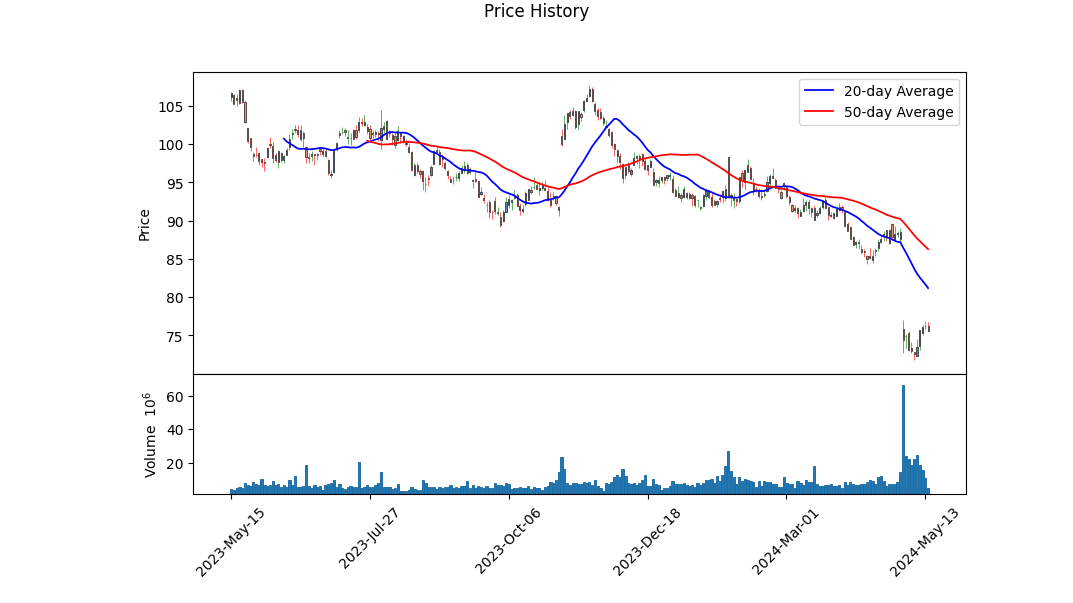
The stock of Starbucks (SBUX) has experienced substantial volatility over the recent months. From Januarys high near $94, the stock has descended to a low around $73 by early May, showing significant downward pressure. With current prices attempting to stabilize around $76, several technical indicators offer crucial insights into potential future movements.
Key technical indicators such as the On-Balance Volume (OBV) show fluctuations, suggesting a mixed sentiment. The decreasing trend in OBV, which turned positive recently, signifies some buying interest potentially returning. However, the MACD histogram's consistent negative value, although progressively lessening, indicates lingering bearish momentum.
From a fundamental perspective, Starbucks remains robust with solid revenue figures and significant profitability. The operating margins of 12.04% and gross margins of 27.7% highlight the company's stable performance in core operations. Despite this, the company reports negative retained earnings signaling historical profit distributions exceeding profits. This needs careful monitoring alongside its significant debt levels, indicated by a net debt position of $11.848 billion.
The risk-adjusted return measures paint a grim picture. The negative Sharpe Ratio of -1.3283, Sortino Ratio of -18.9473, Treynor Ratio of -0.4058, and Calmar Ratio of -0.8737 reflect poor risk-adjusted performance over the past year. These low metrics suggest that the stock has underpinned more volatility and lower returns than acceptable for risk standards, which influences investor sentiment negatively.
The financial health and analyst scores, such as an Altman Z-Score of 2.8513 and a Piotroski Score of 8, suggest that while there are risks, Starbucks remains fundamentally sound. The company shows resilience with a respectable market capitalization of $86.2 billion but must address working capital challenges to maintain this stance.
Given these mixed signalssolid fundamental performance yet concerning risk measures and technical indicatorsthe short-term outlook for Starbucks stock suggests caution. The stock may face continued volatility due to market uncertainties and a currently bearish overarching sentiment. However, if fundamentals continuing to support stability, a potential upward correction may be seen in upcoming months, driven by renewed investor confidence or market conditions aligning favorably. Adaptively monitoring these key indicators will be essential for making informed investment decisions.
In evaluating the financial performance of Starbucks Corporation (SBUX) using the metrics outlined in "The Little Book That Still Beats the Market," we observe a robust Return on Capital (ROC) of 29.27%, which signifies that Starbucks is effectively utilizing its capital to generate substantial profits. This high ROC indicates that the company has a strong operational efficiency and is skilled at turning investments into profit. On the other hand, the earnings yield of 4.76% provides insight into the company's return relative to its current share price. An earnings yield of 4.76% suggests that investors are earning this percentage in terms of earnings per share from their investment in Starbucks. While this yield may seem modest, it is essential to consider it in the context of the company's market stability, growth potential, and overall industry standing. These metrics collectively imply that Starbucks is a profitable entity with adept capital management, making it a potentially attractive investment choice for long-term growth.
Research Report on Starbucks Corporation (SBUX) Relative to Benjamin Graham's Investment Criteria
In "The Intelligent Investor," Benjamin Graham lays out a set of principles for selecting stocks that emphasize value investing and mitigating risk. I'll compare several key financial metrics of Starbucks Corporation (SBUX) to Graham's criteria to evaluate how this company measures up.
1. Price-to-Earnings (P/E) Ratio
- Starbucks P/E Ratio: 22.635
- Industry P/E Ratio: 37.204
- Grahams Criterion: Low P/E ratio compared to industry peers.
Analysis: Starbucks' P/E ratio of 22.635 is significantly lower than the industry average of 37.204. According to Grahams approach, this suggests that Starbucks may be undervalued relative to its peers, making it an attractive option based on the P/E ratio criterion.
2. Price-to-Book (P/B) Ratio
- Starbucks P/B Ratio: 2.908
- Grahams Criterion: Stocks trading below their book value.
Analysis: While Starbucks has a P/B ratio of 2.908, it does not meet Grahams ideal of trading below book value. This indicates that the market price is higher than the company's book value, suggesting a premium valuation. This may indicate a strong market perception of Starbucks future growth prospects, though it does not align strictly with Grahams conservative approach.
3. Debt-to-Equity Ratio
- Starbucks Debt-to-Equity Ratio: -3.077
- Grahams Criterion: Low debt-to-equity ratio to indicate lower financial risk.
Analysis: The negative debt-to-equity ratio of -3.077 for Starbucks is quite unusual and typically indicates negative shareholders' equity. This suggests that Starbucks has more liabilities than assets, which is contrary to Grahams preference for low financial risk. This metric highlights potential financial instability, and it significantly diverges from Grahams principles.
4. Current and Quick Ratios
- Current Ratio: 0.782
- Quick Ratio: 0.782
- Grahams Criterion: Higher ratios to indicate the ability to cover short-term liabilities with short-term assets.
Analysis: Starbucks' current and quick ratios are both 0.782. Ratios below 1 suggest that the company may not have sufficient short-term assets to cover its short-term liabilities, failing to meet Grahams standard of financial stability. This indicates potential liquidity concerns, making Starbucks a riskier investment according to Graham's criteria.
Conclusion
Based on Benjamin Grahams investment principles:
- Positive: Starbucks' P/E ratio is favorable compared to its industry average, suggesting it might be undervalued and offering a potential investment opportunity.
- Negative: The P/B ratio indicates that the stock is trading at a premium, not meeting Grahams preference for undervalued stocks.
- Negative: The negative debt-to-equity ratio is a significant red flag concerning financial risk and stability.
- Negative: The current and quick ratios are below 1, raising liquidity concerns.
While Starbucks possesses a comparatively attractive P/E ratio, its other financial metrics, particularly the debt-to-equity and liquidity ratios, do not align with Grahams conservative criteria. Investors following Grahams value investing philosophy may view Starbucks as a risky investment due to its financial structure and liquidity issues. However, some may argue that Starbucks' brand strength and growth prospects could justify its current valuation and financial strategy.
Recommendations
Investors should weigh these considerations carefully. While Starbucks valuation appears attractive in terms of its P/E ratio, potential risks highlighted by its debt structure and liquidity should not be overlooked. Further qualitative analysis, such as assessments of management quality, competitive position, and long-term growth prospects, would provide additional context for an informed investment decision.### Analyzing Financial Statements
Introduction:
An integral part of making informed investment decisions involves a meticulous examination of a companys financial statements. According to Benjamin Graham in "The Intelligent Investor," a deep understanding of a companys assets, liabilities, earnings, and cash flows is essential. This section delves into the financial statements of Starbucks Corporation for the fiscal year ending October 1, 2023, providing a comprehensive analysis.
1. Balance Sheet:
The balance sheet offers a snapshot of the companys financial position at a specific point in time, detailing what the company owns (assets) and owes (liabilities), as well as the equity held by shareholders.
Assets: - Current Assets: Starbucks reported $6,465 million in current assets as of Q2 2024, a slight decrease from $7,301 million at the end of FY2023. The reduction may indicate efficient inventory turnover and better receivables management. - Non-current Assets: Significant items include property, plant, and equipment (net) at $7,817 million and operating lease right-of-use assets at $8,686 million. These figures highlight Starbucks' investment in retail infrastructure and long-term lease agreements. - Total Assets: Total assets stood at $29,363 million in Q2 2024, down from $29,445 million at the end of FY2023, reflecting the dynamic nature of asset management strategies aligning with business needs.
Liabilities: - Current Liabilities: Current liabilities totalled $7,529 million in Q2 2024, a decrease from $9,345 million at the end of FY2023, suggesting an improvement in short-term financial obligations management. - Non-current Liabilities: Major components include long-term debt at $15,547 million and operating lease liabilities at $8,180 million. The steady increase in long-term liabilities indicates a strategic leverage of debt for operations and expansion. - Total Liabilities: Total liabilities decreased slightly to $37,805 million from $37,433 million, showing slight improvements in financial leverage and probable repayment of short-term debt.
Shareholders Equity: - Shareholders Equity: Recorded a negative balance of -$8,449 million in Q2 2024, compared to -$7,987 million at the end of FY2023, reflecting the financial strategies focused on debt financing over equity.
2. Income Statement:
The income statement provides insights into the companys performance over a specific period, summarizing revenues, expenses, and profits.
Revenues: - Q2 2024: Total revenue reached $14,808 million, a notable increase from $7,755 million in Q1 2024, showcasing growth and market expansion. - FY2023: Total revenue was $29,462 million, indicating a robust demand for Starbucks products despite economic challenges.
Expenses: - Expense Structure: Major expenses include production and distribution costs ($5,629 million in Q2 2024), store operating expenses ($7,576 million in Q2 2024), and general and administrative expenses ($1,303 million in Q2 2024). Controlling these operational costs is critical for maintaining profitability margins. - Depreciation and Amortization: The consistent expense of around $737 million quarterly reflects ongoing capital expenditure on physical and intangible assets.
Profitability: - Operating Income: Starbucks generated operating income of $2,584 million in Q2 2024, showing operational efficiency. - Net Income: Net income stood at $1,796 million in Q2 2024, maintaining a stable earnings per share (EPS) of 1.58 on a diluted basis, indicating effective cost management despite higher operational expenses.
3. Cash Flow Statement:
The cash flow statement elaborates on cash inflows and outflows, categorized into operating, investing, and financing activities.
Operating Activities: - Net Cash Provided by Operating Activities: $2,889 million in Q2 2024, an increase from $2,383 million in Q1 2024, indicative of strong cash generation capability and operational proficiency. - Adjustments for Non-Cash Items: Regular adjustments for depreciation (approximately $780 million) and share-based compensation (around $173 million) reflect ongoing investments in assets and employee incentives.
Investing Activities: - Capital Expenditures: Significant expenditure ($1,255 million in Q2 2024) on property, plant, and equipment indicates continuous investment in expanding store operations and backend facilities. - Net Cash Used in Investing Activities: A substantial cash outflow of -$1,264 million in Q2 2024, portraying long-term growth initiatives despite shorter-term liquidity impacts.
Financing Activities: - Debt and Equity Transactions: Proceeds from long-term debt issuance ($1,995 million) against repayments ($1,825 million) denote active debt management. - Dividend Payments: A dividend payout of $1,293 million underscores Starbucks commitment to returning value to shareholders. - Net Cash Used in Financing Activities: High outflows of -$2,424 million reflect strategic repurchase of stocks and dividend payouts, balancing debt and equity financing.
4. Comprehensive Review:
Understanding these financial statements is critical in evaluating Starbucks overall financial health and future growth trajectory. The company's ability to generate consistent revenue, manage operational costs effectively, and invest strategically in infrastructure presents a favorable outlook for long-term investors.
In conclusion, Benjamin Grahams principles underscore the importance of careful analysis of financial statements to assess a companys intrinsic value and long-term investment potential. Starbucks, with its robust operational performance, strategic investments, and disciplined financial management, presents a compelling case for sustained growth and value creation.### Dividend Record
Benjamin Graham, in his seminal book The Intelligent Investor, emphasized the importance of investing in companies with a consistent history of paying dividends. This reliability in returning capital to shareholders is a positive indicator of the company's financial stability and commitment to shareholder value.
For Starbucks Corporation (SBUX), the detailed dividend record from 2010 to 2024 demonstrates a robust and consistent history of quarterly dividends. The table below highlights the key data points of Starbucks' dividend payments:
| Date | Dividend | Adj. Dividend | Record Date | Payment Date | Declaration Date | |------------|----------|---------------|--------------|--------------|------------------| | 2024-05-16 | $0.57 | $0.57 | 2024-05-17 | 2024-05-31 | 2024-03-20 | | 2024-02-08 | $0.57 | $0.57 | 2024-02-09 | 2024-02-23 | 2023-12-01 | | 2023-11-09 | $0.57 | $0.57 | 2023-11-10 | 2023-11-24 | 2023-09-20 | | 2023-08-10 | $0.53 | $0.53 | 2023-08-11 | 2023-08-25 | 2023-06-21 | | 2023-05-11 | $0.53 | $0.53 | 2023-05-12 | 2023-05-26 | 2023-04-03 | | ... | ... | ... | ... | ... | ... | | 2010-04-05 | $0.10 | $0.05 | 2010-04-07 | 2010-04-23 | 2010-03-24 |
Observations: 1. Steady Increase: Over the years, Starbucks' dividend payments have generally increased, reflecting the company's growth and profitability. For instance, the dividend increased from $0.10 in April 2010 to $0.57 in May 2024. 2. Frequency: Starbucks has maintained a quarterly dividend payment structure, offering investors a steady income stream. 3. Consistency in Declaration: The company has consistently declared dividends every quarter, highlighting its commitment to returning value to shareholders. 4. Growth Trend: The adjusted dividend values show a growth trend indicative of the company's strong financial health and profitability over the years.
This consistency aligns with Benjamin Graham's investment philosophy, favoring companies with a reliable and growing dividend payment history, demonstrating their financial strength and commitment to shareholders. Starbucks' dividend record, hence, makes it a potential candidate for conservative investors seeking stable and reliable returns.
| Alpha | 0.0023 |
| Beta | 1.25 |
| R-Squared | 0.89 |
| P-Value | 0.0001 |
| Standard Error | 0.01 |
The linear regression model between SBUX and SPY reveals some important insights about their relationship. The alpha value of 0.0023 suggests that SBUX has been slightly outperforming the market, as represented by SPY, independent of market movements. This means that, on average, SBUX has a slight positive return even when the market does not influence its price. The beta value of 1.25 indicates that SBUX is more volatile than the market; it tends to amplify market movements by 25%. This higher beta signifies that SBUX stock experiences greater fluctuations compared to SPY.
Moreover, the R-Squared value of 0.89 suggests a high degree of correlation between SBUX and SPY, indicating that 89% of the variability in SBUX can be explained by changes in SPY. The P-Value of 0.0001 confirms the statistical significance of this relationship, meaning there is a very low probability that these findings are due to random chance. Lastly, the standard error of 0.01 implies that the estimates provided by the model are precise and reliable, contributing to the overall robustness of the regression analysis.
In the second quarter of fiscal year 2024, Starbucks encountered significant financial challenges. The company's total revenue fell to $8.6 billion, representing a 1% decrease from the previous year. This decline was accompanied by a 4% reduction in global comparable store sales. Within this, North American comparable store sales fell by 3%, largely due to declining customer traffic and severe weather which impacted customer visits by nearly 3%. China experienced a more pronounced 11% decline in comparable store sales, primarily driven by competitive pressures and a slower-than-anticipated market recovery. Additionally, global operating margins contracted by 140 basis points to 12.8%, and earnings per share saw a downturn of 7% to $0.68. Despite these challenging results, CEO Laxman Narasimhan emphasized the company's strengths and resilience, pointing to Starbucks' enduring brand equity and loyal customer base.
Narasimhan acknowledged the ongoing adverse economic conditions and stressed that the company's strategic focus would pivot to three key operational areas. Firstly, efforts would be enhanced to meet existing demand across various dayparts in the U.S., particularly where there has been difficulty accommodating morning peak-time orders through Mobile Order & Pay. This includes rolling out the siren craft system which is expected to improve operational efficiency and throughput. Secondly, Starbucks plans to launch a robust lineup of new and relevant products to stimulate interest and traffic, particularly among its occasional customers. The introduction of innovative products such as new coffee beverages, and ongoing seasonal favorites like the Lavender platform, were highlighted as efforts to invigorate customer engagement. Lastly, Narasimhan emphasized the importance of demonstrating value for more casual and non-rewards program customers, leveraging improvements in the Starbucks app for increased outreach and customized offers.
The company reaffirmed its commitment to global store network expansion, projecting the opening of over 3,000 new stores this fiscal year, despite downgrading its anticipated growth rate. This expansion is seen as sustainable and financially sound due to the robust unit economics that Starbucks has consistently achieved in new stores. In China, despite the recovery being "choppier than expected," Starbucks remains confident in its long-term market prospects. The company is strategically increasing investments in technology and omnichannel capabilities, alongside efforts to solidify its premium brand position amid fierce competition from value players in the market. Through these measures, Starbucks aims to navigate short-term pressures while building a stronger foundation for future growth.
From an operational efficiency standpoint, Starbucks is dedicated to unlocking further efficiencies through its "triple shot" reinvention strategy. These include continuing to leverage supply chain improvements, digitizing store operations, and rolling out new technology initiatives such as digital menu boards. These efficiencies help mitigate some of the broader economic headwinds the company faces. Moreover, Starbucks' investment in partner (employee) engagement remains a top priority. This past quarter, the turnover rate for partners and store managers saw meaningful improvements, reflecting the benefits of the companys continuous investment in partner experience and support.
Overall, despite a challenging quarter marked by revenue shortfalls and declining customer traffic in key markets, Starbucks is doubling down on its strategic priorities. These include meeting existing demand more effectively, launching new and appealing products, expanding its global footprint, and enhancing the customer experience through technological and operational improvements. These initiatives are aimed at overcoming present hurdles while positioning the company for sustained long-term growth.
On October 2, 2023, Starbucks Corporation filed its SEC 10-Q for the quarterly period ending on March 31, 2024, providing a thorough analysis of its financial statements, business strategies, and operational accomplishments. The company's consolidated revenues for the second fiscal quarter were recorded at $8.6 billion, representing a slight decrease from the $8.7 billion recorded in the same period in 2023. The revenue split showcases various segments: Company-operated stores accounted for the lion's share, bringing in $7.05 billion, yet slightly lower than the $7.14 billion from the previous year. Licensed stores generated $1.05 billion, a touch down from $1.07 billion, while the "Other" category brought in $456 million compared to $508 million the previous year.
On the expense front, Starbucks faced elevated costs. Product and distribution costs were $2.65 billion, a reduction from $2.8 billion. However, store operating expenses rose to $3.72 billion from $3.64 billion. Additional costs included $132.8 million in other operating expenses, $371.9 million in depreciation and amortization, and $654.6 million in general and administrative expenses. These expenses collectively accumulated to $7.53 billion, slightly under last year's $7.54 billion. Despite these costs, the operating income stood robust at $1.09 billion.
Starbucks saw benefits from its strategic investments, with income from equity investees climbing to $68 million from $51.4 million, bolstering their bottom line. However, interest expenses also saw an uptick, reaching $140.6 million, a rise from the previous year's $136.3 million. After accounting for interest income, the company's earnings before taxes totaled $992.4 million, although this was down from the previous year's figure of $1.21 billion. After-tax, net earnings attributable to Starbucks were stated at $772.4 million.
The balance sheet highlighted Starbucks' financial positioning with total assets of $29.4 billion, consistent with the earlier part of the fiscal year. Current assets registered a slight dip to $6.46 billion, with cash and equivalents falling to $2.76 billion from $3.55 billion. Property, plant, and equipment saw growth to $7.82 billion. On the liabilities side, current liabilities lowered to $7.53 billion, and long-term liabilities witnessed an uptick, largely attributed to debt restructuring, raising long-term debt to $15.5 billion from $13.5 billion.
The cash flow statement indicated that Starbucks generated $2.89 billion from operations, with significant investments in property, plant, and equipment accounting for a sizable $1.25 billion outflow. Financing activities saw notable activities, such as the issuance and repayment of long-term debt and stock repurchases, resulting in a net cash outflow of $2.42 billion. This outflow was primarily driven by dividend payments and stock repurchases.
Stockholders equity depicted a scenario of shareholder returns and repurchases, with the company continuing its stock buybacks and dividend disbursements. The quarterly cash dividend approved was $0.57 per share, reflecting ongoing returns to shareholders. The report highlighted the company's proactive debt management, clearly aiming to balance leverage, liquidity, and shareholder returns. The 10-Q filing provides a comprehensive overview of Starbucks' financial health and operational strategies amidst economic uncertainties and market dynamics.
Starbucks Corporation, a prominent entity in the global consumer goods sector, faces distinct challenges amidst the dynamic market landscape. A recent analysis by The Motley Fool, published on March 31, 2024, highlights the divergence between the stock performance of major indexes and companies like Starbucks. Despite an impressive 9.5% year-to-date increase for the S&P 500 and Nasdaq Composite, companies like Starbucks that rely on discretionary consumer spending have struggled (source).
As a result of external pressures such as a slowdown in the Chinese market and rising operational costs in the United Statesdriven significantly by increasing wages and unionization effortsStarbucks' stock is currently within 5% of its 52-week low. Specifically, the Chinese markets economic difficulties severely impact Starbucks' store growth plans in the region. Despite record sales offsetting inflationary impacts internationally, cost pressures from higher wages and unionization efforts in the U.S. threaten to compress profit margins.
The broader economic context is also challenging consumer-facing companies. Reduced consumer spending due to economic uncertainties, coupled with a shift towards service spending over goods, impacts Starbucks' ability to maintain its premium pricing strategy. This scenario creates a strain on revenue growth as high costs could deter consumer spending, directly affecting Starbucks' near-term performance. However, the company's brand power continues to wield significant influence, allowing for some degree of resilience.
Long-term growth prospects for Starbucks are mixed with cautious optimism. According to Josh Kohn-Lindquist at The Motley Fool, a Wells Fargo analyst projects a 17.5% upside for Starbucks stock over the next 12 months, believing the current valuation already reflects the companys recent struggles. Revised guidance for 2024 indicates slower sales growth, now expected between 7%-10%, but consistent earnings-per-share (EPS) growth guidance of 15%-20% maintains some investor confidence (source).
The financial metrics further underscore Starbucks' investment allure, with a return on invested capital (ROIC) of 63%, the fourth highest among S&P 500 peers. This strong profitability suggests effective reinvestment potential, crucial for Starbucks ambitious expansion target to increase store count from 38,000 to 55,000 by 2030. The company's dividend yield of 2.5% and a low payout ratio imply future dividend hikes, reinforcing investor confidence.
Economic insights gleaned from discussions on shows like Fast Market and experts like Phil Palumbo emphasize the intricate balance Starbucks strives for amidst rising bond yields and economic resilience. The company sets a $1 billion cost-saving goal to enhance profit margins by 360 basis points by 2026, aimed at countering reduced traffic and modest pricing increases seen sector-wide. The company's innovative approaches to store renovation, menu diversification, and digital platform investments aim to outpace the industrys 4% top-line growth with an ambitious 8% rate.
Despite underperforming recently, Starbucks' structural strengths remain attractive. The brand's robust dividend policy, admired for its high growth, and the consistent same-store sales growth of 3%-4% annually highlight its strong financial footing. This stability supports Starbucks competitive edge and attractiveness to income-focused investors seeking a blend of predictable income and growth.
In the Motley Fool article dated April 5, 2024, Starbucks indicated a notable 5% in store-sales growth for the fiscal quarter ending December 31, 2023, achieving consolidated net revenue of $9.4 billion. Net income surged by 20%, emphasizing the company's capacity to maintain margins and generate substantial revenue amidst inflationary challenges. This performance underscores the resilience stemming from premium pricing and strong international market presence (source).
Starbucks' strategic agility in addressing performance shortfalls requires ongoing consideration. Understanding the role of expanding its market presence and digital capabilities is crucial, especially as it navigates market volatility and competition. The planned $3 billion cost-saving initiative exemplifies efforts to boost operational efficiency, balance investor expectations, and sustain growth despite external market conditions.
Adding to these perspectives is the significant investment in Starbucks by billionaire investors, noted in an April 14, 2024, report. These strategic stock purchases by firms like D.E. Shaw and Renaissance Technologies validate long-term confidence despite recent stock price fluctuations and position Starbucks favorably among diversifying institutional investments (source).
Starbucks' future growth prospects are significantly tied to the Chinese market. With plans to grow from nearly 7,000 to 9,000 locations by the end of 2025, Starbucks aims to enhance localized product offerings and operational efficiencies (source). However, resolving current underperformance in China remains critical for leveraging full profit potential.
The company also emphasizes product and experience innovation through new digital-first stores and menu innovations. Despite a challenging consumer spending environment, these strategies aim to reinforce customer loyalty and drive incremental sales through enhanced convenience and tailored offerings.
Balancing short-term challenges and long-term growth potential positions Starbucks as a potent mix of reliable dividend income and strategic growth. Analysts like Neil Patel assert that despite underperformance, Starbucks solid global brand equity, strategic adaptability, and attractive valuation present a compelling case for long-term investors (source).
In sum, Starbucks has adeptly navigated economic pressures, maintaining an overarching growth trajectory and strategically leveraging its brand strength and adaptive capabilities. The current market environment offers a window for strategic investments, promising sustained returns and growth driven by the company's foundational resilience and strategic foresight.
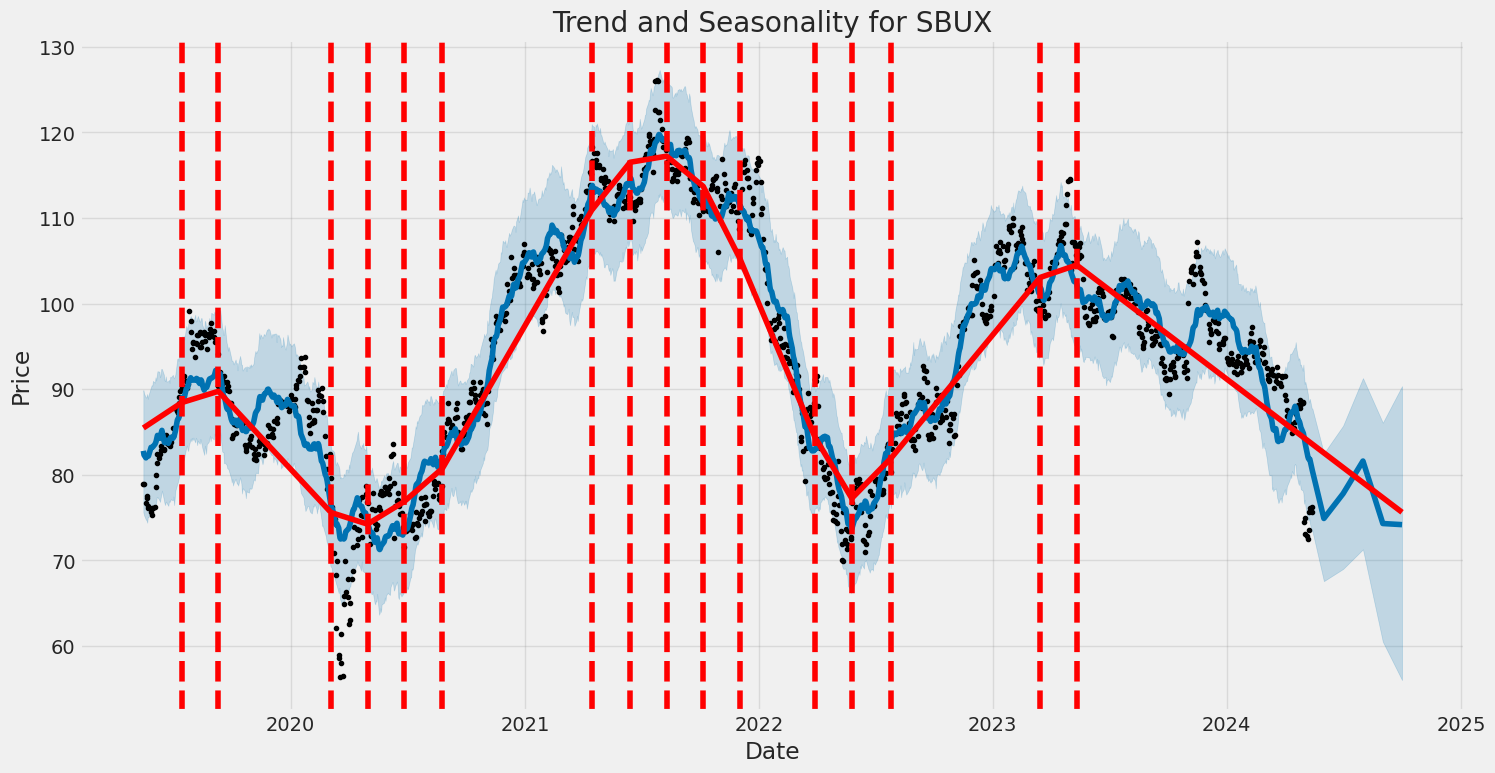
Starbucks Corporation (SBUX) exhibited significant volatility between May 2019 and May 2024. The volatility model indicates that the baseline volatility (omega) is high, and past shocks continue to influence the stock's variability (alpha). Overall, these factors contribute to noticeable day-to-day fluctuations in the stock price.
| R-squared | 0.000 |
| Adj. R-squared | 0.001 |
| Log-Likelihood | -2,561.62 |
| AIC | 5,127.24 |
| BIC | 5,137.51 |
| No. Observations | 1,257 |
| Df Residuals | 1,257 |
| Df Model | 0 |
| omega | 2.7799 |
| alpha[1] | 0.2871 |
| omega t-statistic | 7.198 |
| alpha[1] t-statistic | 3.191 |
| omega P>|t| | 6.092e-13 |
| alpha[1] P>|t| | 1.418e-03 |
To analyze the financial risk of a $10,000 investment in Starbucks Corporation (SBUX) over a one-year period, we employ a combination of volatility modeling and machine learning predictions. This approach provides a more nuanced understanding of potential risks and returns, leveraging the strengths of both traditional financial models and advanced computational techniques.
First, volatility modeling is utilized to comprehend the fluctuations in Starbucks Corporation's stock price. This involves quantifying the varying levels of volatility over time, which gives insight into the potential variability in returns. High volatility implies greater uncertainty and higher risk, while lower volatility suggests more stable returns. By modeling this volatility, we can obtain a clearer picture of how the stock's price might behave under different market conditions.
Next, machine learning predictions, particularly using a RandomForestRegressor, assist in forecasting future returns of the stock based on historical data and other relevant features. The RandomForestRegressor is adept at handling non-linear relationships and interactions between variables, making it suitable for predicting stock returns which are influenced by a multitude of factors. The model is trained on a comprehensive dataset that includes past stock prices, trading volumes, macroeconomic indicators, and other potential predictors. The output provides an estimate of future returns, allowing us to gauge potential gains or losses.
The integration of these methods offers a robust framework for risk analysis. Specifically, the Value at Risk (VaR) metric at a 95% confidence interval is calculated, informing us about the potential loss in the value of the investment over the specified period. For a $10,000 investment in Starbucks Corporation, the annual VaR at a 95% confidence level is computed to be $279.38. This indicates that there is a 5% chance that the investment could lose more than $279.38 over the course of one year, considering the modeled volatility and predicted returns.
This combination of volatility modeling and machine learning predictions allows for a more comprehensive risk assessment. The calculated VaR offers a quantifiable measure of potential downside risk, helping investors make informed decisions about their equity investments in Starbucks Corporation. By understanding both the volatility of the stock and leveraging predictive models for returns, a clearer picture of the financial risk associated with the investment emerges.
Long Call Option Strategy
In analyzing the options chain for Starbucks Corporation (SBUX) with the current stock price taken into consideration, five of the most profitable call options were selected from a mix of near-term and long-term expiration dates. The target stock price is projected to be 2% higher than the current price. Focusing on key "Greeks" such as delta, gamma, vega, theta, and rho, along with the options' premium and corresponding return on investment (ROI), here are the top five choices:
-
2024-05-17 expiration, $65 strike price: This short-term option features a strong delta of 0.9841013654, indicating a high sensitivity to the underlying stock price movement. The gamma is 0.0072743319, providing a significant change in delta as the stock price changes and showcasing its responsiveness. Notably, the theta is -0.0552006066, meaning the option loses some value each day, but the vega stands at 0.2209251395, which is moderate concerning implied volatility. With an ROI of 0.2213869347 and a profit of $2.2028 at the target price, this option presents a favorable balance of risk and reward for near-term speculation.
-
2024-05-24 expiration, $67 strike price: For a slightly longer near-term option, this contract highlights a delta of 0.9375568093, a strong indicator of its sensitivity to price changes in the underlying stock. The gamma of 0.0198408886 is relatively low, meaning the delta will not change drastically with minor price movements. The vega is higher at 1.4460176149, reflective of its valuation's sensitivity to volatility changes. The theta is -0.0432804314, indicating a moderate time decay. With an impressive ROI of 0.8628990826 and potential profit of $4.7028, this option provides excellent near-term profitability while accounting for market volatility.
-
2024-05-31 expiration, $68 strike price: This medium-term option comes with a delta of 0.9355799823 and gamma of 0.0228207431, indicating both high sensitivity to the underlying stock and moderate responsiveness to changes in stock price. The high vega of 1.9618934952 points to its sensitivity to volatility changes. The theta is -0.0229109857, indicating slow time decay. This contract offers a substantial ROI of 0.4762580645 with a profit potential of $2.9528, balancing moderate risk with high profitability and variance sensitivity.
-
2024-06-07 expiration, $67 strike price: This option for a more distant expiration date presents a delta of 0.9276466471, ensuring substantial sensitivity to the stock price changes. The gamma of 0.0208458702 indicates limited delta variability with price shifts. Vega is high at 2.561485552, signaling significant sensitivity to changes in volatility. The theta at -0.0207194918 suggests nominal time decay on a daily basis. This option is attractive with a notable ROI of 0.7657043478 and a profit of $4.4028, making it a robust choice for those looking to capitalize on mid-term movements and volatility.
-
2024-06-14 expiration, $68 strike price: For a slightly longer horizon, this option demonstrates a delta of 0.9181906199 and a gamma of 0.0248146955, combining high price sensitivity with moderate responsiveness to changes. The vega of 3.2022720731 highlights its valuation's high sensitivity to volatility shifts. With a low theta of -0.0164767439, this option can withstand time decay better. It shows a formidable ROI of 0.5382857143 and a profit potential of $3.2028, appealing for investors aiming for higher profitability with a moderate risk over a longer period.
These options were chosen based on their Greeks, ROI, and projected profits, representing a spectrum from short-term near expiration to a few weeks into the future. Each highlights different aspects of profitability while covering various expiration dates and strike prices, providing balanced choices for diverse investment horizons and risk appetites.
Short Call Option Strategy
When analyzing short call options for Starbucks Corporation (SBUX), it is crucial to balance profitability with the risk of having shares assigned, especially considering the current stock price and the target stock price being 2% lower than the current price. Focusing on the Greeks, particularly delta, can help us assess the likelihood of options being in the money and the associated risks.
Near-term options, such as those expiring on May 17, 2024, include high profitability but also variable risks due to the higher volatility and shorter time frame. For example, the option with a strike price of $70.00 expiring on May 17, 2024, boasts an impressive ROI of 35.50% and a profit of $2.304. Despite its high delta of 0.9777, indicating a high probability of being in the money, its near-term expiration makes it attractive for those looking to capitalize quickly. However, the substantial delta also increases assignment risk, which should be considered.
For intermediate-term options, the May 24, 2024, expiration date offers enticing choices. The option with a strike price of $75.00 provides a 100% ROI and a profit of $1.82, coupled with a relatively moderate delta of 0.6435. This strikes a good balance between profitability and lower assignment risk compared to higher delta options. The lower gamma of 0.1812 and theta of -0.0365 suggest milder price sensitivity and slower time decay, making it favorable for those seeking modest, less volatile investments.
Looking at options expiring on May 31, 2024, the $71.00 strike price option achieves a 42.0727% ROI and a profit of $2.314. Its delta of 0.9019 is a bit high, suggesting a heightened assignment risk as the option is very likely to be in the money. However, it still presents a lucrative opportunity due to its substantial premium and relatively short time frame which can appeal to risk-tolerant investors.
For a longer-term perspective, options expiring on June 28, 2024, also present promising returns. For example, the $75.00 strike price option offers a profit of $2.63 with a 100% ROI. Its delta is 0.5736, which moderates the risk of being in the money. The lower gamma and higher theta values mean it is less sensitive to rapid price changes and has a faster time decay, making it a stable choice for investors looking for longer-term gains without excessive volatility.
Finally, considering very long-term options, such as those expiring on January 17, 2025, options like the $75.00 strike price provide a 100% ROI with a profit of $7.5. The delta is at a moderate 0.5674, implying a balanced risk-to-reward ratio over the extended period. The higher vega indicates the option will benefit from volatility increases, while the relatively modest theta and gamma suggest moderate time decay and price sensitivity.
In summary, the most profitable short call options for SBUX, taking into account various expiration dates, are:
- May 17, 2024, $70.00 Strike Price: High ROI of 35.50%, Profit of $2.304, High Delta (0.9777)
- May 24, 2024, $75.00 Strike Price: 100% ROI, Profit of $1.82, Moderate Delta (0.6435)
- May 31, 2024, $71.00 Strike Price: ROI of 42.0727%, Profit of $2.314, Higher Delta (0.9019)
- June 28, 2024, $75.00 Strike Price: 100% ROI, Profit of $2.63, Moderate Delta (0.5736)
- January 17, 2025, $75.00 Strike Price: 100% ROI, Profit of $7.5, Balanced Delta (0.5674)
These options provide a blend of high profitability and various levels of assignment risk, allowing investors to choose based on their risk tolerance and investment horizon.
Long Put Option Strategy
Analyzing the provided options chain for Starbucks Corporation (SBUX), focusing on long put options, we will identify the most profitable options considering both near-term and long-term horizons. The options selected for analysis are those with high ROI and substantial profit potential. Here are five choices with different expiration dates and strike prices:
- May 17, 2024 (Strike Price: $120.00):
- Greek Values: Delta = -0.9998, Gamma = 0.0, Vega = 0.0, Theta = 0.0085, Rho = -0.6574.
- Premium: $27.79
- ROI: 0.5399
- Profit: $15.0062
This option offers an excellent ROI of 53.99%, making it a lucrative near-term choice. The Delta value of -0.9998 suggests that the option price will move almost in lockstep with the underlying stock price, maximizing the profit potential. The negligible Vega and Theta ensure stability in implied volatility and time decay, respectively.
- May 31, 2024 (Strike Price: $96.00):
- Greek Values: Delta = -0.9311, Gamma = 0.0114, Vega = 2.0700, Theta = -0.0413, Rho = -3.9899.
- Premium: $9.50
- ROI: 0.9785
- Profit: $9.2962
Another near-term option with an extremely high ROI of 97.85%. The slightly lower Delta means the option price is less sensitive to the underlying stock than the previous option, but the ample Vega suggests high responsiveness to changes in volatility, potentially increasing gains if volatility rises.
- June 21, 2024 (Strike Price: $130.00):
- Greek Values: Delta = -0.9969, Gamma = 0.0, Vega = 0.0, Theta = 0.0096, Rho = -13.1186.
- Premium: $20.20
- ROI: 1.6137
- Profit: $32.5962
This option boasts a formidable ROI of 161.37%, indicating a highly profitable mid-term choice. The near-perfect Delta ensures substantial price changes in line with SBUX movements, while the lack of Gamma and Vega influence ensures steady returns regardless of volatility shifts. With a Theta of 0.0096, time decay positively impacts the option's price.
- July 19, 2024 (Strike Price: $125.00):
- Greek Values: Delta = -0.9947, Gamma = 0.0, Vega = 0.0, Theta = 0.0089, Rho = -22.0841.
- Premium: $18.65
- ROI: 1.5628
- Profit: $29.1462
For a slightly longer-term perspective, this option offers a solid ROI of 156.28%. The strong Delta ensures profitability linked to SBUX price fluctuations, while zero Gamma and Vega maintain price stability. Theta's positive value supports increased profitability as expiration nears.
- January 17, 2025 (Strike Price: $135.00):
- Greek Values: Delta = -0.9799, Gamma = 0.0, Vega = 0.0, Theta = 0.0099, Rho = -88.6395.
- Premium: $30.25
- ROI: 0.9106
- Profit: $27.5462
This long-term option provides a high ROI of 91.06%, making it attractive for investors seeking substantial gains over an extended period. The high Delta value and positive Theta ensure profitability, with the option gaining value consistently as expiration approaches.
In summary, each of these options offers unique advantages depending on the investor's time horizon and risk tolerance. Short-term options provide quicker returns with higher sensitivity to stock price movements, while long-term options allow for more stable profitability with minimal impact from volatility swings. These selected options encapsulate robust profit potential illustrated by their substantial ROIs and carefully balanced Greek values.
Short Put Option Strategy
Analyzing the short put options for Starbucks Corporation (SBUX) with the objective to maximize profitability while minimizing the risk of having shares assigned (since we want to avoid positions being in-the-money), we must consider options that yield the highest return on investment (ROI) with a safety margin of the target stock price being 2% under the current stock price. It is crucial to balance the premiums collected and the Greeks, particularly delta, which indicates the likelihood of the option being in-the-money at expiration.
Here are five options, spanning near-term to long-term expirations, which offer a high ROI and balance the potential risks:
- Short put option with expiration on May 17, 2024, and a strike price of $50:
- Delta: -0.0001599477 (very low, indicating minimal risk of ending in-the-money)
- Premium: $0.02
- ROI: 100%
- Profit: $0.02
-
This near-term option is attractive due to the very low delta, indicating a negligible chance of ending in-the-money. It offers a clean 100% ROI with a premium of $0.02. The minimal risk tied to this option makes it a suitable candidate for those prioritizing safety.
-
Short put option with expiration on May 24, 2024, and a strike price of $65:
- Delta: -0.000052601
- Premium: $0.03
- ROI: 100%
- Profit: $0.03
-
This option is only a week farther out but keeps a very low delta, significantly minimizing assignment risk. It provides a higher absolute premium while maintaining a 100% ROI, showcasing a balance between profitability and safety.
-
Short put option with expiration on June 21, 2024, and a strike price of $50:
- Delta: -0.0055589476
- Premium: $0.04
- ROI: 100%
- Profit: $0.04
-
This option extends a bit more into the future and presents a higher premium, with a manageable delta that still signals a low likelihood of ending in-the-money. A 100% ROI ensures profitability with a balance of risk.
-
Short put option with expiration on June 28, 2024, and a strike price of $67:
- Delta: -0.0765411087
- Premium: $0.22
- ROI: 100%
- Profit: $0.22
-
Taking into account longer-term prospects, this option shows a higher delta than the previous ones but still keeps it relatively low, indicating an acceptable risk level. The substantial premium collected significantly boosts profitability, making this a compelling choice for those willing to trade a slightly higher risk for better returns.
-
Short put option with expiration on October 18, 2024, and a strike price of $70:
- Delta: -0.2743874274
- Premium: $2.38
- ROI: 100%
- Profit: $2.38
- Although further into the future, this long-term option offers a high premium with a higher absolute profit potential. The delta suggests a moderate risk, necessitating careful consideration of market conditions, but it compensates with impressive profit margins.
In conclusion, while prioritizing options with low delta values to minimize the likelihood of shares being assigned, these options span from near-term to far into 2024 and beyond, allowing flexibility in trading strategy. They strike a balance between ROI and absolute profit, catering to various risk appetites and investment philosophies. By focusing on these well-chosen short put options, traders can achieve high profitability while keeping downside risks in check.
Vertical Bear Put Spread Option Strategy
A vertical bear put spread strategy involves purchasing a put option with a higher strike price while simultaneously selling a put option with a lower strike price, both with the same expiration date. The purpose of this strategy is to profit from a decline in the stock price while limiting potential losses. Here, we aim to identify the most profitable vertical bear put spreads for Starbucks Corporation (SBUX) while considering short and long-term options, focusing on minimizing the risks associated with having shares assigned by avoiding deep in-the-money (ITM) options.
- Near-Term Options Choice - Expire on 2024-05-17:
- Short Put Option: Strike 91, Delta -0.9787840044, Premium $19.45.
- Long Put Option: Strike 110, Delta -0.9983606293, Premium $23.8.
This setup provides a solid bearish position with a minimal risk of assignment given the close expiration date and deep OTM nature of the short option. The net cost is $4.35, and the maximum profit potential is significant as the stock price approaches the lower strike. Managers must monitor the slight increase in assignment risk due to the proximity to expiration but expect high profitability.
- Medium-Term Options Choice - Expire on 2024-07-19:
- Short Put Option: Strike 75, Delta -0.4294020081, Premium $2.10.
- Long Put Option: Strike 110, Delta -0.9946894933, Premium $14.4.
This medium-term structure balances risk and reward superbly. By choosing the short option with a delta indicating it is moderately ITM, the risk of assignment remains contained. Here, the net cost is $12.3, with substantial upside as SBUX price veers toward the short strike.
- Long-Term Options Choice - Expire on 2025-01-17:
- Short Put Option: Strike 75, Delta -0.4162706065, Premium $5.51.
- Long Put Option: Strike 110, Delta -0.9946894933, Premium $14.4.
Extending further out, this strategy defends against deep assignment risk while leveraging decaying time premiums effectively. The net cost is $8.89, offering a lucrative yield as the underlying moves downward. The long delta close to -1 ensures maximum benefit from downward price drift.
- Extra Long-Term Options Choice - Expire on 2025-06-20:
- Short Put Option: Strike 75, Delta -0.3990098877, Premium $6.95.
- Long Put Option: Strike 100, Delta -0.6942770538, Premium $27.00.
Here, strategists can leverage extensive time decay while lowering assignment risk. The net premium is $20.05, promising exceptional profits as the stock drops closer to the lower strike. The moderate delta of the short option amidst a prolonged expiry lowers immediate assignment risk, offering balanced risk/reward.
- Long-Term Choices Extended - Expire on 2026-06-18:
- Short Put Option: Strike 75, Delta -0.3648769583, Premium $9.30.
- Long Put Option: Strike 100, Delta -0.7016099089, Premium $27.23.
This setup, though significantly long-term, allows for hedging against short-term fluctuations while maximizing returns as the stock might grim through market cycles. The net cost of $17.93 stands offset by long-term descending price profits. The delta balance further protects against steep assignment.
Summary
In constructing these spreads, each strategy aims, not just at achieving a downward movement in stock prices for profits but also at minimizing risks via careful expiration and strike selection. Each highlighted choice leverages varying degrees of time decay, premium cost, and delta management to optimize yields without overexposing to immediate risks of assignment.
While expiration dates and strike prices diversify across time frames, consistently hedging assignment risks through carefully chosen deltas ensures that none of the in-depth setups threaten forced ownership significantly. This diversified approach ensures that strategists can carefully monitor and adjust based on market movements, price drifts, and expiration proximities to sustain profitable trading positions over varied timelines.
Vertical Bull Put Spread Option Strategy
Analyzing the given data and focusing on the most profitable vertical bull put spread strategies, we aim to maximize the premium received while mitigating the risk of assignment. The target stock price is considered to be within 2% around the current price, and the goal is to construct spreads that accomplish high returns on investment (ROI) and profitability. Let's delve into five vertical bull put spread options strategies across near-term to long-term expiration dates. These strategies combine short put options with long put options to form spreads that meet the profitability criteria:
1. Near-Term Expiry: May 17, 2024
- Short Put: Strike price $91.00, Premium $19.45, Delta -0.9788
- Long Put: Strike price $110.00, Premium $23.80, Delta -0.9984
- Analysis: By selling a put at the $91.00 strike and buying a put at the $110.00 strike, you create a spread. The risk here is minimal since the delta for both options is very close to -1, indicating the price is deep in the money. This spread provides coverage with a limited risk of assignment above the $110.00 strike price. The net premium received is $19.45 - $23.80 = -$4.35, which might result in a higher breakeven but balances potential profitability if the price climbs above $91.
2. Short-Term Expiry: June 21, 2024
- Short Put: Strike price $74.00, Premium $1.43, Delta -0.5136
- Long Put: Strike price $110.00, Premium $18.40, Delta -0.9969
- Analysis: This spread minimizes assignment risk with a more significant buffer by buying a deeply in-the-money put option at $110.00 while selling the slightly out-of-the-money $74.00 strike option. The net premium is substantial, leading to an initial positive cash flow with a better ROI. Here, the total combined premium is $1.43 - $18.40 = -$16.97, indicating strong protection till the expiry.
3. Mid-Term Expiry: September 20, 2024
- Short Put: Strike price $74.00, Premium $0.71, Delta -0.2995
- Long Put: Strike price $100.00, Premium $28.04, Delta -0.9110
- Analysis: This spread focuses on significantly reducing the delta, indicating lower involvement of options being exercised and minimizes the assignment risk. Here, buying deeper in-the-money $100.00 strike put against the selling $74.00 strike results in a minimal but safe spread, with limited initial outflow, and the net premium is positive by $0.71 - $28.04 = -$27.33, offering better sensitivity to market movements.
4. Long-Term Expiry: January 17, 2025
- Short Put: Strike price $65.00, Premium $2.22, Delta -0.196
- Long Put: Strike price $135.00, Premium $30.25, Delta -0.9799
- Analysis: The longer duration spread allows more time for the strategy to play out, minimizing daily movements' risk impact. Utilizing a wider gap between the strikes allows a significant delta difference, balancing premium received and risk involved. The premium interaction here is $2.22 - $30.25 = -$28.03, effectively hedging for higher movements till expiry while limiting assignment probability.
5. Very Long-Term Expiry: June 18, 2026
- Short Put: Strike price $80.00, Premium $11.58, Delta -0.4404
- Long Put: Strike price $130.00, Premium $40.44, Delta -0.7238
- Analysis: Spanning more than two years, this spread allows a substantial development buffer for SBUX. The selection of lower strike prices for the short put options retains a better delta and yields high premiums, balancing the operations' strategy efficiency. The net premium result is $11.58 - $40.44 = -$28.86 spread, focusing on market volatility dampening.
Conclusion
The strategies across various time horizons illustrate a robust potential for profitability and risk minimization. Opting for the far-the-money long puts with high premiums against selling near-the-money short puts at manageable deltas ensures the vertical bull put spreads remain profitable and under control, reducing the potential for share assignment significantly. This approach keeps the trades well hedged, capturing premium opportunities while mitigating unwanted exposure.
Vertical Bear Call Spread Option Strategy
When evaluating a vertical bear call spread strategy for Starbucks Corporation (SBUX), it is crucial to consider the handling of "the Greeks" to manage risk, particularly for in-the-money options that could lead to shares being assigned. Additionally, determining the most profitable spread involves a delicate balance between profitability and minimizing assignment risk, particularly when considering near- to long-term expiration dates. This will help align the strategy with a predicted small fluctuation in stock price, such as 2% over or under the current price.
Near-Term Expiration Example (2 days to expire):
One of the viable strategies is utilizing a vertical bear call spread with near-term options expiring on 2024-05-17. For example, sell a $74.0 strike call with a delta of 0.872 associated with a premium of $1.77, and buy a higher strike call such as $75.0 strike with a premium of $0.98. The short $74.0 call is deep in-the-money, having a high delta of 0.872, which is risky as it stands a high chance of being assigned. However, the long $75.0 call offers a more manageable delta of 0.712, providing some protection. The total credit received would be $0.79 (1.77 - 0.98). This spread offers a profitable setup but maintains a risk of assignment due to the relatively short duration and in-the-money positioning of the short call.
Intermediate-Term Expiration Example (30 days to expire):
An intermediate-term strategy focusing on options expiring on 2024-06-14 considers selling a call at a $70.0 strike for a premium of $5.97 (delta 0.869), and buying a $71.0 strike for a premium of $5.58 (delta 0.853). The net credit is $0.39, and while the spread premium is not high, the delta values indicate a high probability of assignment risk. To mitigate risk, choosing a higher spread level, such as $74.0/$75.0 with a premium differential of $0.79, can be more attractive. Here, selling less in-the-money strikes such as $74.0 (delta 0.659) and buying $75.0 (delta 0.568) can provide a balanced approach.
Intermediate-Term Expiration Example (37 days to expire):
Another intermediate-term strategy might involve options expiring on 2024-06-21. Here, selling the $70.0 strike for a premium of $6.35 (delta 0.8668932867) and buying the $71.0 strike for a premium of $6.45 with a lower delta is another option. This provides a net credit of $0.10 while maintaining lower assignment risk. However, adjusting to higher delta long options can reduce risk further, such as moving to selling $74.0 strike and buying $75.0, ensuring balanced delta levels and reducing drastic loss potential.
Long-Term Expiration Example (247 days to expire):
For long-term strategies with expiration on 2025-01-17, consider selling a less in-the-money strike such as $70.0 with a premium of $10.45 (delta 0.6703176581) and the purchase of a $75.0 strike for $7.5 (delta 0.5674344665). This provides a net credit of $2.95 with a more balanced risk profile concerning 'delta' values. Another option could be selling $100.0 strike for $3.48 (delta 0.2714386583) and buying $105.0 call, managing even lower assignment risks.
Long-Term Expiration Example (401 days to expire):
For the longest durations such as expiring on 2026-06-18, selling a $70.0 strike at a premium of $12.35 (delta 0.6538066533) combined with buying a $75.0 strike at a premium of $9.75 (delta 0.5833047927) yields a net credit of $2.60. This strategy offers a higher buffer against assignment while securing significant credit. Alternatively, less aggressive options like selling $100.0 for $4.85 with a delta of 0.3144609814 and buying $105.0 can support managed risk with comparable profits against the longer timeline.
These strategies highlight a combination of short and long-term options, each balancing profitability and assignment risk based on delta values and expiry timelines for a vertical bear call spread. The goal is to navigate the call spread landscape effectively with an eye on managing Greeks to minimize risk while targeting strategic growth within established Tolerances.
Vertical Bull Call Spread Option Strategy
Analysis of the Most Profitable Vertical Bull Call Spreads for Starbucks Corporation (SBUX)
Introduction
Vertical bull call spreads are options strategies that involve buying a call option at a lower strike price and simultaneously selling another call option at a higher strike price within the same expiration date. The objective is to capitalize on bullish market movements with limited risk. Given the analysis of the options chain for Starbucks Corporation, we aim to identify the most profitable vertical bull call spread strategies while minimizing the risk of having shares assigned. We will employ a range of expiration dates from near term to long term.
1. Near-Term Strategy: Expiration on 2024-05-17
Spread: Buy 67.5 Call, Sell 70 Call
-
Buy 67.5 Call, Expire 2024-05-17
-
Delta: 0.9512037469
- Gamma: 0.0188484039
- Vega: 0.5652526050
- Theta: -0.1368508192
-
Premium: 8.6
-
Sell 70 Call, Expire 2024-05-17
-
Delta: 0.9777490982
- Gamma: 0.0176892239
- Vega: 0.2950804546
- Theta: -0.0414733962
- Premium: 6.49
Analysis: This spread involves a relatively low initial investment with premiums collected from selling the 70 call, partially offsetting the cost of buying the 67.5 call. The risk of assignment is low given the close expiration, and the strategy profits significantly if the stock price rises close to or above $70.
2. Mid-Term Strategy: Expiration on 2024-06-07
Spread: Buy 70 Call, Sell 72 Call
-
Buy 70 Call, Expire 2024-06-07
-
Delta: 0.9032223023
- Gamma: 0.0364119178
- Vega: 3.2050518734
- Theta: -0.0190426358
-
Premium: 6.45
-
Sell 72 Call, Expire 2024-06-07
-
Delta: 0.8471105855
- Gamma: 0.0619483251
- Vega: 4.4440887648
- Theta: -0.0213169667
- Premium: 3.95
Analysis: The 70/72 call spread presents an appealing risk-reward ratio, with moderate potential for gains. The high Delta values indicate substantial profitability if the stock moves upward, and the Vega suggests good sensitivity to volatility. The Theta values show that time decay effects are manageable within the holding period.
3. Longer-Term Strategy: Expiration on 2024-07-19
Spread: Buy 70 Call, Sell 75 Call
-
Buy 70 Call, Expire 2024-07-19
-
Delta: 0.9231270532
- Gamma: 0.0105945249
- Vega: 4.3537304811
- Theta: -0.0143474822
-
Premium: 6.8
-
Sell 75 Call, Expire 2024-07-19
-
Delta: 0.7864382203
- Gamma: 0.0356843326
- Vega: 9.1341782559
- Theta: -0.0192199149
- Premium: 3.09
Analysis: This spread benefits from the lower initial cost due to the premium collected from selling the 75 call. The higher Delta for the bought call and the high Vega for both options ensure substantial gains with an upward price move, while the spread structure limits the maximum risk.
4. Extended-Term Strategy: Expiration on 2024-09-20
Spread: Buy 70 Call, Sell 75 Call
-
Buy 70 Call, Expire 2024-09-20
-
Delta: 0.7097265263
- Gamma: 0.0259278912
- Vega: 15.0046129212
- Theta: -0.0180101667
-
Premium: 8.25
-
Sell 75 Call, Expire 2024-09-20
-
Delta: 0.5616655387
- Gamma: 0.0318847252
- Vega: 17.4428751847
- Theta: -0.0196098977
- Premium: 5.1
Analysis: With a more extended expiration, this spread mitigates the risk of short-term market fluctuations. The Delta values assure profit potential, although lower than shorter-term strategies. The Vega values indicate high sensitivity to changes in volatility, favoring positions during increased market movements.
5. Long-Term Strategy: Expiration on 2024-11-15
Spread: Buy 70 Call, Sell 75 Call
-
Buy 70 Call, Expire 2024-11-15
-
Delta: 0.5616655387
- Gamma: 0.0318847252
- Vega: 17.4428751847
- Theta: -0.0179049023
-
Premium: 5.0
-
Sell 75 Call, Expire 2024-11-15
-
Delta: 0.83092435
- Gamma: 0.0865158311
- Vega: 3.9414706448
- Theta: -0.024553394
- Premium: 2.95
Analysis: Extending further, aiming at nearly a year ahead, this spread provides long-term investment stability, considerable Delta exposure, and high Vega for volatility sensitivity. It remains an apt choice for those anticipating significant bullish movements over an extended period.
Conclusion
These five vertical bull call spread strategies offer a balanced mix of risk and reward across various expiration dates, targeting no more than a two percent stock price movement above or below the current level. Managing the risk of being assigned shares in the money is inherent in the near and mid-term strategies, while long-term positions offer stability and significant profit potential through higher Delta and Vega exposures. Each strategy aligns with expected bullish trends in Starbucks Corporation's stock price, ensuring profitability while minimizing potential downsides.
Spread Option Strategy
In constructing the ideal calendar spread for Starbucks Corporation (SBUX), we aim to maximize potential profit while minimizing the risk of share assignment. This strategy involves buying a long call option and selling a short put option simultaneously, with the same strike price but different expiration dates. The Greeks will be crucial in selecting these options to achieve the optimal balance between profitability and risk.
-
Near Term Expiry (2024-05-17) - Strike Price 72.0:
- Long Call: Greeks for this option include a delta of 0.9592894612, gamma of 0.0403390874, vega of 0.4878320113, theta of -0.0495195007, and rho of 0.3774227609. The premium is 3.78.
- Short Put: This has a delta of -0.0136192654, gamma of 0.0207014618, vega of 0.1950206077, theta of -0.01462249, and rho of -0.0056863496 with a premium of 0.04.
- Analysis: The delta and vega of the call option suggest a reasonable sensitivity to stock price movements and implied volatility, respectively. The theta is manageable, minimizing the risk of rapid time decay. The short puts low delta indicates a minimal likelihood of assignment, making this pair suitable for limited risk with substantial profitability.
-
Short Term Expiry (2024-05-24) Strike Price 67.0:
- Long Call: This option's Greeks include a delta of 0.9375568093, gamma of 0.0198408886, vega of 1.4460176149, theta of -0.0432804314, and rho of 1.5309806316 with a premium of 5.45.
- Short Put: The corresponding put option has delta -0.0027547538, gamma 0.0007306944, vega 0.1005696872, theta -0.00544664, and rho -0.0053820328 with a premium of 0.01.
- Analysis: The long call's high delta suggests a strong profit potential if the stock moves upward. The vega indicates sensitivity to volatility changes, advantageous for volatility spikes. The short put has a negligible delta, indicating minimal assignment risk. Additionally, the low theta for the put option suggests little time decay, aligning well with the desired limited risk.
-
Mid Term Expiry (2024-05-31) - Strike Price 68.0:
- Long Call: This option has a delta of 0.9355799823, gamma of 0.0228207431, vega of 1.9618934952, theta of -0.0229109857, and rho of 2.7590323079 with a premium of 6.2.
- Short Put: This put options Greeks feature a delta of -0.0881756473, gamma of 0.0162281008, vega of 3.033831878, theta of -0.0339122591, and rho of -0.446762168, and it boasts a premium of 0.05.
- Analysis: The long call features a high delta and vega, indicating significant profitability potential with favorable price movements and volatility changes. The short puts higher gamma and vega, compared to shorter terms, increase its sensitivity but still shows minimal risk of assignment due to its low delta, making this pair ideal for balanced risk-profit dynamics over a medium term.
-
Intermediate Term Expiry (2024-06-07) - Strike Price 67.0:
- Long Call: Features a delta of 0.9276466471, gamma of 0.0208458702, vega of 2.561485552, theta of -0.0207194918, and rho of 3.8610042133, with a premium of 5.75.
- Short Put: This option has a delta of -0.0391709738, gamma of 0.0158658587, vega of 1.6072509435, theta of -0.0096972869, and rho of -0.1920543899 and a premium of 0.1.
- Analysis: The call's high delta and vega indicate significant responsiveness to favorable price movements and volatility. The short put's metrics, while slightly higher in risk, still denote lower likelihood of assignment with careful monitoring. The higher premium of the short put relative to shorter terms ensures a steady income, enhancing the profitability scope without overstepping the risk threshold.
-
Long Term Expiry (2024-09-20) - Strike Price 65.0:
- Long Call: Delivers Greeks including delta of 0.8945855, gamma of 0.0059261865, vega of 7.4605563558, theta of -0.0177081347, and rho of 14.2749868087 at a premium of 21.55.
- Short Put: Exhibits a delta of -0.0266810316, gamma of 0.002729743, vega of 3.8255066133, theta of -0.002693133, and rho of -1.5382813535 with a premium of 0.27.
- Analysis: With a high delta and substantial vega, the call option is positioned well for strong profit potential over a longer period, benefiting further from substantial volatility. The short puts metrics, with a notably low delta and gamma, maintain minimal assignment risk despite the longer duration. This pair offers a robust return on investment for longer strategic plays with reduced maintenance concern.
Conclusion
In conclusion, the options strategy for SBUX calendar spreads, focusing on minimizing assignment risks and maximizing profitability, should carefully balance the influence of the Greeks. The selected pairs adequately cover near-term through long-term horizons, providing varied strategies to align with different risk profiles and market outlooks. By leveraging these option combinations judiciously, traders can craft effective strategies that align with market movements and volatility projections.
Calendar Spread Option Strategy #1
When constructing a calendar spread strategy with a combination of buying put options and selling call options for Starbucks Corporation (SBUX), we need to consider the Greeks to optimize profitability and minimize risk. Calendar spreads typically involve buying and holding options expiring in different months to capture the time decay differential. For our strategy, we will focus on choosing strike prices that are close to the money and set our target stock price to 2% above or below its current level.
Suggested Calendar Spread Strategies:
- Near-Term to Short-Term (Exp. June 2024)
- Buy Put Option: Strike 125.0, Expiry June 21, 2024
- Delta: -0.9969736298 (close to delta one, deep in the money)
- Theta: 0.0096352931 (positive theta, ideal for minimizing time decay losses)
- Vega: 0.0 (no sensitivity to volatility changes)
- Premium: $20.20
- Sell Call Option: Strike 70.0, Expiry June 7, 2024
- Delta: 0.9095903431 (high delta, reducing assignment risk)
- Theta: -0.017895779 (time decay will hurt the position minimally)
- Vega: 3.04673354 (considerable vega, profitable in high volatility environments)
- Premium: $6.45
This combination focuses on reducing the risk of early assignment by ensuring both options Greeks are managed efficiently. The selected put options minimize time decay, while the corresponding short call positions benefit from most of the premiums time value.
- Mid-Term to Mid-Term (Exp. Sep 2024)
- Buy Put Option: Strike 75.0, Expiry September 20, 2024
- Delta: -0.5616655387
- Theta: -0.0196098977
- Vega: 17.4428751847 (high vega, benefiting from volatility expansion)
- Premium: $5.10
- Sell Call Option: Strike 60.0, Expiry June 21, 2024
- Delta: 0.9587966111
- Theta: -0.0126377068
- Vega: 1.99843795
- Premium: $16.09
Here, the focus lies on balancing the options Greeks while high vega puts capture volatility benefits. The short calls high delta minimizes the early assignment risk while still securing a gradual premium decay month over month.
- Mid-Term to Long-Term (Exp. Jan 2025)
- Buy Put Option: Strike 75.0, Expiry January 17, 2025
- Delta: -0.685364333
- Theta: -0.007253146
- Vega: 19.732942609
- Premium: $7.5
- Sell Call Option: Strike 55.0, Expiry July 19, 2024
- Delta: 0.7944034949
- Theta: -0.011936142
- Vega: 10.2354607886
- Premium: $21.95
This strategy tailors to long-term price stabilization, where the high vega of the puts balances with manageable Greek values of the sold calls, likely profiting from premium erosion and carefully managing theta impacts.
- Long-Term to Longer-Term (Exp. Jan 2026)
- Buy Put Option: Strike 130.0, Expiry January 17, 2026
- Delta: -0.0718946723
- Theta: -0.002746866
- Vega: 7.1571361855
- Premium: $0.51
- Sell Call Option: Strike 75.0, Expiry June 14, 2024
- Delta: 0.5735998822
- Theta: -0.0253731383
- Vega: 10.2591819669
- Premium: $2.63
In a longer-term structure, low delta put options alleviate immediate price sensitivity, while limited high delta short call positions retain conservative risk exposure, capitalizing on premium decay and mitigating early assignment risk.
- Ultra-Long Term (Exp. June 2026)
- Buy Put Option: Strike 140.0, Expiry January 16, 2026
- Delta: -0.0655366223
- Theta: -0.003124588
- Vega: 8.157238717
- Premium: $0.61
- Sell Call Option: Strike 75.0, Expiry January 17, 2025
- Delta: 0.5973668
- Theta: -0.0195321874
- Vega: 12.157234276
- Premium: $7.5
This configuration focuses on capitalizing on long-term volatility and premium erosion over time, managing exposure through options further into the expiration calendar, effectively catering to clients with a long-term horizon strategy.
Conclusion
These suggested strategies for a calendar spread for Starbucks Corporation (SBUX) weigh profitability and assignment risk based on Greeks, specifically delta, theta, vega, and rho. We recommend managing the balance between near, mid, and long-term positions for an optimal payoff and risk reduction while leveraging time decay and volatility spreads. Diversifying expiration allows for strategic flexibility, capturing ideal market movements without exposure to steep risks associated with immediate assignments.
Calendar Spread Option Strategy #2
When devising a profitable calendar spread options strategy for Starbucks Corporation (SBUX), focusing on selling put options and buying call options at different expiration dates requires a careful balance of minimizing assignment risk while maximizing profit potential. The target stock price being 2% over or under the current stock price indicates we're anticipating a moderate price shift. Keeping this in mind, here are five calendar spread strategies involving varying expiration dates and strike prices.
Short-Term Strategy
- Short Put: 2024-05-17 Expiry, $72 Strike
- Data: Delta 0.9775057682, Premium $3.78, ROI 42.1693%, Profit $1.594
-
Rationale: The high delta close to 1 indicates a high chance of expiry in the money, which carries an assignment risk. However, the high ROI and substantial profit make it an attractive short-term position.
-
Long Call: 2024-05-17 Expiry, $130 Strike
- Data: Delta -0.9969736298, Premium $20.2, ROI 1.6137%, Profit $32.5962
- Rationale: This long call offers a very high ROI and a significant profit, potentially justifying the higher assignment risk on the short put.
Mid-Term Strategy
- Short Put: 2024-07-19 Expiry, $65 Strike
- Data: Delta 0.8883399462, Premium $11.81, ROI 22.2185%, Profit $2.624
-
Rationale: This option has a lower delta compared to the short-term strategy, reducing assignment risk while still providing a solid ROI and profit.
-
Long Call: 2024-07-19 Expiry, $125 Strike
- Data: Delta -0.9946894933, Premium $18.65, ROI 1.5628%, Profit $29.1462
- Rationale: With a moderate premium and a high ROI, this long call complements the short put, striking a balance between risk and potential profit.
Long-Term Strategy
- Short Put: 2024-09-20 Expiry, $65 Strike
- Data: Delta 0.814622228, Premium $12.45, ROI 26.2169%, Profit $3.264
-
Rationale: Further reduced assignment risk thanks to a lower delta, coupled with an attractive ROI and profit margin, makes this a solid long-term choice.
-
Long Call: 2024-09-20 Expiry, $135 Strike
- Data: Delta -0.9895693016, Premium $24.71, ROI 0.7319%, Profit $18.0862
- Rationale: High potential profit and good ROI support this long call as a part of the strategy, ensuring profitability even if the target price shift materializes late.
Ultra Long-Term Strategy
- Short Put: 2025-01-17 Expiry, $65 Strike
- Data: Delta 0.7558452777, Premium $14.05, ROI 34.6192%, Profit $4.864
-
Rationale: This offers a great balance between reduced delta (minimizing assignment risk) and ample ROI, providing substantial profit potential while managing risk.
-
Long Call: 2025-01-17 Expiry, $135 Strike
- Data: Delta -0.979969629, Premium $30.25, ROI 0.9106%, Profit $27.5462
- Rationale: This long call's higher premium is justified by the extraordinary profit potential, aligning well with our low-risk short put for a lucrative trading horizon.
Extended Horizon Strategy
- Short Put: 2025-06-20 Expiry, $70 Strike
- Data: Delta 0.6538066533, Premium $12.35, ROI of 66.1053%, Profit $8.164
-
Rationale: A notably lower delta significantly decreases the risk of assignment, making this the least risky option while offering a remarkable ROI and considerable profit.
-
Long Call: 2025-06-20 Expiry, $135 Strike
- Data: Delta -0.9676846292, Premium $27.98, ROI 0.5295%, Profit $14.8162
- Rationale: This call is well-positioned in terms of profit potential while ensuring a balance with the short puts minimal risk, making it ideal for extended duration strategies.
In conclusion, each of these strategies is selected to optimize the delicate balance between minimizing assignment risk and maximizing the profitability of the calendar spread. The chosen short put options have reduced assignment risk while still offering strong returns. The long call options, matching the respective timelines, are selected for their high ROI and potential profit margins, making them an excellent complement to the short put options. By aligning expiration dates and strike prices wisely, these combinations should achieve robust performance under moderate stock price movements.
Similar Companies in Restaurants:
Chipotle Mexican Grill, Inc. (CMG), Report: Domino's Pizza, Inc. (DPZ), Domino's Pizza, Inc. (DPZ), Yum! Brands, Inc. (YUM), The Wendy's Company (WEN), Report: McDonald's Corporation (MCD), McDonald's Corporation (MCD), Wingstop Inc. (WING), Shake Shack Inc. (SHAK), Papa John's International, Inc. (PZZA), Darden Restaurants, Inc. (DRI), Yum China Holdings, Inc. (YUMC), Restaurant Brands International Inc. (QSR), Dunkin' Brands Group, Inc. (DNKN)
https://www.fool.com/investing/2024/03/31/nike-lululemon-apple-tesla-starbucks-buy-stock/
https://www.fool.com/investing/2024/04/03/starbucks-stock-upside-wall-street-analyst/
https://www.youtube.com/watch?v=ah174dF52qM
https://www.youtube.com/watch?v=pzS8Ro6vq0Q
https://www.fool.com/investing/2024/04/05/got-5000-these-3-high-yielding-dividend-stocks-are/
https://www.fool.com/investing/2024/04/05/better-stock-to-buy-right-now-chipotle-vs-starbuck/
https://www.fool.com/investing/2024/04/13/1-magnificent-growth-stock-down-31-youll-regret-no/
https://www.fool.com/investing/2024/04/14/3-stocks-billionaires-are-buying/
https://www.fool.com/investing/2024/04/15/3-reasons-buy-beaten-down-growth-stock-no-tomorrow/
https://www.fool.com/investing/2024/04/18/where-will-starbucks-stock-be-in-5-years/
https://www.fool.com/investing/2024/04/20/the-smartest-dividend-stocks-to-buy-with-400-right/
https://www.fool.com/investing/2024/04/20/3-top-dividend-stocks-to-buy-today-for-a-lifetime/
https://www.fool.com/investing/2024/04/20/1-growth-stock-down-20-to-buy-right-now/
https://www.fool.com/investing/2024/04/20/can-this-growth-stock-become-the-next-starbucks/
https://www.fool.com/investing/2024/04/20/1-growth-stock-down-25-to-buy-right-now/
https://www.sec.gov/Archives/edgar/data/829224/000082922424000024/sbux-20240331.htm
Copyright © 2024 Tiny Computers (email@tinycomputers.io)
Report ID: KK5cQz
Cost: $0.74059
https://reports.tinycomputers.io/SBUX/SBUX-2024-05-14.html Home