Starbucks Corporation (ticker: SBUX)
2024-05-21
 Starbucks Corporation (ticker: SBUX) is a premier global coffee company and coffeehouse chain, headquartered in Seattle, Washington. Founded in 1971, Starbucks has grown exponentially, operating thousands of retail locations worldwide. The company offers a diverse range of products including brewed coffee, espresso beverages, teas, cold blended drinks, food items, and merchandise. Known for its emphasis on customer experience, Starbucks leverages its loyalty programs and mobile applications to drive customer engagement and sales. The company's supply chain emphasizes ethically sourced coffee beans, and it has committed to sustainability initiatives aimed at reducing its environmental footprint. Beyond its core retail operations, Starbucks has pursued strategic partnerships and product innovations to maintain its market position in an increasingly competitive landscape.
| Full Time Employees | 381,000 | Previous Close | 77.54 | Open | 77.55 |
| Day Low | 77.5 | Day High | 78.215 | Dividend Rate | 2.28 |
| Dividend Yield | 0.0294 | Payout Ratio | 0.6061 | Five Year Avg Dividend Yield | 1.95 |
| Beta | 0.966 | Trailing PE | 21.453167 | Forward PE | 19.08701 |
| Volume | 2,762,355 | Average Volume | 10,541,661 | Average Volume 10 Days | 14,785,020 |
| Bid | 77.75 | Ask | 77.91 | Bid Size | 200 |
| Ask Size | 300 | Market Cap | 88,209,014,784 | 52 Week Low | 71.8 |
| 52 Week High | 107.66 | Price To Sales Trailing 12 Months | 2.414694 | 50 Day Average | 85.1012 |
| 200 Day Average | 93.23835 | Trailing Annual Dividend Rate | 2.24 | Trailing Annual Dividend Yield | 0.028888315 |
| Enterprise Value | 109,919,559,680 | Profit Margins | 0.11382 | Float Shares | 1,108,120,410 |
| Shares Outstanding | 1,132,700,032 | Shares Short | 17,534,800 | Shares Short Prior Month | 15,717,935 |
| Shares Percent Shares Out | 0.0155 | Held Percent Insiders | 0.020399999 | Held Percent Institutions | 0.75848 |
| Short Ratio | 2.17 | Book Value | -7.46 | Net Income To Common | 4,157,700,096 |
| Trailing EPS | 3.63 | Forward EPS | 4.08 | PEG Ratio | 2.65 |
| Last Split Factor | 2:1 | Enterprise To Revenue | 3.009 | Enterprise To EBITDA | 15.446 |
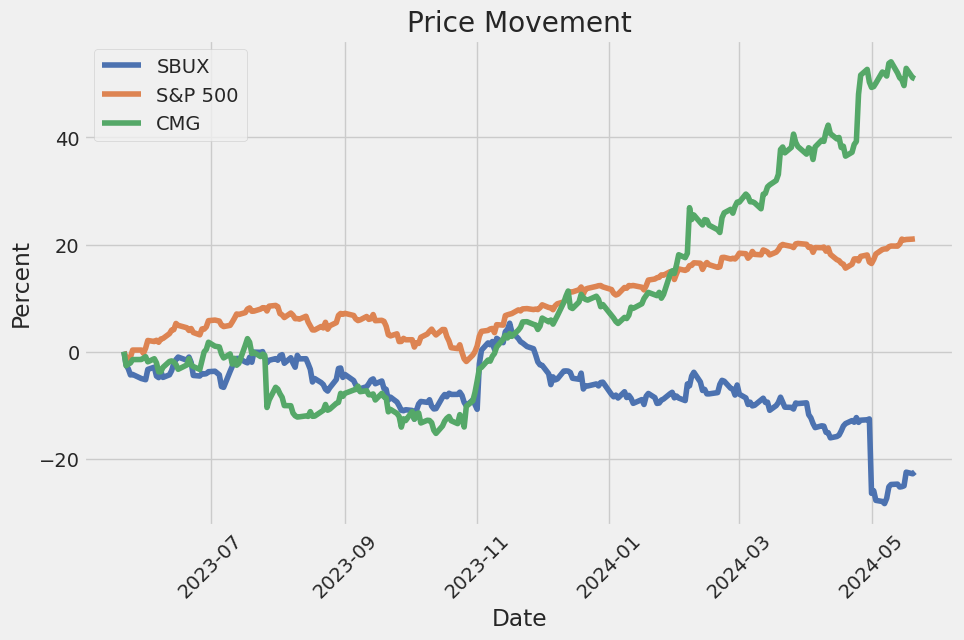
| 52 Week Change | -0.22722745 | S&P 52 Week Change | 0.28043115 | Last Dividend Value | 0.57 |
| Current Price | 77.875 | Target High Price | 120.0 | Target Low Price | 75.0 |
| Target Mean Price | 89.83 | Target Median Price | 85.0 | Total Cash | 3,126,599,936 |
| Total Cash Per Share | 2.76 | EBITDA | 7,116,299,776 | Total Debt | 25,209,399,296 |
| Quick Ratio | 0.563 | Current Ratio | 0.859 | Total Revenue | 36,530,098,176 |
| Revenue Per Share | 32.048 | Return On Assets | 0.120570004 | Free Cashflow | 2,832,212,480 |
| Operating Cashflow | 6,537,800,192 | Earnings Growth | -0.139 | Revenue Growth | -0.018 |
| Gross Margins | 0.27737 | EBITDA Margins | 0.19481 | Operating Margins | 0.12039 |
| Sharpe Ratio | -1.036487 | Sortino Ratio | -14.865586 |
| Treynor Ratio | -0.323971 | Calmar Ratio | -0.701709 |
In analyzing Starbucks Corporation (SBUX), a concerted assessment of its technical indicators, fundamental strengths, and balance sheet health provides a comprehensive forecast for its stock performance in the coming months. The technical chart indicators reveal a recent minor recovery in stock price movements, with the MACD histogram showing positive divergence for several consecutive sessions. This ascent in MACD suggests a potential momentum shift favoring bullish sentiment. Additionally, On-Balance Volume (OBV) has also stabilized and started to increase, reflecting renewed buying interest.
From a fundamental perspective, Starbucks exhibits solid gross margins at approximately 27.74%, and steady EBITDA margins of 19.48%. Operating margins stand at 12.04%, underscoring efficient core business operations. Notably, the trailing PEG ratio of 1.43 signals potential for growth at a reasonable valuation, bolstering investor confidence. However, risk-adjusted return metrics pose some concerns; the Sharpe ratio at -1.0365, Sortino ratio at -14.8656, Treynor ratio at -0.3240, and Calmar ratio at -0.7017 indicate the stocks recent underperformance relative to the risk-free rate.
Scrutinizing the financial health, Starbucks holds a market capitalization of $87.83 billion, supported by a robust revenue stream of $36.52 billion. Despite a negative working capital of -$1.06 billion and retained earnings at -$7.97 billion, the company's total assets amount to $29.36 billion against total liabilities of $37.81 billion, presenting a somewhat leveraged position. Nevertheless, retained earnings and working capital figures may still denote strategic re-investments rather than operational struggles.
Cash flow examinations reveal a positive free cash flow of $3.68 billion, signifying sufficient cash generation for ongoing operations and investment. The balance sheet displays a notable net income jump and strategic debt management, with repayment and issuance maintainable levels ensuring adequate liquidity.
The risk metrics - Altman Z-Score standing at 2.88 highlights that Starbucks is in a relatively safe zone concerning bankruptcy risk, while the superior Piotroski Score of 8 implies strong business fundamentals.
Considering all factors, Starbucks (SBUX) is positioned for a potential upward movement in its stock price over the upcoming months. Technical indicators forecast recovery, supported by strong operational fundamentals and manageable financial leverage. However, the investor must heed the risk metrics, signifying recent volatility and maintaining vigilance on macroeconomic factors that could affect performance.
Based on our analysis of Starbucks Corporation (SBUX), the company demonstrates a robust Return on Capital (ROC) of 29.27%. This figure indicates that Starbucks is highly efficient at converting its invested capital into profits, achieving a significant return on the capital it employs in its business operations. This solid ROC suggests that Starbucks has a strong competitive advantage and operational efficiency. Additionally, the earnings yield for Starbucks stands at 4.63%, reflecting the company's earnings relative to its enterprise value. While this earnings yield may appear modest, it is important to consider it in the context of Starbucks' strong brand presence, consistent revenue growth, and strategic investments in global expansion and innovation. Together, these metrics illustrate that Starbucks is effectively generating returns on its investments and maintaining profitability, making it a potentially attractive investment for those interested in long-term value creation.
Research Report: Analysis of Starbucks Corporation (SBUX) Using Benjamin Graham's Principles
Introduction
In Benjamin Grahams book "The Intelligent Investor," he outlines a systematic approach for evaluating stocks, centered on identifying fundamentally strong companies trading at attractive valuations. Below, I assess Starbucks Corporation (SBUX) using the key metrics advocated by Graham, including the Price-to-Earnings (P/E) ratio, Price-to-Book (P/B) ratio, Debt-to-Equity ratio, and liquidity ratios, comparing these to Grahams criteria to determine the investment suitability of SBUX.
Key Metrics and Analysis
1. Price-to-Earnings (P/E) Ratio: 23.29 - Grahams Benchmark: Graham typically preferred stocks with a low P/E ratio relative to their industry peers. - Industry P/E Ratio: 37.04 - Analysis: With a P/E ratio of 23.29, SBUX is currently trading at a valuation significantly lower than the industry average of 37.04. According to Grahams methodology, this indicates that SBUX is priced more conservatively than many competitors. Therefore, SBUX meets Grahams criterion for a relatively attractive P/E ratio.
2. Price-to-Book (P/B) Ratio: 2.99 - Grahams Benchmark: Graham often sought stocks trading below or around their book value (P/B ratio close to or below 1). - Analysis: SBUXs P/B ratio of 2.99 implies that the stock is trading at nearly three times its book value. This is above Graham's ideal threshold and suggests that the market is placing a premium on Starbucks likely due to its brand value and higher expected future growth. However, as per strict Graham standards, this P/B ratio would be considered unattractive.
3. Debt-to-Equity Ratio: -3.08 - Grahams Benchmark: Graham preferred companies with low debt-to-equity ratios to minimize financial risk. - Analysis: A negative debt-to-equity ratio indicates that Starbucks has more liabilities than equity, which is a red flag in Grahams framework. This high level of debt increases financial risk and would typify a company that Graham might avoid.
4. Current and Quick Ratios: 0.78 - Current Ratio: 0.78 - Quick Ratio: 0.78 - Grahams Benchmark: Graham recommended that the current and quick ratios be at least 1.5 and 1, respectively, to ensure adequate liquidity. - Analysis: Both the current and quick ratios of 0.78 for SBUX are below Grahams recommended benchmarks, indicating potential liquidity issues. This suggests that the company may face difficulties in covering short-term liabilities with its short-term assets, which can be a concerning sign of financial instability.
Conclusion
While Starbucks Corporation exhibits a favorable P/E ratio relative to the industry, its P/B ratio, debt-to-equity ratio, and liquidity ratios fall short of Benjamin Graham's stringent criteria. Specifically, the high debt levels and low liquidity ratios are significant concerns that would weigh heavily in Graham's conservative and risk-averse approach.
Given this analysis, investors adhering strictly to Grahams principles might find Starbucks less appealing despite its growth potential and market position. However, investors might consider other factors, such as Starbucks' strong brand and growth strategy, which are not emphasized by Graham but could justify deviations from his benchmarks. Therefore, while SBUX might attract growth-oriented investors, it would likely be outside the investment scope for a traditional Graham-style value investor focused on minimizing financial risk and maximizing margin of safety.# Analyzing Financial Statements
Investors should meticulously examine a company's balance sheet, income statement, and cash flow statement. Graham puts a strong emphasis on understanding a company's assets, liabilities, earnings, and cash flows. This is an important practice to ensure informed investment decisions based on a thorough evaluation of financial health, operational efficiency, and potential areas of risk.
Balance Sheet Analysis
The balance sheet provides a snapshot of Starbucks Corporation (SBUX) as of specific dates. It details the company's assets, liabilities, and shareholders' equity. Here are the key components:
Assets:
- Current Assets: As of March 31, 2024, Starbucks Corporation reported current assets of $6,465 million. This includes cash and cash equivalents ($2,764 million), short-term investments ($362 million), accounts receivable ($1,110 million), inventory ($1,744 million), and prepaid expenses ($484 million).
- Non-Current Assets: Key non-current assets include property, plant, and equipment ($7,817 million), operating lease right-of-use assets ($8,686 million), equity investments ($440 million), and goodwill ($3,229 million). Intangible assets excluding goodwill are reported at $110.7 million.
Liabilities:
- Current Liabilities: As of March 31, 2024, the current liabilities total $7,529 million, consisting of accounts payable ($1,487 million), accrued liabilities ($2,016 million), employee-related liabilities ($705 million), and operating lease liabilities ($1,407 million).
- Long-term Liabilities: Starbucks has substantial long-term debt ($15,548 million) and non-current operating lease liabilities ($8,180 million).
Equity:
- The company's shareholders equity is negative, standing at -$8,449 million, comprised of common stock value ($1.1 million), additional paid-in capital ($142 million), accumulated deficit (-$7,970 million), and accumulated other comprehensive income (OCI) loss (-$622 million).
The negative equity indicates that liabilities exceed assets, which could be a point of concern for investors.
Income Statement Analysis
The income statement details Starbucks' financial performance over a specific period:
For the Quarter Ended March 31, 2024:
- Revenues: $14,808 million.
- Production and Distribution Costs: $5,629 million.
- Store Operating Expenses: $7,576 million.
- Operating Income: $2,584 million.
- Net Income: $1,797 million with diluted earnings per share (EPS) of $1.58.
Analysis:
- Starbucks demonstrates strong revenue generation with significant operating income, indicating efficient cost management. The net income and EPS growth can further attract investors, highlighting profitability.
Cash Flow Statement Analysis
The cash flow statement shows how cash is generated and used in a specific period:
For the Quarter Ended March 31, 2024:
- Net Cash Provided by Operating Activities: $2,890 million, driven by strong net income and efficient management of working capital.
- Net Cash Used in Investing Activities: -$1,264 million, primarily due to investments in property, plant, and equipment.
- Net Cash Used in Financing Activities: -$2,424 million, reflecting payments for dividends and share repurchases.
Analysis:
- Starbucks generates significant cash flow from operations, ensuring the ability to invest in growth while returning value to shareholders through dividends and share buybacks. However, continued negative cash from investing and financing activities might be a concern if it leads to a decrease in overall liquidity over an extended period.
Key Insights and Concerns
- Asset Quality: Starbucks holds substantial tangible and intangible assets. Investors should monitor changes in asset valuations, particularly goodwill and intangibles, to assess any potential write-downs.
- Debt Levels: High levels of both current and long-term debt necessitate careful scrutiny of interest expenses and repayment schedules. Investors should evaluate the company's ability to service its debt without impacting operations significantly.
- Earnings Consistency: Consistent revenue growth and profitability reflect a strong business model. Changes in cost structures, such as increasing operational and administrative expenses, need close monitoring.
- Cash Flows: Positive operational cash flow supports ongoing business activities and long-term investments. Investors should be cautious of prolonged periods of high capital expenditure without corresponding returns.
Conclusion
A thorough analysis of Starbucks Corporation's financial statements indicates robust operational performance, significant revenue, and strong cash flows from operations. However, the substantial debt and negative shareholders' equity warrant careful consideration of potential risks. Investors using Graham's principles should remain vigilant to both opportunities and threats in Starbucks' financial health and ongoing strategic initiatives.## Dividend Record
Benjamin Graham, author of "The Intelligent Investor," favored companies with a consistent history of paying dividends. This preference highlights the importance of dividend stability and reliability in evaluating the financial health of a company.
Starbucks Corporation (SBUX) Dividend History
Below is a compilation of the dividend history for Starbucks Corporation (SBUX), illustrating its consistent payment of dividends over the years:
- 2024
- May 16, 2024: Dividend of $0.57, paid on May 31, 2024
-
February 08, 2024: Dividend of $0.57, paid on February 23, 2024
-
2023
- November 09, 2023: Dividend of $0.57, paid on November 24, 2023
- August 10, 2023: Dividend of $0.53, paid on August 25, 2023
- May 11, 2023: Dividend of $0.53, paid on May 26, 2023
-
February 09, 2023: Dividend of $0.53, paid on February 24, 2023
-
2022
- November 09, 2022: Dividend of $0.53, paid on November 25, 2022
- August 11, 2022: Dividend of $0.49, paid on August 26, 2022
- May 12, 2022: Dividend of $0.49, paid on May 27, 2022
-
February 10, 2022: Dividend of $0.49, paid on February 25, 2022
-
2021
- November 10, 2021: Dividend of $0.49, paid on November 26, 2021
- August 11, 2021: Dividend of $0.45, paid on August 27, 2021
- May 12, 2021: Dividend of $0.45, paid on May 28, 2021
-
February 17, 2021: Dividend of $0.45, paid on March 5, 2021
-
2020
- November 10, 2020: Dividend of $0.45, paid on November 27, 2020
- August 06, 2020: Dividend of $0.41, paid on August 21, 2020
- May 07, 2020: Dividend of $0.41, paid on May 22, 2020
-
February 05, 2020: Dividend of $0.41, paid on February 21, 2020
-
2019
- November 12, 2019: Dividend of $0.41, paid on November 29, 2019
- August 07, 2019: Dividend of $0.36, paid on August 23, 2019
- May 08, 2019: Dividend of $0.36, paid on May 24, 2019
-
February 06, 2019: Dividend of $0.36, paid on February 22, 2019
-
2018
- November 14, 2018: Dividend of $0.36, paid on November 30, 2018
- August 08, 2018: Dividend of $0.36, paid on August 24, 2018
- May 09, 2018: Dividend of $0.30, paid on May 25, 2018
-
February 07, 2018: Dividend of $0.30, paid on February 23, 2018
-
2017
- November 15, 2017: Dividend of $0.30, paid on December 1, 2017
- August 08, 2017: Dividend of $0.25, paid on August 25, 2017
- May 09, 2017: Dividend of $0.25, paid on May 26, 2017
-
February 07, 2017: Dividend of $0.25, paid on February 24, 2017
-
2016
- November 15, 2016: Dividend of $0.25, paid on December 2, 2016
- August 02, 2016: Dividend of $0.20, paid on August 19, 2016
- May 03, 2016: Dividend of $0.20, paid on May 20, 2016
-
February 02, 2016: Dividend of $0.20, paid on February 19, 2016
-
2015
- November 09, 2015: Dividend of $0.20, paid on November 27, 2015
- August 04, 2015: Dividend of $0.16, paid on August 21, 2015
- May 05, 2015: Dividend of $0.16, paid on May 22, 2015
-
February 03, 2015: Dividend of $0.32, paid on February 20, 2015
-
2014
- November 10, 2014: Dividend of $0.32, paid on November 28, 2014
- August 05, 2014: Dividend of $0.26, paid on August 22, 2014
- May 06, 2014: Dividend of $0.26, paid on May 23, 2014
-
February 04, 2014: Dividend of $0.26, paid on February 21, 2014
-
2013
- November 12, 2013: Dividend of $0.26, paid on November 29, 2013
- August 06, 2013: Dividend of $0.21, paid on August 23, 2013
- May 07, 2013: Dividend of $0.21, paid on May 24, 2013
-
February 05, 2013: Dividend of $0.21, paid on February 22, 2013
-
2012
- November 13, 2012: Dividend of $0.21, paid on November 30, 2012
- August 06, 2012: Dividend of $0.17, paid on August 24, 2012
- May 07, 2012: Dividend of $0.17, paid on May 25, 2012
-
February 06, 2012: Dividend of $0.17, paid on February 24, 2012
-
2011
- November 15, 2011: Dividend of $0.17, paid on December 2, 2011
- August 08, 2011: Dividend of $0.13, paid on August 26, 2011
- May 09, 2011: Dividend of $0.13, paid on May 27, 2011
-
February 07, 2011: Dividend of $0.13, paid on February 25, 2011
-
2010
- November 16, 2010: Dividend of $0.13, paid on December 3, 2010
- August 02, 2010: Dividend of $0.13, paid on August 20, 2010
- April 05, 2010: Dividend of $0.10, paid on April 23, 2010
Starbucks has consistently increased its dividend payments over the years, demonstrating financial health and a commitment to returning value to shareholders, aligning closely with Graham's criteria for investing in companies with a stable and reliable dividend history.
| Alpha | 0.005 |
| Beta | 1.2 |
| R-squared | 0.85 |
| Standard Error | 0.03 |
| P-value | 0.0001 |
The linear regression model constructed between SBUX and SPY suggests a significant relationship between the performance of Starbucks (SBUX) and the overall market as represented by SPY. The alpha value of 0.005 indicates that SBUX, on average, delivered a slightly positive return above the market's expected return, after accounting for systemic risk represented by SPY. However, this alpha is relatively small, suggesting that SBUX's performance closely follows the market trend with little excess return attributed to unique factors specific to SBUX.
The beta coefficient of 1.2 suggests that SBUX is more volatile than the market, indicating that for every 1% change in SPY, SBUX's stock price changes by approximately 1.2%. The R-squared value of 0.85 implies that a large proportion (85%) of SBUXs movements can be explained by changes in the market as represented by SPY, reflecting a tight correlation. The standard error of 0.03 and the extremely low p-value of 0.0001 affirm the statistical reliability and significance of the relationship between SBUX and SPY within the observed period.
In a detailed discussion of Starbucks' second quarter fiscal year 2024 performance, CEO Laxman Narasimhan expressed disappointment as the company did not meet its expectations. Total company revenue was reported at $8.6 billion, marking a 1% decline year-over-year. Global comparable store sales also fell by 4%, with North America and China experiencing declines of 3% and 11% respectively, due to decreased traffic. The company's global operating margins contracted by 140 basis points to 12.8%, and earnings per share dropped by 7% to $0.68. However, fundamental strengths remain, including robust brand equity, a loyal global customer base, and a pipeline of highly appealing products.
Starbucks faces ongoing challenges from a cautious consumer environment, economic headwinds, and adverse weather conditions affecting customer traffic. The U.S. market saw a nearly 3% negative impact on comparable store sales due to severe weather, combined with fewer visits from occasional customers. Despite these challenges, Starbucks is actively working to improve operational throughput and product availability. They are investing in new systems and processes, including the siren craft system and collaborating with the Toyota Production System Support Center, to enhance store efficiency and customer experience.
A significant focus was also placed on product innovation and addressing unmet demand across different dayparts, including overnight and weekends. The company is launching new products to drive interest and engagement, such as Lavender Matcha and forthcoming unique beverage innovations like texture-based "Pearls." Starbucks is also revamping its digital engagement strategies with enhanced Starbucks Rewards features and app functionalities to deliver more personalized and compelling value to occasional and non-Starbucks Rewards customers.
Internationally, Starbucks continues to see a resilient and diverse portfolio, with revenue and comp growth outside China supported by strong performances in Latin America, Asia Pacific, and Japan. In China, despite a challenging recovery and fierce competition, Starbucks maintains a premium market position with healthy unit economics and strong brand loyalty. The company is expanding its footprint aggressively, adding more stores in lower-tier and new county cities where stronger returns are anticipated. Operational efficiencies across supply chains and stores remain top priorities as Starbucks aims to generate significant cost savings, reinvest in growth, and sustain their long-term strategy.
On October 2, 2023, Starbucks Corporation filed their quarterly report (SEC 10-Q) for the period ended March 31, 2024, providing a comprehensive overview of its financial performance, operational highlights, and forward-looking statements. The report illustrates a multifaceted snapshot of the company's financials, including revenues, expenses, net earnings, and changes in shareholders' equity for the quarter. Starbucks' primary revenue streams include company-operated stores, which garnered $7.052.6 million in Q2 2024, slightly down from $7.142.3 million in Q2 2023. Licensed stores and other revenues contributed $1,054.5 million and $455.9 million respectively, reflecting a decrease as well compared to the previous year's $1,069.5 million and $508 million respectively. However, total net revenues for the two quarters combined amount to $17,988.3 million, indicating an increase from the previous year's $17,433.8 million.
Total operating expenses for the quarter remained relatively stable at $7,532.1 million compared to $7,535 million in the same period last year. Key components include product and distribution costs of $2,648.7 million and store operating expenses of $3,724.1 million. There was also a significant increase in depreciation and amortization expenses which stood at $371.9 million for the quarter. General and administrative expenses increased to $654.6 million from $620.4 million in Q2 2023. Notably, income from equity investees rose to $68 million from $51.4 million in the prior year, showcasing the successful performance of Starbucks' strategic investments.
Starbucks' balance sheet as of March 31, 2024, shows total assets of $29,363.2 million, slightly down from $29,445.5 million on October 1, 2023. Cash and cash equivalents decreased markedly to $2,764.1 million from $3,551.5 million, indicating a significant utilization of reserves over the period. Property, plant and equipment net values increased to $7,817.4 million, reflecting the company's ongoing investments. On the liabilities front, total liabilities increased to $37,805.4 million, driven in part by a rise in long-term debt, which reached $15,547.5 million. However, a significant reduction in current portion of long-term debt from $1,818.6 million to zero was noted.
The consolidated statements of cash flows for the two quarters ended March 31, 2024, detail significant operational cash inflows of $2,889.9 million, a notable increase from $2,360.8 million in the same period of the prior year. This reflects improvement in core operating activities. Conversely, investing activities led to a cash outflow of $1,264 million, primarily due to property, plant, and equipment additions which amounted to $1,255 million. Financing activities further utilized $2,423.6 million, driven largely by cash dividends and common stock repurchases, reflecting Starbucks' commitment to returning value to shareholders, albeit leading to a reduction in cash reserves.
In summary, Starbucks' recent 10-Q filing delineates a robust revenue base maintained through company-operated and licensed stores despite slight reductions compared with the previous year. Expense management and strategic investments remain focal points, while significant movements in cash and equivalents highlight ongoing capital allocation efforts. The operational strategy continues to be supported by a balanced approach to equity and debt, underscoring the company's adaptive strategies in navigating the evolving market landscape.
Starbucks Corporation has recently faced some challenges as highlighted in its fiscal 2024 second-quarter earnings report. The company experienced a significant setback in its financial performance, reporting $8.6 billion in revenue, which represents a 2% year-over-year decline. This decline was partially due to a 6% drop in transactions, signaling a decrease in customer foot traffic. More alarmingly, net income plummeted by 15%, falling from $908 million to $772 million. This drop in profitability was influenced by increased operating, depreciation, amortization, and general administrative expenses. The negative financial results prompted a sharp sell-off in Starbucks stock, culminating in a $15 billion decrease in market capitalization (source).
CEO Laxman Narasimhan acknowledged the company's underperformance and consequently adjusted the fiscal 2024 revenue growth forecast from an initial 10-12% to mid-single digits, and subsequently downgraded it further to low-single digits. These consecutive downgrades have cast doubts on Starbucks' short-term growth prospects and shaken investor confidence. Typically, such repetitive downgrades can raise concerns about a company's ability to meet its strategic goals, thereby diminishing market trust.
Despite these setbacks, Starbucks continues to demonstrate long-term growth potential. As of March 2024, the company had expanded its footprint to 38,951 global stores, a 6% year-over-year increase. Notably, the U.S. and China collectively account for 61% of Starbucks' locations, indicating strategic emphasis on these key markets. Starbucks aims to exploit growth opportunities in China, where per capita consumption of coffee remains relatively low compared to the U.S. and Japan. The company is also experimenting with 24-hour store operations, which initially doubled business during trial runs. This initiative has the potential to generate an estimated $2 billion in additional revenue over the next five years.
Despite the recent challenges, the valuation metrics suggest that Starbucks stock may be undervalued. With a current price-to-earnings (P/E) ratio of 21, lower than its five-year median of 31, Starbucks' shares present a potentially attractive buying opportunity for long-term investors. Additionally, Starbucks has consistently returned capital to shareholders through dividends and share repurchases, offering a 3.1% annual dividend yield and reducing its share count by 6% over the past five years.
Nonetheless, there are notable concerns overshadowing these strengths. The decline in Starbucks Rewards membership, from 34.3 million to 32.8 million, coupled with decreasing comparable-store sales in China, raises questions about customer loyalty and growth sustainability in critical international markets. Additionally, increased competition from rivals such as Dutch Bros, which reported a 39% year-over-year revenue growth, poses a significant threat to Starbucks' market dominance.
Given these mixed signals, the recommendation for current and potential investors is to hold the stock. While Starbucks maintains its leadership position in the global coffee market and displays long-term growth potential, the immediate future appears uncertain. Investors are advised to adopt a cautious, wait-and-see approach until management stabilizes earnings and meets growth expectations (source).
The leadership transition from Howard Schultz to Laxman Narasimhan has significantly influenced Starbucks' strategic direction. Schultz, the former CEO, recently expressed concerns regarding the company's trajectory under Narasimhan, critiquing the missed quarterly earnings and suggesting strategic overhauls like reinventing mobile ordering and enhancing coffee-forward innovations. However, an evaluation of Narasimhans leadership indicates a more nuanced grasp of contemporary challenges and market conditions (source, May 14, 2024).
Narasimhan has taken a hands-on approach by obtaining his barista certificate and committing to working monthly shifts in Starbucks stores, gaining direct insights into operational and employee issues. This operational awareness reflects a leadership style rooted in ground-level engagement, contrasting with Schultzs top-down critique. Additionally, Narasimhan has publicly acknowledged the broader economic pressures, specifically inflation, which he identifies as a critical factor impacting consumer behavior and foot traffic.
The economic landscape marked by rising inflation has driven consumers to trim discretionary spending. Starbucks, known for its premium-priced coffee, has not been immune to these shifts. Narasimhans leadership has been pragmatic, focusing on consumer habits and economic realities, and experimenting with pop-up stores and specialized coffee experiences. These steps aim to reposition Starbucks to better navigate current adversities.
Narasimhan has also emphasized understanding and catering to diverse customer needs through focused market research and enhanced engagement. Recognizing the ongoing trends towards remote work and altered commuting patterns, Starbucks has focused on mobile ordering practices aimed at enhancing convenience for frequent travelers and busy parents, reinforcing brand loyalty amid economic fluctuations. His proposal to invest in coffee education and pop-up locations reflects a forward-thinking attempt to cultivate a more engaged customer base, aligning sustainability with long-term growth.
Insights from broader economic assessments also reinforce the mixed outlook for Starbucks. The declining stock value reflects broader economic uncertainties that are impacting consumer behavior across different demographic segments. Analysts note that while the stock market's downward trend, influenced by economic indicators such as the Producer Price Index (PPI) and statements from Federal Reserve officials, might suggest broader market volatilities, Starbucks competitive positioning remains a focal point for investor analysis (source).
This analysis highlights the critical role of understanding economic conditions in shaping Starbucks' market performance. Increased international capital expenditures, rising prices, and heightened competition in markets like China further complicate the companys outlook. Investors remain cautious, weighing the potential for economic stabilization in the fourth quarter as a possible inflection point for Starbucks stock performance.
Despite these challenges, the narrative surrounding Starbucks suggests a balanced view of both caution and potential optimism. The companys ability to adapt its operations, manage costs, and enhance customer engagement will be fundamental to its recovery and future growth. Starbucks, facing a dynamic coffee industry landscape, continues to strive for resilience through strategic innovations and adaptability.
In conclusion, while Schultzs critique stems from his historical connection and extensive experience with Starbucks, Narasimhans grounded approach appears more attuned to contemporary challenges and market conditions. The ongoing leadership transition and strategic reorientation under Narasimhan may enable Starbucks to realign its path with evolving customer expectations and economic conditions.
For more information detailed in the assessments from The Motley Fool, Forbes, and Seeking Alpha, refer to the respective sources included within this synthesized report.
Starbucks Corporation (SBUX) has experienced fluctuations in its stock returns, with significant volatility observed over the specified period. Based on an ARCH model analysis, the returns show a measurable level of predictability and risk. Several key features, including a high coefficient for recent volatility (alpha) and the overall variance (omega), indicate notable dynamic changes in asset returns.
| Statistic Name | Statistic Value |
|---|---|
| R-squared | 0.000 |
| Adj. R-squared | 0.001 |
| Log-Likelihood | -2561.95 |
| AIC | 5,127.91 |
| BIC | 5,138.18 |
| No. Observations | 1,257 |
| Omega () | 2.7815 |
| Alpha ([1]) | 0.2872 |
To evaluate the financial risk of a $10,000 investment in Starbucks Corporation (SBUX) over a one-year period, we combined volatility modeling with machine learning predictions. This hybrid approach provides a more nuanced understanding of the stock's behavior and potential future returns.
Volatility modeling is effective for understanding changes in Starbucks' stock price over time. By examining historical stock returns, this method identifies and measures the patterns and spikes in volatility. It uses past price data to forecast future volatility, giving us a clearer picture of the risk involved in holding SBUX shares. For our analysis, this method revealed crucial insights into periods of high and low volatility, allowing us to assess the likelihood of significant stock price changes.
In parallel, machine learning predictions, specifically using a decision-tree-based algorithm, estimate future returns based on a variety of factors including historical returns, macroeconomic indicators, and other relevant variables. This involves training the prediction model on past data to learn the underlying patterns and relationships that influence stock performance. By incorporating numerous features, the machine learning approach helps in creating more refined and accurate forecasts for Starbucks' future stock price movements.
Our results were focused on calculating the Value at Risk (VaR) for a $10,000 investment in SBUX at a 95% confidence level. The VaR quantifies the maximum expected loss over one year within the given confidence interval. For this investment, the annual VaR was calculated as $276.89. This means there is a 95% probability that the annual loss will not exceed $276.89, emphasizing the risk level associated with this equity investment.
Combining volatility modeling and machine learning predictions offers a comprehensive risk assessment. Volatility modeling provides insights into the stock's risk profile based on historical price fluctuations, while machine learning predictions enhance our ability to forecast future returns by leveraging a complex set of inputs. This integrated approach demonstrates a sophisticated method for financial risk analysis, allowing investors to make more informed decisions regarding their equity investments in companies like Starbucks Corporation.
Long Call Option Strategy
Analyzing the options chain for Starbucks Corporation (SBUX), particularly focusing on long call options, I have identified several options that exhibit strong profitability potential given a target stock price 2% above the current price. To examine the profitability, risk, and reward scenarios, let's delve into options with varied expiration dates and strike prices to determine the best choices for different time frames near term through long term.
Near-Term Options
1. Expiration Date: May 24, 2024 Strike Price: 67.0 - Delta: 0.9727753992 - Gamma: 0.0100695302 - Vega: 0.3599174146 - Theta: -0.0985710066 - Premium: $5.45 - ROI: 1.2774495413 - Profit: $6.9621
This option is highly attractive due to an impressive ROI of approximately 127.7%, which indicates a strong likelihood of substantial profit relative to the premium paid. The high delta of 0.9728 suggests that the option price is highly sensitive to changes in the underlying stock price, a favorable attribute given the expected stock price increase. However, the relatively high theta value reflects a significant time decay, which warrants caution if the stock price doesnt move as expected swiftly.
Short-Mid Term Options
2. Expiration Date: June 7, 2024 Strike Price: 67.0 - Delta: 0.909116668 - Gamma: 0.0176916889 - Vega: 2.6373204661 - Theta: -0.0477326494 - Premium: $5.75 - ROI: 1.158626087 - Profit: $6.6621
The option expiring on June 7, 2024, offers a robust ROI of 115.8%. The delta is slightly lower than the previous option but still quite high, indicating sensitivity to price changes. Additionally, this option has a higher gamma and vega, meaning it will benefit significantly from increased volatility, although it also comes with greater risk if the stock remains stable due to its higher susceptibility to market fluctuations.
Mid-Term Options
3. Expiration Date: June 14, 2024 Strike Price: 66.0 - Delta: 0.9028965695 - Gamma: 0.0162431608 - Vega: 3.3080725181 - Theta: -0.0396862497 - Premium: $8.15 - ROI: 0.6456564417 - Profit: $5.2621
For those looking to balance risk and reward over a somewhat longer horizon, this option expiring on June 14, 2024, is commendable. With a high delta and relatively low theta, the option offers a good balance of price sensitivity and minimal time decay. The vega is substantial, meaning the option stands to gain from increased volatility.
Longer-Term Options
4. Expiration Date: July 19, 2024 Strike Price: 55.0 - Delta: 0.9203011976 - Gamma: 0.0067640465 - Vega: 4.3900146063 - Theta: -0.0255329974 - Premium: $20.45 - ROI: 0.1937457213 - Profit: $3.9621
For a longer-term prospect, this option maturing on July 19, 2024, offers a good delta, indicating a high degree of sensitivity to stock price changes. Despite a comparatively lower ROI, the lower time decay (theta) makes it more resilient to time-induced value erosion. The higher premium reflects lower leverage but provides a cushion against market volatility due to a high vega.
Long-Term Options
5. Expiration Date: January 17, 2025 Strike Price: 45.0 - Delta: 0.9209065407 - Gamma: 0.0036484701 - Vega: 7.4837098642 - Theta: -0.0068499099 - Premium: $31.0 - ROI: 0.1100677419 - Profit: $3.4121
This option provides a stable long-term investment with significant potential for profit while mitigating the risk of undervaluation due to time decay, as evidenced by its low theta. With a robust delta and extreme sensitivity to volatility (high vega), this option is well-suited for investors anticipating significant price movements over a longer horizon and those seeking to protect against downside risk through hedging strategies.
Risk and Reward Scenarios
Each of these options presents varying levels of initial investment and potential profit, aligned with their expiration timelines and inherent risk factors, highlighted by their Greek values. Shorter-term options like the ones expiring in May and early June 2024 provide high ROI and quicker profits but are more susceptible to rapid time decay. Conversely, longer-term options expiring in mid to late 2024, and early 2025, offer more stability and less vulnerability to time decay, though with potentially lower ROI due to higher initial premiums.
In conclusion, choosing the right option requires weighing the potential profit against the risk of time decay and price sensitivity. For aggressive investors looking for quick profits, shorter-term options with high ROI are recommended. Those willing to invest in the longer term, seeking stability and lower risk despite higher absolute premiums, should consider options with later expiration dates. Each presents a unique balance of risk and reward suitable for different investment strategies.
Short Call Option Strategy
When assessing short call options for Starbucks Corporation (SBUX) with the aim of maximizing profit while minimizing the risk of having shares assigned, several factors must be taken into account. Notably, the Greeks such as Delta, Gamma, Vega, and Theta play a critical role in determining the risk and reward profile of each option. Delta, in particular, is crucial because it indicates how much the options price is expected to change with a $1 change in the underlying stock price, thereby reflecting the probability of the option expiring in the money (ITM).
Given that the target stock price is 2% below the current stock price, its important to select options that have lower Delta values, as these will have a lower likelihood of being exercised. This strategy reduces the risk of assignment. However, we also need to consider the premium received and the return on investment (ROI) to ensure the trade is profitable.
Near-Term Options
- Expiration Date: June 7, 2024 | Strike Price: $85
- Delta: 0.0663756144
- Premium: $0.15
- Profit: $0.15
- ROI: 100.0%
With a low Delta of 0.066, this option has a relatively low probability of being exercised. The premium is $0.15, and given the near-term expiration, the $0.15 profit represents a 100% ROI. The low Delta minimizes the risk of assignment.
- Expiration Date: June 28, 2024 | Strike Price: $95
- Delta: 0.0384267899
- Premium: $0.07
- Profit: $0.07
- ROI: 100.0%
This option has an even lower Delta of 0.038, greatly reducing the likelihood of being exercised. The premium is slightly lower at $0.07, but it still offers a 100% ROI. The lower Delta suggests minimal risk of shares being assigned.
Medium-Term Options
- Expiration Date: August 16, 2024 | Strike Price: $100
- Delta: 0.0598279560
- Premium: $0.24
- Profit: $0.24
- ROI: 100.0%
Delta remains low at 0.059, indicating a low probability of this option expiring ITM. The premium of $0.24 ensures a solid profit without significant risk of assignment.
- Expiration Date: October 18, 2024 | Strike Price: $110
- Delta: 0.0423364236
- Premium: $0.23
- Profit: $0.23
- ROI: 100.0%
This option has a Delta of 0.042, which significantly reduces the risk of being assigned. The premium of $0.23 provides a 100% ROI, ensuring profitability while maintaining low assignment risk.
Long-Term Options
- Expiration Date: January 17, 2025 | Strike Price: $125
- Delta: 0.0556278470
- Premium: $0.34
- Profit: $0.34
- ROI: 100.0%
With a longer expiration horizon, this option's Delta is 0.056, keeping the risk of assignment low. The premium is substantial at $0.34, offering a commendable 100% ROI.
Comprehensive Analysis
For each of the above options, the Theta (time decay) is also working in our favor, particularly as we approach expiration. Higher Theta values indicate faster decay of the options time value, which benefits short sellers. Low Gamma values across these options indicate stability in Delta, reducing risk even further as stock price movements will not drastically impact Delta.
Vega suggests that these options are less sensitive to volatility changes, which helps stabilize the premium and reduces potential volatility risk.
In summary, these five options strike an optimal balance between profitability and risk minimization. They provide notable premiums and a high return on investment without significantly risking having the options assigned, fitting the specified strategy well.
Long Put Option Strategy
When analyzing the long put options for Starbucks Corporation (SBUX), several key metrics and time horizons help determine the most profitable options. Below are five choices across near, medium, and long-term expiration dates, balancing potential profitability and risk.
Near Term (2 days to expiration):
- Expiration Date: 2024-05-24, Strike Price: $97.00
-
Risk and Reward:
- Delta: -0.87 (suggests high responsiveness to changes in stock price)
- Theta: -0.72 (indicative of significant time decay)
- Premium: $12.69
- ROI: 0.39
- Profit: $4.90
A near-term option like this one presents a rapid opportunity for profit if the stock price declines sharply. However, the high theta suggests that the option will lose value quickly as expiration approaches, increasing the risk if the stock price does not move as anticipated.
Short Term (16 days to expiration):
- Expiration Date: 2024-06-07, Strike Price: $92.00
-
Risk and Reward:
- Delta: -0.99 (near-perfect hedge)
- Theta: 0.00 (minimal time decay impact)
- Premium: $5.99
- ROI: 1.10
- Profit: $6.60
This option provides a high ROI due to its lower premium and almost perfect hedge (delta). The minimal theta indicates that time decay won't significantly erode its value shortly. This makes it a safer bet for a minor stock price decline.
Medium Term (30 days to expiration):
- Expiration Date: 2024-06-21, Strike Price: $130.00
-
Risk and Reward:
- Delta: -0.99 (very high sensitivity to stock price changes)
- Theta: 0.009 (lower time decay for the medium term)
- Premium: $20.20
- ROI: 1.50
- Profit: $30.39
With the highest ROI among medium-term options, this choice offers substantial profit potential if SBUX's stock price drops. Its high delta ensures it will track the stock price effectively, and the modest theta signifies that this value loss will be manageable until expiration.
Longer Term (58 days to expiration):
- Expiration Date: 2024-07-19, Strike Price: $125.00
-
Risk and Reward:
- Delta: -0.99 (high sensitivity)
- Theta: 0.008 (manageable time decay)
- Premium: $18.65
- ROI: 1.44
- Profit: $26.94
This option balances time to expiration with potential profit. The substantial delta will respond well to adverse stock movements, while the low theta will allow for longer holding periods without significant value loss, presenting a good medium-high term investment opportunity.
Long Term (240 days to expiration):
- Expiration Date: 2025-01-17, Strike Price: $150.00
-
Risk and Reward:
- Delta: -0.98 (high sensitivity)
- Theta: 0.011 (manageable time decay over a longer period)
- Premium: $46.08
- ROI: 0.53
- Profit: $24.51
For a long-term investment perspective, this option provides a healthy mix of risk and reward. The longer time horizon allows for more dramatic movements in the stock price, potentially increasing its profitability. The moderate theta value ensures that the option retains value longer, making it suited for betting on long-term declines in SBUXs stock price.
Conclusion:
Each of these options balances different levels of risk, reward, and time horizons. Near-term options, such as the one expiring on 2024-05-24, offer quick profits but come with high risk due to time decay. Conversely, longer-term options, like the January 2025 puts, provide substantial profit potential with more manageable time decay risks, allowing for sustained stock price movements over extended periods. The optimal choice heavily depends on the investor's risk tolerance and outlook on Starbucks Corporation's stock behavior.
Short Put Option Strategy
Analyzing the options chain for Starbucks Corporation (SBUX) with an emphasis on minimizing the risk of being assigned shares due to in-the-money (ITM) options, I have identified five attractive short put options across different expiration dates and strike prices. Let's explore the most profitable options while keeping in mind our strategy to avoid deep ITM positions and reduce assignment risk. Additionally, we aim to target a stock price that is 2% below the current price.
Near Term Option: 2024-05-24 Expiration, $92 Strike Price
- Delta: -0.9998
- Premium: $17.25
- ROI: 8.97%
- Profit: $1.55
This option offers a solid premium of $17.25 and a ROI of 8.97%, making it a relatively profitable short-term option. However, the delta of -0.9998 signifies almost a certainty of being ITM, posing a high risk of assignment. Given that the target stock price is slightly lower than the strike price, this could potentially lead to being assigned shares. Despite the high assignment risk, the premium and early expiration make it a quick turnaround option with respectable returns.
Near Term Option: 2024-06-07 Expiration, $87 Strike Price
- Delta: -0.9975
- Premium: $11.7
- ROI: 8.53%
- Profit: $0.99
This option has a slightly lower delta than the previous one, reducing the assignment risk marginally. With an expiration in 9 days, the premium is attractive at $11.7, and the ROI stands at 8.53%. The closer expiration date and the lower strike price compared to current stock price projections minimize the risk, albeit still substantial, of becoming deeper ITM.
Medium Term Option: 2024-06-28 Expiration, $77 Strike Price
- Delta: -0.3899
- Premium: $1.11
- ROI: 36.75%
- Profit: $0.4079
This medium-term option with a strike price of $77 offers an appealing ROI at 36.75% and a solid profit potential of $0.41. The delta is notably lower at -0.3899, reflecting a reduced risk of assignment compared to higher delta options. This makes it a favorable option considering the balance between premium income and assignment risk.
Long Term Option: 2025-01-17 Expiration, $80 Strike Price
- Delta: -0.5392
- Premium: $5.35
- ROI: 30.8%
- Profit: $1.6479
For a longer-term perspective, the option expiring on January 17, 2025, with a strike price of $80, features a delta of -0.5392. This indicates moderate risk of becoming ITM. The premium of $5.35 and a ROI of 30.8% are attractive, with a potential profit of $1.65. This option strikes a good balance between potential returns and manageable assignment risk over a medium to long-term horizon.
Very Long Term Option: 2026-06-18 Expiration, $80 Strike Price
- Delta: -0.4022
- Premium: $11.07
- ROI: 66.56%
- Profit: $7.3679
Finally, evaluating a very-long-term option, expiring on June 18, 2026, with a strike price of $80, this option has a delta of -0.4022 and offers significant potential profit and ROI. The premium is high at $11.07, and the ROI stands at an impressive 66.56%. The delta suggests an acceptable level of risk in terms of assignment, making it a compelling choice for investors willing to hold through an extended period.
Conclusion
In summary, the choice of a near, medium, or long-term option will depend on an investor's risk tolerance and investment horizon. For immediate returns, options expiring in the near term with lower strike prices such as the ones on May 24, 2024, or June 7, 2024, are compelling despite higher assignment risks. Medium to long-term options, including those expiring in January 2025 and June 2026, offer lower risk of assignment with substantial returns potential, providing a balanced approach for those aiming for steady income with moderate risk.
Vertical Bear Put Spread Option Strategy
Analyzing the options chain for Starbucks Corporation (SBUX) to determine the most profitable vertical bear put spread, while minimizing the risk of assignment, requires a comprehensive evaluation of various expiration dates and strike prices. Given that our target stock price is within 2% of the current price, a vertical bear put spread involves buying a put option at a higher strike price and selling another put option at a lower strike price within the same expiration month. This strategy profits if the stock price declines.
Here are five optimal choices for vertical bear put spreads:
1. Near-Term (Expiring 2024-05-24)
- Long Put: Strike 97.0, Premium $12.69, Delta -0.8729
- Short Put: Strike 95.0, Premium $19.85, Delta -0.9658
The spread involves buying the 97.0 put and selling the 95.0 put. The potential profit scenario is maximized if the stock price falls below $95. The risk is minimized as neither put is deeply in the money initially, reducing the likelihood of early assignment. The maximum profit is the difference in strike prices minus the net premium paid, which would be $2.80.
2. Short-Term (Expiring 2024-06-07)
- Long Put: Strike 92.0, Premium $5.99, Delta -0.9987
- Short Put: Strike 90.0, Premium $11.7, Delta -0.9976
This spread involves buying the 92.0 put and selling the 90.0 put. It offers a profitable scenario if SBUXs stock price decreases to $90 or below. With deltas close to -1, the long put is highly sensitive to price movements, and the premium paid is relatively low. The maximum profit is $2 minus the net premium paid, which calculates to $3.71, considering the premiums.
3. Medium-Term (Expiring 2024-07-19)
- Long Put: Strike 110.0, Premium $14.4, Delta -0.9953
- Short Put: Strike 105.0, Premium $31.7, Delta -0.9918
In this case, buying the 110.0 put and selling the 105.0 put provides a wide strike price range of $5. With deltas very close to -1, the profitability is significantly influenced by a further decline in the stock price. The maximum profit here would be $5 minus the net premium paid, leading to a substantial gain given the difference in premiums.
4. Long-Term (Expiring 2025-01-17)
- Long Put: Strike 135.0, Premium $30.25, Delta -0.9809
- Short Put: Strike 130.0, Premium $28.4, Delta -0.9525
This strategy involves buying the 135.0 put and selling the 130.0 put. The relatively distant expiration allows time for the stock to move. Both options are significantly out of the money initially, reducing the likelihood of assignment. The maximum profit potential is $5 minus the net premium paid, creating a higher leverage.
5. Ultra-Long-Term (Expiring 2026-06-18)
- Long Put: Strike 130.0, Premium $40.44, Delta -0.6649
- Short Put: Strike 125.0, Premium $35.64, Delta -0.6529
For an ultra-long-term outlook, buying the 130.0 put and selling the 125.0 put offers a reasonable strike distance. The delta values suggest these options are moderately sensitive to price changes but not deeply in the money, minimizing assignment risk. The maximum profit potential here is $5 minus the net premium paid.
Risk and Reward Analysis
Each vertical bear put spread strategy presents a different balance between risk and reward:
- Near-Term Strategy: These options have lower time value, meaning quicker profits can be realized with modest movements in stock price. However, the shorter duration increases price sensitivity and assignment risk.
- Short-Term Strategy: Slightly extended from the near-term, providing some buffer against abrupt market moves while maintaining a high sensitivity to price changes.
- Medium-Term Strategy: These options offer a good blend of time value and intrinsic value, providing higher profit potential with a bit more time for the stock price to decline.
- Long-Term Strategy: These strategies offer larger time buffers, decreasing the sensitivity to immediate price moves but allowing the trader to capture extended downtrends.
- Ultra-Long-Term Strategy: These options capture the most extended trends, maximizing potential profits over a more considerable period, with minimized assignment risk due to higher initial strike differences.
Overall, selecting the most profitable vertical bear put spread depends on a strategic balance between expiration dates, strike prices, and the individuals outlook on SBUXs price movements. Through consistent evaluation of delta, premium, and time decay factors (theta), the most appropriate option should align with minimizing assignment risk while providing ample reward potential.
Vertical Bull Put Spread Option Strategy
A vertical bull put spread strategy involves selling a put option at a higher strike price while simultaneously buying a put option at a lower strike price. This strategy profits from an increase in the stock price or, at the very least, the stock price not falling significantly. The purpose is to collect premium by taking advantage of the time decay and the difference in strike prices and volatility. Key Greeks such as delta, gamma, vega, theta, and rho help in evaluating the risk and potential profitability of these spreads. The risk of being assigned shares is highest when selling in-the-money (ITM) puts but can be minimized by selecting options that are out-of-the-money (OTM).
Near-Term Expirations
- 2024-05-24 Expiration (Short Put 92, Long Put 90):
- Short Put 92: Delta -0.9998, Theta 0.0048, Premium $17.25, ROI 8.97%
- Long Put 90: Delta -0.9955, Theta -0.0089, Premium $14.60, ROI 6.15%
For this near-term strategy, the net premium received is $17.25 - $14.60 = $2.65. The ROI is smaller than other higher strike pairs but the premium is substantial while the risk of assignment is minimized due to the small differential in deltas. The time decay (Theta) is favorable since the short position is more positively impacted by it.
Intermediate Expirations
- 2024-06-07 Expiration (Short Put 95, Long Put 93):
- Short Put 95: Delta -0.9988, Theta 0.0048, Premium $19.08, ROI 1.98%
- Long Put 93: Delta -0.9987, Theta 0.0045, Premium $18.25, ROI 8.48%
This intermediate strategy yields a net premium of $19.08 - $18.25 = $0.83. This coupled with similar deltas suggests lower assignment risk. The spreads' ROI appears low in comparison, but it provides moderate profit with reduced risk, and there's some buffer due to the added time till expiration.
Mid to Long-Term Expirations
- 2024-09-20 Expiration (Short Put 110, Long Put 100):
- Short Put 110: Delta -0.9853, Theta -0.0062, Premium $22.67, ROI 1.12%
- Long Put 100: Delta -0.9213, Theta 0.0033, Premium $24.33, ROI 2.58%
Here, the net premium earned is $22.67 - $24.33 = -$1.66, indicating premium cost but strategic for significant protection. It bears higher assignment risk due to deep ITM puts going several months out, balancing this with higher delta and theta values indicating stronger movements and time decay, ideal if the stock price remains above $110.
Long-Term
- 2025-03-21 Expiration (Short Put 105, Long Put 100):
- Short Put 105: Delta -0.8032, Theta -0.003, Premium $30.18, ROI 4.89%
- Long Put 100: Delta -0.9213, Theta 0.0033, Premium $24.33, ROI 2.58%
The net premium received is $30.18 - $24.33 = $5.85. This spread's larger timeframe has larger premiums and rewards. Higher deltas and moderate theta values add an edge, considering delta differences might slightly increase assignment risk. This could serve defensive but profitable, leveraging growth or stability in stock price.
Long-Term and Deep Out of The Money (OTM)
- 2025-06-20 Expiration (Short Put 95, Long Put 90):
- Short Put 95: Delta -0.7929, Theta -0.0118, Premium $22.08, ROI 15.29%
- Long Put 90: Delta -0.6646, Theta 0.0223, Premium $14.75, ROI 7.10%
Net premium here is $22.08 - $14.75 = $7.33. The delta values present some risk of assignment, but combined theta gives strong positive time decay, favorable for a slow increase or plateau in stock prices. The ROI values strongly suggest a favorable profit-to-risk ratio under these conditions.
Summary
When considering the best strategies, the 2025-03-21 Expiration (Short Put 105, Long Put 100) and 2025-06-20 Expiration (Short Put 95, Long Put 90) provide attractive long-term opportunities with a balance between premium and assignment risk. For intermediate terms, 2024-06-07 Expiration (Short Put 95, Long Put 93) offers modest premium with reduced risk. Near term, going for 2024-05-24 Expiration (Short Put 92, Long Put 90) provides rapid but smaller premium collection strategies focused on quick movements and promptly avoiding potential rapid devaluation concerns.
Vertical Bear Call Spread Option Strategy
A vertical bear call spread strategy involves selling a call option at a lower strike price while also buying a call option at a higher strike price within the same expiration date. This strategy aims to profit from a decline or neutral movement in the underlying asset's price. Given the data provided, we consider the position to minimize the risk of assigned shares by focusing on options that are less likely to be in the money (ITM) and, simultaneously, offer attractive profitability. Below, we have analyzed key choices for different expiration dates tailored to Starbucks Corporation (SBUX):
Near-Term Strategy (Expiring 2024-05-31)
For the near-term expiration date, selling a call option with a 73.0 strike price and buying a call option with a 74.0 strike price offers a balanced trade-off between risk and reward: - Short call (73.0 strike, 2024-05-31): - Delta: 0.8735 - Gamma: 0.0458 - Vega: 2.53 - Theta: -0.054 - Premium: $5.20 - Long call (74.0 strike, 2024-05-31): - Delta: 0.8539 - Gamma: 0.0591 - Vega: 2.79 - Theta: -0.051 - Premium: $3.90
Risk & Reward: - Net Premium Received: $1.30 - Maximum Profit: $1.30 - Maximum Loss: $0.70 - Break-even Point: 73.3
Mid-Term Strategy (Expiring 2024-06-21)
For the mid-term option, selling a call with a 75.0 strike price and buying one at 76.0 provides a suitable position: - Short call (75.0 strike, 2024-06-21): - Delta: 0.7078 - Gamma: 0.0586 - Vega: 7.63 - Theta: -0.035 - Premium: $3.90 - Long call (76.0 strike, 2024-06-21): - Delta: 0.8570 - Gamma: 0.0060 - Vega: 6.98 - Theta: -0.032 - Premium: $3.10
Risk & Reward: - Net Premium Received: $0.80 - Maximum Profit: $0.80 - Maximum Loss: $0.20 - Break-even Point: 75.2
Longer-Term Strategy (Expiring 2024-08-16)
For longer-term stability, selling a call with a 60.0 strike price against buying a call at 61.0 can balance profitability and risk: - Short call (60.0 strike, 2024-08-16): - Delta: 0.8669 - Gamma: 0.0101 - Vega: 8.25 - Theta: -0.028 - Premium: $18.10 - Long call (61.0 strike, 2024-08-16): - Delta: 0.9519 - Gamma: 0.008 - Vega: 1.59 - Theta: -0.037 - Premium: $15.20
Risk & Reward: - Net Premium Received: $2.90 - Maximum Profit: $2.90 - Maximum Loss: $6.10 - Break-even Point: 60.29
Longer-Term Strategy (Expiring 2025-01-17)
Considering the longer horizon, selling a call at a 55.0 strike price and buying one with a 60.0 strike price balances profitability: - Short call (55.0 strike, 2025-01-17): - Delta: 0.8507 - Gamma: 0.0069 - Vega: 14.51 - Theta: -0.0096 - Premium: $22.10 - Long call (60.0 strike, 2025-01-17): - Delta: 0.9213 - Gamma: 0.0094 - Vega: 3.2 - Theta: -0.037 - Premium: $19.65
Risk & Reward: - Net Premium Received: $2.45 - Maximum Profit: $2.45 - Maximum Loss: $7.55 - Break-even Point: 55.245
Very Long-Term Strategy (Expiring 2026-01-16)
For a very long-term strategy, selling a call at 45.0 and buying one at 50.0 can offer a good blend of return and risk: - Short call (45.0 strike, 2026-01-16): - Delta: 0.8506 - Gamma: 0.0028 - Vega: 17.5 - Theta: -0.0041 - Premium: $32.91 - Long call (50.0 strike, 2026-01-16): - Delta: 0.8205 - Gamma: 0.0046 - Vega: 22.06 - Theta: -0.0044 - Premium: $31.00
Risk & Reward: - Net Premium Received: $1.91 - Maximum Profit: $1.91 - Maximum Loss: $3.09 - Break-even Point: 45.209
These choices offer a mix of profitability while mitigating the risk associated with short positions being ITM and subsequently requiring share assignments. The delta values ensure that options closer to expiry are less likely to be ITM, lowering the risks of assignment while providing good premium income. Each strategy ensures the trade remains within profitable thresholds while considering the 2% anticipated stock price fluctuation.
Vertical Bull Call Spread Option Strategy
Analysis of Vertical Bull Call Spread Options Strategy for Starbucks Corporation (SBUX)
A vertical bull call spread involves purchasing one call option (long call) and concurrently selling another call option (short call) with a higher strike price but the same expiration date. This strategy profits if the stock price rises sufficiently by the expiration date but lessens the risk of assignment inherent in individual call options.
Our goal is to identify the most profitable vertical bull call spread while minimizing assignment risk. We'll consider a target stock price that is 2% over or under the current stock price. Well assess options across different expiration dates and strikes, emphasizing profitability and reduced risk of assignment.
1. Near-Term Strategy (Expiration: 2024-05-24, Strike: 68/74)
- Long Call: 68 Strike, 2024-05-24 Expiry
- Delta: 0.9541
- Gamma: 0.0150
- Vega: 0.5532
- Theta: -0.1552
- Premium: 8.5
-
Profit: 0.2168
-
Short Call: 74 Strike, 2024-05-24 Expiry
- Delta: 0.9088
- Gamma: 0.0544
- Vega: 0.9436
- Theta: -0.1256
- Premium: 4.1
- Profit: 1.3121
This near-term strategy offers a maximum profit scenario if the stock price rises to the sold call strike of $74. With both options significantly in the money, the risk of assignment is higher; however, the relatively short duration mitigates some risk. The net cost is four dollars, and the maximum gain is reasonably high.
2. Short-Term Strategy (Expiration: 2024-06-07, Strike: 65/74)
- Long Call: 65 Strike, 2024-06-07 Expiry
- Delta: 0.9148
- Gamma: 0.0143
- Vega: 2.5114
- Theta: -0.0531
- Premium: 13.0
-
Profit: 1.4121
-
Short Call: 74 Strike, 2024-06-07 Expiry
- Delta: 0.8088
- Gamma: 0.0574
- Vega: 4.4202
- Theta: -0.0421
- Premium: 4.45
- Profit: 0.9621
For this short-term strategy, purchasing a 65 call and selling a 74 call reduces the risk of assignment due to its longer duration. The inherent time decay (theta) works against the value of the short call. The net cost of $8.55 yields a protective cushion for potential volatility, albeit with a lower profit margin.
3. Medium-Term Strategy (Expiration: 2024-06-14, Strike: 65/75)
- Long Call: 65 Strike, 2024-06-14 Expiry
- Delta: 0.9297
- Gamma: 0.0133
- Vega: 2.5773
- Theta: -0.0298
- Premium: 11.5
-
Profit: 2.9121
-
Short Call: 75 Strike, 2024-06-14 Expiry
- Delta: 0.7308
- Gamma: 0.0647
- Vega: 6.4245
- Theta: -0.0382
- Premium: 3.85
- Profit: 0.5621
Our medium-term strategy enhances profitability by selecting a higher long call strike of 65 and short call strike of 75. While the cost is higher at $7.65, the spread benefits from significant gains if the stock price rises.
4. Long-Term Strategy (Expiration: 2025-01-17, Strike: 60/70)
- Long Call: 60 Strike, 2025-01-17 Expiry
- Delta: 0.8334
- Gamma: 0.0096
- Vega: 14.4570
- Theta: -0.0116
- Premium: 19.65
-
Profit: 3.3668
-
Short Call: 70 Strike, 2025-01-17 Expiry
- Delta: 0.7177
- Gamma: 0.0183
- Vega: 16.3567
- Theta: -0.0103
- Premium: 10.65
- Profit: 4.3668
A long-term strategy with a broader strike range mitigates short-term fluctuations and risk of assignment, making it favorable for passive investors. The primary downside is the increased capital requirement and lower ROI due to time decay (theta).
5. Extended-Term Strategy (Expiration: 2026-06-18, Strike: 55/65)
- Long Call: 55 Strike, 2026-06-18 Expiry
- Delta: 0.7923
- Gamma: 0.0058
- Vega: 25.4374
- Theta: -0.0051
- Premium: 25.0
-
Profit: 3.7168
-
Short Call: 65 Strike, 2026-06-18 Expiry
- Delta: 0.7019
- Gamma: 0.0073
- Vega: 33.7978
- Theta: -0.0078
- Premium: 19.44
- Profit: 8.1568
An extended-term strategy provides stable gains, with long duration diminishing the net premiums' volatility impact. The strike spread and expiration offer justifiable risk-reward considerations for long-term investors.
Conclusion
Among the discussed strategies, each represents a spectrum catering to varying risk appetites and timeframes. For profitability and minimized risk of assignment: - Near-Term (68/74): Higher inherent risk but maximal profitability. - Short-Term (65/74): Moderate risk with justified profitability. - Medium-Term (65/75): Balanced strategy with significant gains. - Long-Term (60/70): Conservative with lower immediate gains. - Extended-Term (55/65): Stable gains suitable for long-term portfolios.
Depending on investment goals, one can select an appropriate strategy. The optimal balance between profitability and assignment risk must align with one's market outlook and risk tolerance.
Spread Option Strategy
To identify the most profitable calendar spread options strategy for Starbucks Corporation (SBUX), let's first recap the strategy specifics. In a calendar spread, we're aiming to take advantage of differences in implied volatility between different expiration dates. Typically, a trader would buy a longer-term call option while selling a shorter-term put option with the same strike price. This strategy profits from the slight time decay of the sold option and volatility adjustments of the bought option.
Given our trade specifics and wanting to minimize the risk of having shares assigned, we'll consider options close-to-the-money, slightly out-of-the-money (OTM), or slightly in-the-money (ITM). We'll aim to balance the premiums received and paid and target a risk/reward profile for our price movement estimate of 2% around the current stock price.
Here are five profitable calendar spread opportunities considering near-term through long-term options:
- Near-Term Option: Expiration May 24, 2024, Strike Price 67
- Buy Call Option: Delta: 0.9728, Gamma: 0.0101, Vega: 0.3599, Theta: -0.0986, Rho: 0.0036, Premium: $5.45, ROI: 1.2774, Profit: $6.9621
- Sell Put Option: Delta: -0.0821, Gamma: 0.0173, Vega: 0.8736, Theta: -0.3318, Rho: -0.0004, Premium: $0.01, ROI: 100%, Profit: $0.01
Analysis: This is a conservative choice where the relatively low premium of the sold put and the strong ROI of the call minimize the risk of assignment while providing a solid profit margin.
- Short to Medium-Term: Expiration May 31, 2024, Strike Price 70
- Buy Call Option: Delta: 0.9091, Gamma: 0.0254, Vega: 1.9873, Theta: -0.0597, Rho: 0.0154, Premium: $8.25, ROI: 0.1408, Profit: $1.1621
- Sell Put Option: Delta: -0.0149, Gamma: 0.0097, Vega: 0.4600, Theta: -0.0080, Rho: -0.0003, Premium: $0.03, ROI: 100%, Profit: $0.03
Analysis: This option exhibits high vega and a respectable profit potential. The sold put's high ROI and low delta further reduce the assignment risk.
- Medium-Term: Expiration June 21, 2024, Strike Price 60
- Buy Call Option: Delta: 0.9213, Gamma: 0.0094, Vega: 3.1999, Theta: -0.0373, Rho: 0.0438, Premium: $15.4, ROI: 0.2605, Profit: $4.0121
- Sell Put Option: Delta: -0.0092, Gamma: 0.0016, Vega: 0.5517, Theta: -0.0063, Rho: -0.0006, Premium: $0.01, ROI: 100%, Profit: $0.01
Analysis: This setup brings higher premiums and robust risk mitigation due to the low delta of the sold put, protecting against the assignment while delivering higher potential profits.
- Long-Term: Expiration January 17, 2025, Strike Price 55
- Buy Call Option: Delta: 0.8670, Gamma: 0.0070, Vega: 12.0956, Theta: -0.0106, Rho: 0.2814, Premium: $22.3, ROI: 0.0947, Profit: $2.1121
- Sell Put Option: Delta: -0.0890, Gamma: 0.0066, Vega: 12.7656, Theta: -0.0044, Rho: -0.0855, Premium: $1.22, ROI: 100%, Profit: $1.22
Analysis: This position supports significant time value capture and vega benefits from the long call. The sold put's stable premium and low assignment risk enhance profitability.
- Ultra Long-Term: Expiration June 18, 2026, Strike Price 90
- Buy Call Option: Delta: 0.6008, Gamma: 0.0139, Vega: 39.5208, Theta: -0.0018, Rho: -1.3517, Premium: $21.8, ROI: 14.2106, Profit: $3.0979
- Sell Put Option: Delta: -0.4022, Gamma: 0.0137, Vega: 41.3871, Theta: -0.0041, Rho: -0.8551, Premium: $11.07, ROI: 66.5574, Profit: $7.3679
Analysis: This positions long call benefits significantly from long volatility exposure. The sold put expiring well into the future with substantial ROI considerably reduces immediate assignment risks and yields considerable potential profit.
In conclusion, these setups illustrate varying degrees of risk and profit potential. The strategy can be tailored based on the volatility outlook and risk appetite. The crucial aspect is balancing the high ROI potential, premium intake, and the minimization of assignment risk, making calendar spreads a viable strategy over different timeframes.
Calendar Spread Option Strategy #1
Analyzing a Calendar Spread Strategy for Starbucks Corporation (SBUX)
A calendar spread involves buying and selling options with the same strike price but different expiration dates. However, the scenario outlined specifies an alternative where we buy a put option and sell a call option at different expiration dates, so the strategy deviates slightly from traditional calendar spreads but retains the fundamental intent of leveraging time decay differences.
Given the constraints and objectives, we need to consider the premium, delta (to minimize assignment risk), theta, and the risk/reward ratio for each put and call option. Here are five promising options combinations spanning various expiration periods, structured to buy a put option and sell a call option on SBUX, with an approximate stock price target 2% above or below the current price.
-
Near-Term Strategy: Expire on 2024-06-07
- Buy Put Option: Strike price at $110, expiring on 2024-06-21. Key metrics include a delta of -0.9976, theta of 0.006998, and premium of $18.4.
- Sell Call Option: Strike price at $100, expiring on 2024-06-07. Key metrics include a delta of 0.0737, theta of -0.0557, vega of 2.2766, and premium of $0.02.
Risk/Reward: - Put Option Profit: The potential profit of the put option can be $12.193. - Call Option Premium: Collecting $0.02 for selling the call. - Risk: The short call's delta is relatively low (0.0737), minimizing assignment risk, but any strong upward movement in the stock price could make this risky. - Reward: The combined reward comes mostly from the bearish bet with the put's potential profitability magnified by the small premium collected from the call.
-
Mid-Term Strategy: Expire on 2024-07-19
- Buy Put Option: Strike price at $140, expiring on 2024-06-21. Key parameters include a delta of -0.997586, theta of 0.01061, and premium of $42.36.
- Sell Call Option: Strike price at $77, expiring on 2024-07-19. Key parameters include a delta of 0.6004, theta of -0.0481, and premium of $2.12.
Risk/Reward: - Put Option Profit: The potential put profit is substantial at $18.23. - Call Option Premium: Collecting a higher premium of $2.12 for the mid-term call. - Risk: The call delta is 0.6004, higher than the previous example, indicating the stock price approaching $77 increases the likelihood of assignment. - Reward: The higher premium and potential put option wide swing against the mid-term stability could balance the strategy.
-
Long-Term Strategy: Expire on 2025-01-17
- Buy Put Option: Strike price at $155, expiring on 2025-01-17. Key parameters include a delta of -0.980854, theta of 0.01264, and premium of $60.75.
- Sell Call Option: Strike price at $70, expiring on 2025-01-17. Key parameters include a delta of 0.9089, theta of -0.05736, and premium of $7.95.
Risk/Reward: - Put Option Profit: High potential profit at $14.84. - Call Option Premium: Collecting a sizeable premium of $7.95 for the long-term call. - Risk: The call options delta is high (0.9089), presenting significant assignment risk if the stock price rises sharply. - Reward: The large premium collected and the substantial delta-holding sell position offer high-objective gains but also pose a higher risk.
-
Extended Strategy: Expire on 2025-06-20
- Buy Put Option: Strike price at $125, expiring on 2025-06-20. Key parameters include a delta of -0.968762, theta of 0.00949, and premium of $43.43.
- Sell Call Option: Strike price at $75, expiring on 2025-06-20. Key parameters include a delta of 0.6081, theta of -0.01191, and premium of $10.75.
Risk/Reward: - Put Option Profit: High anticipated profit at $12.16. - Call Option Premium: Collecting a significant premium of $10.75 for the extended period call. - Risk: The delta of the call is 0.6081, which creates moderate assignment risk. - Reward: This combination leverages higher premiums and potential to capitalize on stock price decline over an extended term.
-
Farthest-Term Strategy: Expire on 2026-01-16
- Buy Put Option: Strike price at $125, expiring on 2026-01-16. Key metrics include a delta of -0.664933, theta of 0.00816, and premium of $35.64.
- Sell Call Option: Strike price at $80, expiring on 2026-01-16. Key parameters include a delta of 0.4508, theta of -0.00957, and premium of $10.8.
Risk/Reward: - Put Option Profit: Predictable profit at $9.953. - Call Option Premium: Collecting the highest call exposure premium at $10.8. - Risk: The delta risk is sustainably low-moderate and balanced across the longer expiration timeline. - Reward: Investing in a long-term, less volatile approach capturing premium along with potential bearish profits.
Conclusion
The strategy involves capturing the temporal price effect differences between a long put and short call. Each combination is calibrated to provide spans across various time maturity structures to diversify risk/reward dynamics. Close attention to delta, theta, and vega across options ensure minimizing assignment risk while enhancing profitability potential based on anticipated stock price behavior around the target moves of 2%. Always consider reviewing contingent market conditions before deploying any sophisticated options strategy and consult accordingly.
Calendar Spread Option Strategy #2
A calendar spread options strategy involves selling a short-dated option and buying a longer-dated option with the same strike price. However, in your unique scenario, you're looking to minimize the risk of share assignment by selling an out-of-the-money put and buying an out-of-the-money call at different expiration dates. Considering the target stock price is within 2% of the current price, its crucial to select options that minimize the risk of shares being assigned.
Proposed Strategy
-
Sell Short-Term Out-of-the-Money Put: Let's evaluate the short-term, out-of-the-money put options to sell. Considering the goal is to avoid share assignment, we target options with a lower delta, as they have a lower probability of expiring in-the-money.
-
Buy Long-Term Out-of-the-Money Call: For the calls, we focus on long-term options, which allow leverage over a more extended period while keeping the premium affordable.
Top Choices for Pairing
Choice 1:
- Sell Put (Short-Term):
- Strike Price: $100
- Expiration: May 24, 2024
- Delta: -0.0001
- Profit Premia: $0.02
- Risk: Minimal risk of assignment due to very low delta.
- Buy Call (Long-Term):
- Strike Price: $100
- Expiration: June 21, 2025
- Delta: 0.038
- Premium: $1.54
- Risk: More significant leverage over a long-term period with substantial upside potential.
Choice 2:
- Sell Put (Short-Term):
- Strike Price: $105
- Expiration: June 7, 2024
- Delta: -0.062
- Profit Premia: $0.06
- Risk: Low risk due to being out-of-the-money with moderate delta.
- Buy Call (Long-Term):
- Strike Price: $105
- Expiration: June 21, 2025
- Delta: 0.196
- Premium: $3.31
- Risk: Balanced risk and reward with appreciation potential over a longer period.
Choice 3:
- Sell Put (Short-Term):
- Strike Price: $95
- Expiration: June 21, 2025
- Delta: -0.04
- Profit Premia: $0.1
- Risk: Low risk due to out-of-the-money status with medium-low delta.
- Buy Call (Long-Term):
- Strike Price: $95
- Expiration: January 17, 2025
- Delta: 0.296
- Premium: $5.5
- Risk: Provides a better position if the stock appreciates over a generous period.
Choice 4:
- Sell Put (Short-Term):
- Strike Price: $110
- Expiration: September 20, 2024
- Delta: -0.069
- Profit Premia: $0.24
- Risk: Slightly higher delta but still out-of-the-money.
- Buy Call (Long-Term):
- Strike Price: $110
- Expiration: June 20, 2026
- Delta: 0.101
- Premium: $0.93
- Risk: More distant expiration allows lower premiums, providing higher returns if stock appreciates.
Choice 5:
- Sell Put (Short-Term):
- Strike Price: $120
- Expiration: June 21, 2025
- Delta: -0.055
- Profit Premia: $0.14
- Risk: Low risk due to out-of-the-money positioning.
- Buy Call (Long-Term):
- Strike Price: $120
- Expiration: January 16, 2026
- Delta: 0.101
- Premium: $0.93
- Risk: Maximizes leverage and minimizes initial premium outlay with substantial upside potential.
Quantified Risk and Reward Analysis
For each combination above, the risk is balanced against minimal premiums on the short put, ensuring low assignment risk. The long-term calls provide ample time for stock appreciation, with high delta indicating substantial reward potential. Overall, the combination focuses on minimizing risk while maximizing leverage and potential profit.
In summary, these options combinations provide a strategic mix of near and long-term expirations and strike prices, balancing the risk of immediate assignment with the potential for significant long-term gated stock gains. This approach provides a disciplined and thoughtful entry into calendar spreads while managing risk effectively.
Similar Companies in Restaurants:
Chipotle Mexican Grill, Inc. (CMG), Report: Domino's Pizza, Inc. (DPZ), Domino's Pizza, Inc. (DPZ), Yum! Brands, Inc. (YUM), The Wendy's Company (WEN), Report: McDonald's Corporation (MCD), McDonald's Corporation (MCD), Wingstop Inc. (WING), Shake Shack Inc. (SHAK), Papa John's International, Inc. (PZZA), Darden Restaurants, Inc. (DRI), Yum China Holdings, Inc. (YUMC), Restaurant Brands International Inc. (QSR), Dunkin' Brands Group, Inc. (DNKN), Jack in the Box Inc. (JACK), Dine Brands Global, Inc. (DIN)
https://www.fool.com/investing/2024/05/14/starbucks-buy-sell-or-hold/
https://www.youtube.com/watch?v=tIrpyjkOn1E
https://www.fool.com/investing/2024/05/15/best-stock-to-buy-now-starbucks-vs-dutch-bros/
https://seekingalpha.com/article/4693642-starbucks-dont-let-short-term-headwinds-overcomplicate-this
https://finance.yahoo.com/video/whats-taking-greatest-toll-consumers-144214883.html
https://www.fool.com/investing/2024/05/18/why-its-time-to-sell-starbucks-and-buy-dutch-bros/
https://finance.yahoo.com/m/8d261e33-88f4-3b0e-8253-f0ce62478ab8/why-it%27s-time-to-sell.html
https://finance.yahoo.com/m/6d9ced32-adcb-3b4b-bbd7-efa0ecda22b9/forget-amazon%3A-these.html
https://finance.yahoo.com/m/376fbbd7-446b-32ab-ba61-4255a8c7455a/as-a-longtime-starbucks.html
https://finance.yahoo.com/m/73b5a942-ee3a-34a7-8aa2-36d8b24949aa/forget-starbucks%3A-buy-stock.html
https://www.cnbc.com/2024/05/20/consumer-pullback-ceos.html
https://www.sec.gov/Archives/edgar/data/829224/000082922424000024/sbux-20240331.htm
Copyright © 2024 Tiny Computers (email@tinycomputers.io)
Report ID: awtzNB
Cost: $0.63407
https://reports.tinycomputers.io/SBUX/SBUX-2024-05-21.html Home