Smartsheet Inc. (ticker: SMAR)
2024-03-06
 Smartsheet Inc. (ticker: SMAR) is a distinguished player in the cloud-based workflow and productivity software arena, providing solutions that enable seamless collaboration and efficient project management for businesses of all sizes. Established with the intent to revolutionize the way organizations plan, track, automate, and report on work, Smartsheet's platform fosters a more dynamic and integrated approach to work management. Its user-friendly interface, coupled with powerful automation and visualization tools, helps teams to streamline operations, improve decision-making, and ultimately boost productivity. The company's growth strategy emphasizes continuous innovation and expansion of its service offerings, as well as strategic partnerships and acquisitions to enhance its capabilities and market reach. As organizations increasingly adopt digital transformation initiatives, Smartsheet's relevance and potential for growth in the project management software market continue to escalate, making it a notable entity in the competitive landscape of cloud computing and SaaS solutions.
| Full Time Employees | 3,370 | Previous Close | 43.5 | Open | 42.47 |
| Day Low | 40.905 | Day High | 42.66 | Beta | 0.747 |
| Forward PE | 43.94681 | Volume | 1,155,856 | Average Volume | 1,286,042 |
| Average Volume 10 Days | 1,240,090 | Market Cap | 5,628,776,448 | 52 Week Low | 37.09 |
| 52 Week High | 52.813 | Price to Sales Trailing 12 Months | 6.1602454 | Fifty Day Average | 45.5622 |
| Two Hundred Day Average | 42.82675 | Current Price | 41.31 | Target High Price | 65.0 |
| Target Low Price | 45.0 | Target Mean Price | 56.32 | Target Median Price | 56.0 |
| Number of Analyst Opinions | 19 | Total Cash | 568,739,008 | Total Cash Per Share | 4.174 |
| EBITDA | -131,291,000 | Total Debt | 53,136,000 | Quick Ratio | 1.235 |
| Current Ratio | 1.321 | Total Revenue | 913,726,016 | Debt to Equity | 9.543 |
| Revenue Per Share | 6.857 | Return on Assets | -0.08454 | Return on Equity | -0.26888 |
| Free Cash Flow | 243,891,120 | Operating Cash Flow | 118,369,000 | Revenue Growth | 0.232 |
| Gross Margins | 0.79789 | EBITDA Margins | -0.14369 | Operating Margins | -0.13629 |
| Sharpe Ratio | -0.0471029496185052 | Sortino Ratio | -0.7457747735000175 |
| Treynor Ratio | -0.014069597714320876 | Calmar Ratio | -0.3000795183614454 |
The analysis of SMAR incorporates a comprehensive review of technical indicators, fundamentals, and balance sheet information, reinforced by the application of financial ratios and performance metrics. Upon examination of the technical data, it becomes evident that a gradual uptick in the On-Balance Volume (OBV) combined with a narrowing MACD histogram suggests accumulating interest and a potential reversal from bearish to bullish sentiment in the near term.
Despite the optimism hinted at by the technical analysis, a holistic interpretation must also consider the fundamentals and balance sheet position of SMAR. A deep dive into the company's financials reveals an ongoing challenge with profitability, illustrated by negative operating and net margins. This raises concerns about the company's current efficacy in managing operational costs and generating profit from its revenues. Nevertheless, the gross margins remain robust, underscored by a value of 0.79789, suggesting SMAR retains a strong control over its cost of goods sold relative to its sales price, which is a positive indicator for potential future profitability.
The strategic review of the company's balance sheet accentuates a solid foundation characterized by a growing tangible book value and a decreasing trend in total debt. The shift in SMAR's capital structure towards less leverage is a reassuring sign for investors, as it implies lower financial risk. The ability to sustain and grow the net tangible assets signifies a steady operational prowess and positions SMAR favorably for long-term growth.
The evaluation of risk-adjusted performance ratios such as the Sharpe, Sortino, Treynor, and Calmar ratios presents a more nuanced understanding of SMAR's investment profile. The negative values across these ratios over the past year suggest that the stock has not adequately compensated investors for the assumed risk. However, these figures should be contextualized within broader market dynamics and specific challenges facing SMAR during the period.
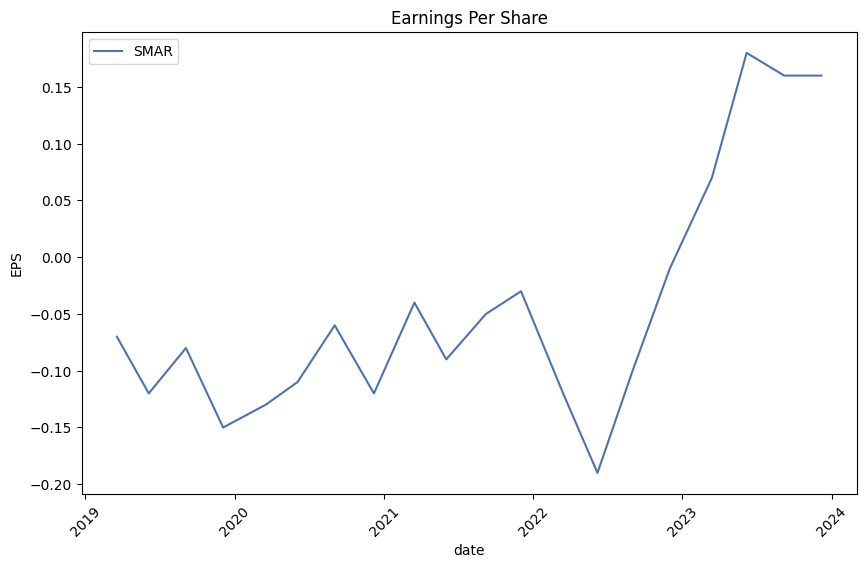
In forecasting the future movement of SMAR's stock price, several forward-looking indicators and analyst expectations offer promising insights. The analysis of earnings estimates indicates a projection of improved profitability, with a significant uptrend noted in the earnings per share (EPS) estimates for the coming year. Analysts' revenue estimates and growth projections further solidify expectations of the company's improved financial performance. This optimistic outlook is bolstered by the anticipated sales growth of 19.40%, underscoring an expected increase in demand for SMAR's offerings.
Conclusively, integrating technical analysis, fundamental assessment, and advanced financial metrics, it appears that SMAR is positioned for a recovery and potential growth in the forthcoming months. Though recent risk-adjusted performance ratios have been less than favorable, the blend of improving debt metrics, solid gross margins, and positive growth estimates provides a strong basis for anticipating an uplift in SMAR's stock price. Investors should remain mindful of the inherent market risks but also consider the strategic progress SMAR is making in boosting its operational and financial health.
In the analysis of Smartsheet Inc. (SMAR) based on the principles outlined in "The Little Book That Still Beats the Market," we examine two essential financial metrics: Return on Capital (ROC) and Earnings Yield. Our assessment reveals a Return on Capital (ROC) of -41.39%. This figure indicates that Smartsheet Inc. is currently experiencing a negative return on the capital it has deployed. In essence, the company is losing money relative to the capital it has invested in its operations, which could raise flags about its efficiency in using investment capital for generating profits. Furthermore, the Earnings Yield for Smartsheet Inc. stands at -4.02%, derived from the company's earnings relative to its share price. This negative yield suggests that the company is not generating positive earnings at the moment, as seen from an investor's viewpoint, which potentially makes it less attractive in terms of immediate investment return. Together, these metrics provide a cautious picture of Smartsheet Inc.'s current financial health and operational efficiency, underlining the importance of careful consideration for investors looking at the company from a value investing perspective.
| Statistic Name | Statistic Value |
| R-squared | 0.243 |
| Adj. R-squared | 0.242 |
| F-statistic | 401.7 |
| Prob (F-statistic) | 9.68e-78 |
| Log-Likelihood | -3208.6 |
| No. Observations | 1,256 |
| AIC | 6421 |
| BIC | 6432 |
| Coef. Intercept (Alpha) | -0.0133 |
| Coef. X (Beta) | 1.3358 |
| Std. Err. of Intercept | 0.088 |
| Std. Err. of X | 0.067 |
| t-value of Intercept | -0.151 |
| t-value of X | 20.043 |
| P>|t| of Intercept | 0.880 |
| P>|t| of X | 0.000 |
| Conf. Int. Low Intercept | -0.186 |
| Conf. Int. High Intercept | 0.159 |
| Conf. Int. Low X | 1.205 |
| Conf. Int. High X | 1.467 |
| Omnibus | 177.442 |
| Prob(Omnibus) | 0.000 |
| Jarque-Bera (JB) | 1877.739 |
| Skew | -0.236 |
| Kurtosis | 8.971 |
| Cond. No. | 1.33 |
In analyzing the relationship between SMAR and SPY for the period ending today, the linear regression model illustrates a moderately telling insight into how SMAR performs in relation to the market's movements, represented by SPY. Notably, the coefficient of determination (R-squared value) at 0.243 indicates that approximately 24.3% of the variability in SMAR's returns can be explained by the fluctuations in the SPY. This depicts a certain level of SMAR's performance variability that aligns with the market trends, albeit not a predominantly strong one. Additionally, with a beta coefficient of 1.3358, SMAR tends to amplify the market's movements, highlighting its conditional volatility relative to broad market swings.
Further dissecting the model's findings, the intercept, or alpha, stands at -0.0133, reflecting the excess return that SMAR is expected to yield when the market's return is zero. This negative value suggests that, independently of the markets performance, SMAR might slightly underperform concerning this specific timeline and the modeled scenario. Moreover, the statistical significance of beta, evident in its t-value of 20.043 and p-value of virtually zero, reinforces its reliability in predicting SMARs sensitivity to market trends. On the other hand, the alpha's lack of statistical significance, indicated by a higher p-value of 0.880, underscores the caution required in interpreting this parameter as a definite metric of performance beyond market movements. This model, therefore, serves as a nuanced lens through which the interconnectedness of SMAR's and the market's performances could be examined, with emphasis on beta's role over alpha in this context.
Smartsheet Inc. hosted its Q3 FY2024 earnings call, highlighting a robust performance exceeding prior guidance. The company reported a 23% year-over-year growth in revenue, reaching $246 million, with billings also witnessing a substantial increase of 22% to $268.5 million. This financial growth was complemented by an impressive non-GAAP operating margin of 8% and a positive free cash flow of $11.4 million. The call, featuring CEO Mark Mader and CFO Pete Godbole, underscored Smartsheet's expanding customer base, which includes significant engagements with Cushman & Wakefield, Cintas Corporation, BeiGene, and CommVault Systems, among others. Particularly notable was the growth in the company's annual recurring revenue (ARR) to $981 million, bolstered by substantial expansions in both small and large customer accounts.
During the call, Mark Mader elaborated on several key customer expansions and product innovations that are driving Smartsheet's growth. The company added 89 customers who expanded their Smartsheet ARR by more than $100,000 and increased its $1 million ARR customer count to 59 from 40 a year ago. Significant deals included a multi-year agreement with a Fortune 500 specialty beverage company and a major airline's upgrade to Smartsheet Advance Platinum, showcasing Smartsheet's value in streamlining complex, impactful projects and consolidating IT spend. Furthermore, the company's adaptability and scalability were exemplified through its role in a quick service restaurant brand's digital transformation and a global media organization's tech stack consolidation, both leading to substantial expansions.
On the product front, Smartsheet's commitment to innovation was evident in the rollout of new capabilities facilitating simpler, self-guided discovery and adoption of its premium offerings by customers. This strategic move has not only enhanced customer autonomy in utilizing Smartsheet's suite of tools but has also begun to generate direct revenue impact, as seen in the trial success with a mid-cap biotech company. Additionally, the company's integration of AI across its platform is set to empower users further, with features such as AI-powered skills in early access testing, demonstrating the potential to significantly streamline enterprise processes.
Looking ahead, Smartsheet's financial outlook remains positive, with Pete Godbole detailing the company's outperformance against guidance and the strategic initiatives in place to sustain growth. Despite acknowledging macro-related pressures particularly affecting high-velocity transactions and SMB segments, the CFO provided a cautious yet optimistic guidance for Q4 FY2024 and the full fiscal year. The call concluded on a forward-looking note, emphasizing continuous investment in product innovation, global expansion, and customer engagement as key drivers for Smartsheet's journey towards crossing the $1 billion ARR milestone and reinforcing its position as a leading enterprise work management platform.
ected due to a rise in interest rates, while floating rate securities may produce less income than expected if interest rates fall. However, because of the short-term nature of our cash equivalents and short-term investments, a 100 basis point change in interest rates would not have a material effect on the fair value of our portfolio or on our interest income. Our investment policy and strategy are focused on preservation of capital and supporting our liquidity requirements.
Foreign currency exchange risk Our reporting currency is the United States dollar ("USD"). We conduct business globally in various foreign currencies, which exposes us to market risk due to changes in foreign currency exchange rates, mainly with the Euro, British Pound, and Australian Dollar. We utilize derivative financial instruments, specifically foreign currency forward contracts, to mitigate the risk of changes in exchange rates on foreign currency-denominated transactions. These foreign currency forward contracts are designated as cash flow hedges of forecasted revenue transactions. The impact of a hypothetical 10% adverse change in foreign currency exchange rates to the USD would not have a material effect on our financial statements due to our practice of balancing our exposure through hedging activities. Nonetheless, sustained volatility in currency exchange rates could impact our financial position and results of operations.
Credit risk We place our cash and cash equivalents and short-term investments with high credit quality financial institutions. Our exposure to credit risk is mainly influenced by the individual characteristics of each financial institution. We regularly assess the creditworthiness of our counterparties. Despite these measures, default or difficulties at one or more of these financial institutions could lead to losses in our cash and cash equivalents and short-term investments, potentially affecting our liquidity.
Inflation The impact of inflation on our cost structure is closely monitored. Costs affected by inflation include employee compensation and benefits, office space leases, and the costs associated with the use of third-party data centers for cloud hosting services. While moderate inflation is typically manageable through regular business adjustments and pricing strategies, sudden or unexpected high inflation rates could have a negative impact on our cost of revenue and operating expenses, potentially affecting our operating margins. However, some contracts allow for passing on increased costs to customers, which could serve to mitigate inflationary pressures.
Overall, we continually assess market risk and take measures to mitigate significant short-term impacts. Our ability to respond to long-term changes in the market remains subject to the evolving nature of the global economic environment, including macroeconomic conditions outlined earlier, such as interest rates, inflation, instability in the global banking sector, and foreign currency exchange rate fluctuations.
Smartsheet Inc., positioned as a leading enterprise work management platform, has continued to make strides in the ever-evolving SaaS landscape. This report delves into the company's strategic growth initiatives, financial performance, market positioning, and future prospects, providing a comprehensive view based on analyses from respected financial insights and articles.
At the core of Smartsheet's offering is its cloud-based platform, designed to enhance work execution across diverse teams and organizations. With an array of tools facilitating project management, automated workflows, and real-time collaboration, Smartsheet has established itself as a critical solution for businesses aiming to improve efficiency and productivity. This ability to optimize operations has driven significant growth in both revenue and user base, capitalizing on the burgeoning demand for cloud-based solutions.
Financially, despite operating at a loss like many of its SaaS counterparts, Smartsheet has demonstrated an impressive revenue growth trajectory. This is indicative of a scalable business model and an increasing market adoption of its platform. The company's financial health is further underscored by a consistent focus on expanding its customer base, refining product offerings, and capturing a larger market shareall considered strategic investments in long-term growth.
Smartsheet's growth strategy is deeply rooted in continuous innovation and market expansion. Substantial investment in research and development has led to the enhancement of its platform with new features, addressing the varied and evolving needs of users. This commitment to innovation not only aids in maintaining a competitive edge but also positions Smartsheet for sustained success in the rapidly changing SaaS industry.
The analysis from articles within Seeking Alpha and Yahoo Finance underscores the market's undervaluation of Smartsheet relative to its growth prospects. Despite a competitive SaaS landscape, Smartsheet's unique value proposition, coupled with solid financial performance and strategic growth efforts, provide a compelling opportunity for investors. The potential for sustained, long-term growth remains significant, with market sentiments yet to fully reflect the company's inherent value.
Smartsheet's strategic maneuvers are evident in its endeavors to expand its customer base and deepen market penetration. Through targeted sales and marketing efforts, aligned with product innovation, the company has been successful in acquiring and retaining users. This includes securing valuable contracts with enterprise customers, thus expanding its influence within the project management software sector.
Moreover, insider purchasing activity signifies a strong belief in the company's future prospects. Such insider actions, especially in thewake of market skepticism, suggest a confidence in Smartsheet's strategic direction and capacity for future earnings growth.
However, recent dips in share price and a measured skepticism from the market hint at challenges. These suggest the importance for investors to stay informed of the company's potential to transition towards profitability and its strategies to enhance shareholder value. An insightful analysis of companys financial health is crucial, taking into account potential warning signs and external factors that might influence Smartsheets sustainability and value delivery.
In comparing Smartsheet with its competitors within the project management software domain, the company's performance is notably robust. With a revenue growth outpacing several peers, Smartsheet showcases its capability to thrive amid economic variances and shifting market demands. This resilience and strategic execution underscore the company's potential for continued operational success and market leadership.
Dorsal Capital Managements investment in Smartsheet signifies a broader interest and belief in the companys growth path. As technology stocks, including those in the project management space, have shown a notable performance, Smartsheet's inclusion in such portfolios highlights its standing as a valuable investment option.
Looking ahead, Smartsheets forthcoming financial results disclosure for the fiscal year 2024 promises to offer deeper insights into its performance and strategic outcomes. The planned communication of financial outcomes, accompanied by an executive conference call, reflects Smartsheets ongoing commitment to transparency and stakeholder engagement. This forthcoming disclosure is keenly awaited by investors and analysts alike, aiming to gauge the companys financial health and operational achievements further.
Furthermore, the evaluation of Smartsheet's stock by Simply Wall St, suggesting a substantial undervaluation, paints a promising picture for the company. The analysis, based on DCF models and growth forecasts, posits Smartsheet as an attractive investment opportunity, albeit with considerations for the inherent risks and market dynamics.
In essence, Smartsheet Inc. embodies the adaptability and resilience necessary for long-term success in the dynamic digital arena. With a solid foundation, continuous strategic growth efforts, and a commitment to innovation, Smartsheet stands well-positioned to navigate the complexities of the market and seize the opportunities for sustained progress.
Smartsheet Inc. (SMAR) exhibited significant volatility between March 8, 2019, and March 5, 2024. The ARCH model, a tool for analyzing and forecasting volatility, indicates the asset's returns experienced considerable fluctuations, as highlighted by the model's parameters. Among these parameters, the "omega" coefficient, related to the baseline volatility when no shocks occur, and the "alpha" which represents the impact of previous returns on current volatility, both suggest a pronounced tendency for variable price movements within this period.
| Statistic Name | Statistic Value |
|---|---|
| Mean Model | Zero Mean |
| Vol Model | ARCH |
| Log-Likelihood | -3372.27 |
| AIC | 6748.54 |
| BIC | 6758.81 |
| No. Observations | 1256 |
| omega | 11.1758 |
| alpha[1] | 0.1357 |
Analyzing the financial risk of investing in Smartsheet Inc. (SMAR) involves a thorough evaluation of the stock's volatility and potential future returns over a one-year period. This complex analysis combines volatility modeling and machine learning predictions to offer a nuanced understanding of investment risks.
Volatility modeling is crucial for understanding how Smartsheet Inc.'s stock price can fluctuate over time. By using this statistical approach, it's possible to analyze past price movements to predict future variability in the stock price. Volatility is a key measure because it reflects the degree of variation of a trading price series over time. This method is particularly adept at capturing the persistence of volatility, a common characteristic in financial time series data. In this instance, the model would analyze historical price changes of SMAR, identifying patterns in the volatility that traditional analysis might overlook. The essence of this approach is to provide a quantifiable measure of risk associated with the stock's price movements, enabling a more informed view of what future volatility might look like.
On the other side of our analysis, machine learning predictions play a substantial role. Here, the focus shifts towards employing algorithms to forecast future returns of Smartsheet Inc.'s stock. Specifically, the implementation of a sophisticated algorithm designed to analyze historical data and identify patterns could predict the stock's future price movements. This prediction is not just based on historical prices but also on the intricate relationships between different market indicators that might affect the stock's performance. The essence of using this method lies in its ability to learn from past data and make educated predictions about the future, taking into account a complex web of factors influencing stock prices.
When combining these two methodologies, an intricate picture of Smartsheet Inc.'s future stock performance begins to emerge. By understanding the expected volatility using volatility modeling and predicting future stock returns through machine learning, it's possible to make a well-informed risk assessment for a potential $10,000 investment in SMAR.
The culmination of this analysis is the calculation of the Value at Risk (VaR) at a 95% confidence interval, which stands at $476.15 for a $10,000 investment in Smartsheet Inc. This figure represents the maximum expected loss over a one-year period with 95% confidence. It serves as a crucial risk management tool, offering clear insight into the maximum loss an investor might expect to encounter, given normal market conditions, based on both the predicted volatility and returns.
Through the integration of volatility modeling and machine learning predictions, this analysis provides a comprehensive view of the potential risks associated with an equity investment in Smartsheet Inc. It leverages the strengths of both methodologies to provide a more complete understanding of not just how the stocks price might fluctuate, but also where it might be headed, allowing for an informed estimation of potential financial exposure.
In analyzing the given options for Smartsheet Inc. (SMAR), we're particularly focusing on call options that may present the most profitable opportunities with respect to the target stock price being set 5% over the current price level. Through a comprehensive review of the Greeks for these options, several noteworthy findings emerge.
Firstly, let's consider the option with a strike price of $30.0 expiring on April 19, 2024. It possesses a delta of 0.924, gamma of 0.0139, vega of 2.0248, theta of -0.02, and rho of 3.1023. The high delta value near 1 indicates that the price of this option is likely to move nearly one-for-one with the stock price, which is significant for short-term strategies as the stock price approaches our target. The relatively low theta suggests that the time decay of this options value is minimal, preserving much of its worth as we approach expiration. Given the premium of $12.0 and a calculated ROI of 0.114625, this option appears appealing because of its substantial leverage with minor time decay, making it quite advantageous if the stock price is expected to rise up to or beyond the target soon.
Next, we scrutinize the option with a strike price of $35.0, also expiring on April 19, 2024. This call has a delta of 0.8277, a higher gamma of 0.0305 compared to previously analyzed options, indicating more significant potential for price movement as the stock price changes. Its vega sits at 3.6184, and it has a theta of -0.0278, showing a slightly higher rate of time decay but compensating with a higher responsiveness to volatility (vega). The rho of 3.1648 points to a good sensitivity to interest rate changes. Priced at a premium of $7.5 with an ROI of 0.1167333333, the combination of its higher rate of ROI and anticipation of potential substantial stock movement makes this an attractive option, particularly for those betting on increased stock volatility and favorable interest rate environments.
Among the longer-term options, the call with a strike price of $25.0 expiring on May 17, 2024, presents an interesting case with a delta of 0.8448, but relatively low gamma of 0.0052, a significant vega of 4.3458, and a high degree of theta of -0.0779 indicating a rapid time decay. This indicates a sensitive option to price movement and volatility but would require a careful strategy due to its faster erosion of time value.
An attractive long-term option is one with a strike price of $25.0 expiring on January 17, 2025. This has a robust delta of 0.8676 and a gamma of 0.0073, indicating a strong price movement correlation with the underlying stock and a modest acceleration of this correlation as the stock moves. Its vega of 8.2336 is notably high, showcasing pronounced sensitivity to volatility, a valuable trait if market volatility is expected to increase. The theta of -0.0117 points to relatively low time decay, preserving value over its longer lifespan. This capability, tied with its significant rho of 13.7591, indicates a pronounced sensitivity to interest rate changes, an important consideration over a longer timeframe. Broadly, its premium of $18.0 and lower ROI of 0.0208611111 could initially seem less appealing, but its characteristics suggest it is poised for gains in a volatile, upward-trending market, making it a strategic long-term option.
In conclusion, the most profitable option strategy hinges heavily on the anticipated movement of SMAR's stock price within the determined timeframe and one's risk tolerance. For aggressive short-term strategies focusing on immediate upward movements and minimal time decay, the April 19, 2024, $30.0 strike call could be the most attractive. Conversely, for those with a longer-term perspective betting on volatility and potentially favorable interest rate shifts, the January 17, 2025, $25.0 option emerges as a strategic choice, balancing high volatility sensitivity and relatively low time decay against its premium cost.
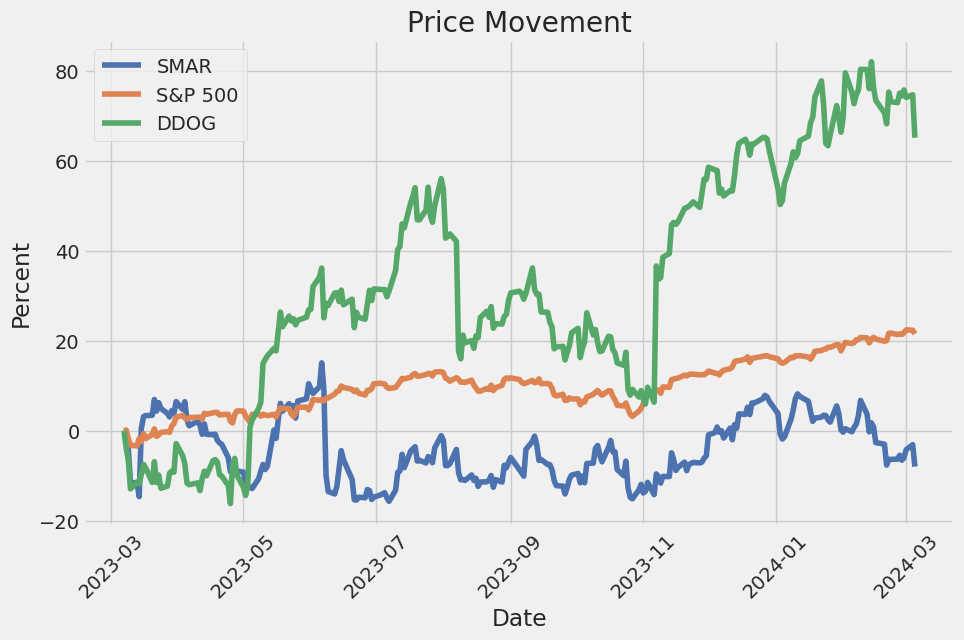
Similar Companies in SoftwareApplication:
Datadog, Inc. (DDOG), monday.com Ltd. (MNDY), HubSpot, Inc. (HUBS), Cadence Design Systems, Inc. (CDNS), PagerDuty, Inc. (PD), Alteryx, Inc. (AYX), Report: GitLab Inc. (GTLB), GitLab Inc. (GTLB), Dynatrace, Inc. (DT), Report: Elastic N.V. (ESTC), Elastic N.V. (ESTC), Amplitude, Inc. (AMPL), Sprinklr, Inc. (CXM), Bill.com Holdings, Inc. (BILL), Asana, Inc. (ASAN), Atlassian Corporation (TEAM), Latch, Inc. (LTCH), Kingsoft Cloud Holdings Limited (KC), Sprout Social, Inc. (SPT), Microsoft Corporation (MSFT), Workiva Inc. (WK), ServiceNow, Inc. (NOW), Salesforce.com, inc. (CRM)
https://seekingalpha.com/article/4664014-smartsheet-a-mispriced-saas-leader
https://finance.yahoo.com/news/while-smartsheet-nyse-smar-shareholders-123115263.html
https://finance.yahoo.com/news/reflecting-project-management-software-stocks-100157515.html
https://seekingalpha.com/article/4665363-smartsheet-stars-aligned-for-major-comeback
https://finance.yahoo.com/news/smartsheet-inc-chief-legal-officer-040204079.html
https://finance.yahoo.com/news/dorsal-capital-partners-sees-13-214437179.html
https://finance.yahoo.com/news/smartsheet-announce-fourth-quarter-full-210600716.html
https://finance.yahoo.com/news/opportunity-smartsheet-inc-nyse-smar-145744431.html
https://www.sec.gov/Archives/edgar/data/1366561/000136656123000141/smar-20231031.htm
Copyright © 2024 Tiny Computers (email@tinycomputers.io)
Report ID: Ilv3BL
Cost: $0.68532
https://reports.tinycomputers.io/SMAR/SMAR-2024-03-06.html Home