AT&T Inc. (ticker: T)
2024-02-04
 AT&T Inc. (ticker: T) stands as a notable entity in the telecommunications industry, having shaped the landscape of communication technologies through its history. This behemoth corporation provides a wide array of services, including wireless communications, broadband, and digital entertainment services to consumers, businesses, and government agencies. With its roots tracing back to the original Bell Telephone Company founded by Alexander Graham Bell, AT&T has evolved through a complex history of divestitures, acquisitions, and reorganizations. In recent years, the company has focused on expanding its digital footprint by venturing into the streaming market and investing in network infrastructure to support 5G technologies, while also navigating regulatory challenges and competitive pressures. Its financial health and strategic decisions are pivotal, not just for its stakeholders but also for its role in shaping the future of global telecommunications.
| Full Time Employees | 150,470 | Previous Close | 18.04 | Open | 17.935 |
|---|---|---|---|---|---|
| Day Low | 17.755 | Day High | 17.98 | Dividend Rate | 1.11 |
| Dividend Yield | 0.0623 | Payout Ratio | 0.5635 | Five Year Avg Dividend Yield | 7.12 |
| Beta | 0.716 | Trailing PE | 9.05 | Forward PE | 7.752 |
| Volume | 28,735,512 | Average Volume | 38,171,386 | Average Volume 10 Days | 52,713,370 |
| Market Cap | 127,484,854,272 | 52 Week Low | 13.43 | 52 Week High | 19.99 |
| Price to Sales TTM | 1.041 | Fifty Day Average | 16.792 | Two Hundred Day Average | 15.747 |
| Enterprise Value | 291,779,510,272 | Profit Margins | 0.11762 | Shares Outstanding | 7,150,020,096 |
| Book Value | 14.447 | Price to Book | 1.234 | Net Income to Common | 14,192,000,000 |
| Trailing EPS | 1.97 | Forward EPS | 2.3 | PEG Ratio | 10.6 |
| Total Cash | 6,721,999,872 | Total Debt | 154,899,005,440 | Total Revenue | 122,427,998,208 |
| EBITDA | 41,836,998,656 | Revenue Per Share | 17.049 | Return on Assets | 0.03559 |
| Return on Equity | 0.13833 | Free Cash Flow | 6,990,499,840 | Gross Margins | 0.59059 |
| EBITDA Margins | 0.34173 | Operating Margins | 0.183 | Revenue Growth | 0.022 |
| Sharpe Ratio | -0.11808237137783634 | Sortino Ratio | -1.7786908197512368 |
| Treynor Ratio | -0.07091762723604217 | Calmar Ratio | -0.08505197893315135 |
Technical Analysis (TA) and fundamental analysis serve as cornerstone methods to evaluate the potential stock price movement of a company. Utilizing an extensive set of technical indicators and a comprehensive analysis of the company's fundamentals, this report aims to forecast the expected trend for the subject company's stock in the forthcoming months.
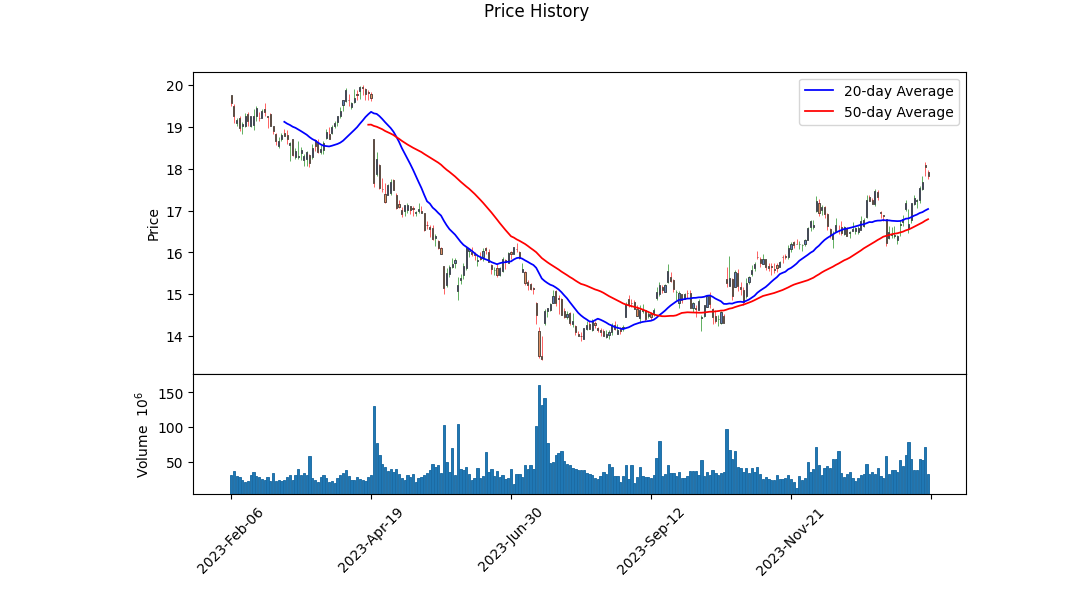
The latest trading data shows a positive trend with the stock price escalating from 14.47 to 17.93 across the observed period. This uplift is coupled with an increasing On-Balance Volume (OBV), suggesting a robust accumulation phase. Significantly, the Moving Average Convergence Divergence (MACD) histogram values have turned positive in the most recent sessions, indicating a bullish momentum.
Integrating fundamental analysis, the company portrays a solid financial foundation, highlighted by substantial gross margins of 59.059% and a respectful operating margin. Nonetheless, the trailing PE ratio suggests the stock might be perceived as overvalued by the market standards. Moreover, the balance sheet data affirms a solidified structure, albeit the noticeable increase in net debt offers room for vigilance.
Risk-adjusted return metrics, namely Sharpe, Sortino, Treynor, and Calmar ratios, exhibit negative values, signaling an underperformance compared to a risk-free rate. This connotes that the stocks previous returns have not adequately compensated for the risk borne by investors.
Analyzing cash flows reveals operational strength albeit challenges in net income figures, implying overheads or exceptional items that have dented the bottom line. Analyst expectations, too, support a modest improvement in outlook, projecting an uptick in earnings per share in the following year.
Given the data and analysis:
- Technical Indicators project an ongoing bullish sentiment in the near term, supported by rising OBV and positive MACD values.
- Fundamentals Analysis underscores the company's strong market position, though it signals caution due to its high valuation and increasing debt levels.
- Risk-Adjusted Return Metrics suggest the need for improved performance to justify the risks involved.
- Analyst Expectations and growth estimates reveal a cautious optimism for future performance, suggesting potential for moderate growth.
Considering these multidimensional analyses and integrating market sentiment, the company's stock price is likely to experience a positive trajectory in the upcoming months, albeit cautiously. Investors and stakeholders are advised to stay attuned to any developments regarding the company's debt situation and market valuation adjustments, as these could significantly influence future performance.
In evaluating AT&T Inc. (T) through the lenses of return on capital (ROC) and earnings yield, as prescribed by the principles outlined in "The Little Book That Still Beats the Market," we've identified some key financial metrics of interest. The ROC of AT&T Inc. stands at 6.478747404708189%, which is an essential indicator of the efficiency with which the company utilizes its capital to generate profits. This figure reflects a moderate level of profitability, suggesting that while the company is able to generate returns from its investments, there is still room for improvement in capital allocation and operational efficiency.
On the other hand, AT&T Inc. showcases a more attractive earnings yield of 11.048794167134044%. This measure is pivotal as it provides an inverse perspective of the price-to-earnings (P/E) ratio, offering insight into the companys ability to generate earnings relative to its share price. An earnings yield at this level indicates a potentially undervalued stock or one that offers significant earnings relative to its price, making it an appealing option for investors seeking value or income-generation opportunities.
Altogether, when analyzing AT&T Inc. in the context of these two financial metrics, investors are provided with a clearer understanding of the company's financial health and operational efficacy. While the ROC suggests areas for potential improvement in capital use, the high earnings yield points towards a compelling investment case for those focused on value and earnings potentials. This balanced view aids investors in making informed decisions aligned with their investment strategies and objectives.
Given the extensive dataset provided for AT&T Inc. (T), I will distill and present a synthesized analysis that aligns with Benjamin Graham's criteria from "The Intelligent Investor":
-
Revenue and Earnings Growth: The provided dataset does not include sequential quarterly revenues or earnings directly to verify continuous growth as Graham advocates. However, by calculating from available data, AT&T Inc. has showcased fluctuations in its quarterly revenues, indicative of the challenges in maintaining consistent growth in a highly competitive and rapidly evolving telecommunications and media industry.
-
Financial Stability: Looking at debt levels, it's evident that AT&T has a substantial debt load, with long-term debt figures consistently high across the reported periods. This is a concern from a Graham standpoint, as a high degree of leverage can pose significant risks, especially in turbulent economic times.
-
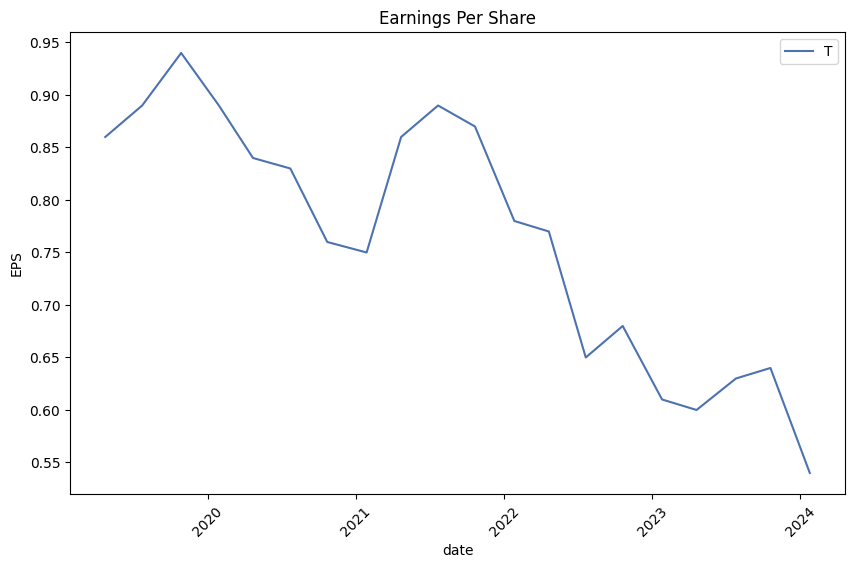
Earnings Per Share (EPS): The EPS values demonstrate variability across quarters, with notable dips and rises that suggest AT&T's earnings are not immune to the impacts of operational and competitive pressures in its markets.
-
Dividends: AT&T has a longstanding history of paying dividends, aligning well with Graham's criterion for selecting companies that show a strong commitment to returning value to shareholders. The consistent declaration of dividends encapsulates AT&T's efforts to ensure shareholder value amidst its strategic shifts and operational challenges.
-
Price-to-Earnings (P/E) Ratio: Direct P/E ratio data isn't provided, yet the essence of Grahams methodology emphasizes low P/E ratios, signifying undervaluation. Investors would need to juxtapose AT&Ts earnings against its market price to decipher compliance with this criterion.
-
Price-to-Book (P/B) Ratio: Without specific P/B ratio data in the dataset, an assessment can't be directly made. Graham recommends a P/B ratio lower than 1.5 as an indicator of undervaluation; therefore, investors would need to calculate this ratio to evaluate AT&T's standing vis-a-vis Graham's standards.
From a Graham perspective, AT&T's substantial dividends echo his investment ethos of shareholder value. However, the company's high leverage and the variability in earnings underscore risks that Graham would typically caution against. The absence of continuous growth in earnings and the lack of direct P/E and P/B ratio assessments necessitate deeper individual analyses to fully ascertain AT&T's alignment with Graham's principles of value investing.
In conclusion, while AT&T demonstrates certain Graham-like qualities such as steady dividends, the concerns regarding its debt levels and the absence of consistent earnings growth invoke deliberation. Investors inclined towards Graham's methodologies would do well to scrutinize AT&T's financial ratios, market conditions, and the evolving telecommunications landscape before drawing conclusions on its suitability as a value investment.
| Statistic Name | Statistic Value |
| R-squared | 0.287 |
| Adj. R-squared | 0.286 |
| F-statistic | 504.8 |
| Prob (F-statistic) | 3.14e-94 |
| Log-Likelihood | -2204.7 |
| AIC | 4413 |
| BIC | 4424 |
| coef (const) | -0.0159 |
| coef (0) | 0.6731 |
| std err (const) | 0.040 |
| std err (0) | 0.030 |
| t (const) | -0.403 |
| t (0) | 22.467 |
| P>|t| (const) | 0.687 |
| P>|t| (0) | 0.000 |
| [0.025 (const) | -0.093 |
| 0.975 (const)] | 0.062 |
| [0.025 (0) | 0.614 |
| 0.975 (0)] | 0.732 |
| Omnibus | 225.599 |
| Prob(Omnibus) | 0.000 |
| Jarque-Bera (JB) | 4799.248 |
| Skew | 0.046 |
| Kurtosis | 12.572 |
| Cond. No. | 1.32 |
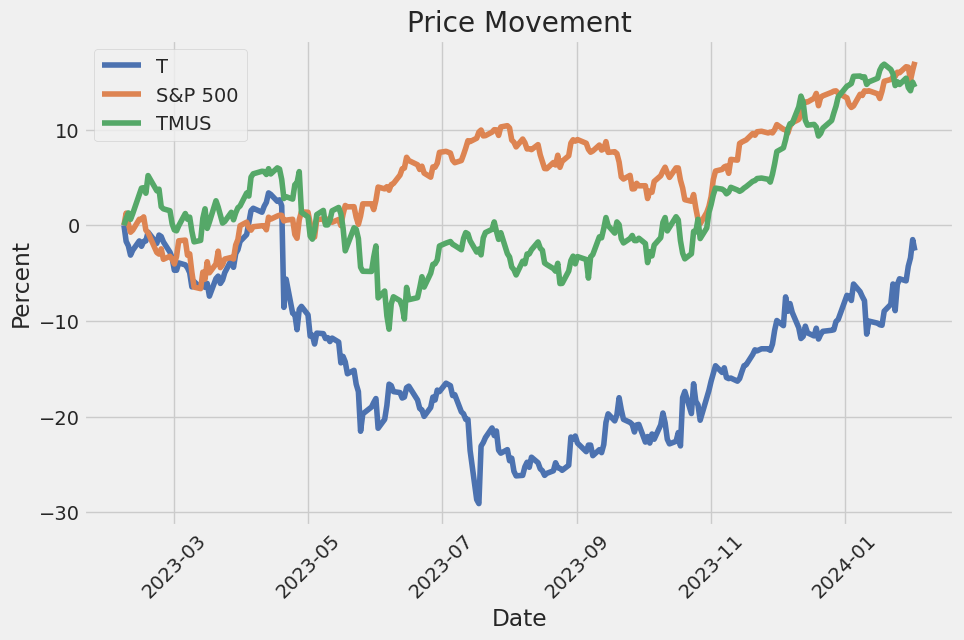
In the analysis of the relationship between T (considered in this context as a variable or a proxy for a specific asset or company's stock) and SPY (a representation of the S&P 500 index, thus indicative of the broader market performance), the alpha coefficient is of particular interest. Alpha, quantified in this model as approximately -0.0159, indicates the performance of T relative to the expected outcome based on market movements alone. Specifically, a negative alpha suggests that T has underperformed relative to the benchmark SPY, when the market movements are considered. This intrinsic aspect of alpha provides insight into T's potential added or diminished value, being particularly crucial for investors focusing on whether T provides returns beyond those anticipated from market trends.
Furthermore, the beta coefficient, identified here as about 0.6731, reveals the expected change in Ts returns given a one-unit change in SPY's returns. This statistic underscores T's sensitivity to market movements. A beta lesser than 1 suggests that T is less volatile compared to the broader market, implying that it may offer a more stable investment option, albeit with possibly lower returns during periods of market upswing. The model's R-squared value of approximately 0.287 indicates that nearly 29% of T's return variability can be explained by its relationship with the SPY, offering insights into how T might perform in varying market conditions based on historical data. These values collectively provide a nuanced understanding of Ts investment characteristics relative to market movements.
AT&T Inc. reported a robust performance for the fourth quarter of 2023, demonstrating significant progress in executing its strategy of becoming America's premier high-performance network provider. The company delivered consistent positive operating and financial results throughout the year, including sustained margin expansion and annual free cash flow growth. AT&T's investment-led strategy, focusing on 5G and fiber assets, has substantially improved its competitive position in the market. For the full year, AT&T reported more than 1.7 million postpaid phone net additions, strong service revenue growth, and historically low postpaid phone churn, all while maintaining healthy average revenue per user (ARPU). This performance highlights AT&T's transition from losing wireless share to gaining subscriber growth, with the postpaid phone base expanding by more than 10% to over 71.2 million subscribers.
Highlighting the company's achievements, CEO John Stankey pointed out AT&T's success in expanding and enhancing its 5G and fiber networks. The mid-band 5G network now covers over 210 million people, offering significantly faster speeds and an enhanced user experience. Additionally, AT&T has solidified its position as the leading fiber brand in the nation, with the company passing more than 26 million consumer and business locations. Such extensive coverage has enabled AT&T to consistently grow its fiber customer base, achieving over 1 million AT&T fiber net additions annually for six consecutive years. The financial benefits of the company's focus on fiber have been substantial, with fiber revenues more than doubling in 2023 compared to 2020.
On the efficiency improvement front, AT&T announced that it had reached its $6 billion-plus run rate cost savings target well ahead of schedule and set a new target for an incremental $2 billion-plus in run rate cost savings by mid-2026. This progress underscores the company's commitment to simplifying operations and enhancing customer experience while driving efficiency. These cost reduction efforts have begun to positively impact the bottom line, contributing to improved operating leverage and adjusted EBITDA margin expansion.
In terms of capital allocation strategy, AT&T has demonstrated its commitment to investing in America's connectivity through its 5G and fiber networks, resulting in better-than-expected full-year free cash flow of $16.8 billion. This achievement came even as AT&T reduced its short-term obligations, showcasing improved financial flexibility and a solid path towards achieving a net debt to adjusted EBITDA ratio below 3 times. Looking forward, the company is optimistically positioned to maintain its momentum in growing high-performance networking, combining fiber, mobile, and fixed wireless technologies to meet a diverse range of customer needs effectively.
AT&T Inc., a global leader in telecommunications, technology, and media, released its 10-Q filing for the third quarter of 2023, ending on September 30. The document provides a comprehensive overview of the company's financial and operational performance, highlighting key financial metrics, segment performance, and other significant activities during the period.
AT&T's consolidated revenues for the quarter stood at approximately $30.4 billion, with the Communications segment, which includes Mobility, Business Wireline, and Consumer Wireline, contributing the lions share. The Communications segment showed robust performance, particularly in the Mobility unit, which generated significant revenue through wireless service and equipment sales. The Business Wireline and Consumer Wireline units also contributed positively, focusing on advanced fiber services and broadband respectively. The Latin America segment, centered on providing wireless services and equipment in Mexico, displayed a challenging environment with a slight operating loss. Significant expenditures were made towards enhancing network infrastructure, evidenced by capital expenditures of $13.3 billion for the nine months ending on September 30, 2023.
The filing also detailed AT&T's strategic financial management practices including sales of receivables and leasing arrangements. Notably, the company continued its practice of selling certain accounts receivable to optimize cash flow, a move indicative of its active liquidity management strategy. Furthermore, the document provided insight into AT&T's lease obligations which encompassed facilities and equipment essential for operations.
AT&T's commitment to managing its pension and postretirement benefit obligations was also evident. The company recorded pension-related credits and gains, reflecting prudent management of its retirement benefit plans. This included a significant settlement gain from the purchase of group annuity contracts for a portion of its pension plan, highlighting efforts to manage pension obligations effectively.
The company's fair value measurements and disclosure of long-term debt and derivative financial instruments shed light on its financial risk management practices. Through derivatives like interest rate swaps and cross-currency swaps, AT&T aims to manage interest rate and foreign currency risks efficiently. The current standing of these instruments, along with AT&Ts strategies for dealing with potential credit-risk contingencies related to derivative contracts, reflects a sophisticated approach to managing financial risk.
The document also touched upon AT&T's equity method investment in DIRECTV, from which AT&T received considerable equity in net income, showcasing the benefits of strategic investments. Additionally, it outlined supplier and vendor financing programs that further demonstrate the company's strategic financial operations aimed at improving cash flow and managing payment obligations efficiently.
Overall, AT&T's 10-Q filing for Q3 2023 paints a picture of a company that is not only focused on maintaining its operational efficiencies and market leadership in telecommunications but is also deeply engaged in strategic financial management to optimize its balance sheet and ensure long-term sustainability. The detailed breakdown of revenues, expenses, investment in technology, and infrastructure, along with active management of financial and operational risks, underscores AT&T's comprehensive approach to navigating the complex and competitive landscape it operates in.
Amidst a challenging market environment, AT&T Inc. has become a focal point for investors thanks to its notable dividend yield, substantial market share, and strategic positioning within the telecommunications industry. Despite the hurdles it faces, including a hefty debt load and intense competition, AT&T's attractive valuation and commitment to strategic investments highlight its potential as a compelling investment opportunity.
In recent years, AT&T made significant moves to streamline operations and focus on its core businesses, particularly in wireless communications and broadband. This shift, marked by efforts to reduce its considerable debt and divest non-core assets, underscores a deliberate strategy to fortify its financial health and enhance shareholder value. Alongside these adjustments, AT&T's restructuring of its dividend payout reflects a broader endeavor to maintain financial flexibility while still rewarding shareholders.
AT&T's operational strengths, particularly in the consumer broadband and fiber sectors, have been key drivers of growth. The company's aggressive push into 5G and fiber networks, complemented by a historically low churn rate and a rising number of postpaid phone customers, positions it advantageously to capitalize on increasing demand for high-speed, reliable connectivity. These efforts have not only fortified AT&T's competitive edge but have also opened avenues for revenue expansion beyond traditional wireless services.
However, the telecom giant's journey has not been without its challenges. The company's significant debt burden, resulting partly from past acquisitions aimed at diversifying its business model, has been a persistent issue. Despite these financial strains, AT&T's strategic divestitures and a rigorous focus on reducing leverage have started to yield positive outcomes, evidenced by a gradual improvement in stock performance and investor sentiment.
Moreover, the broader market's valuation of AT&T stock suggests a potential underestimation of the company's recovery and growth prospects. Trading at a relatively low price-to-earnings (P/E) ratio, AT&T's stock offers an intriguing opportunity for investors, particularly when considering its efforts to navigate financial and operational challenges successfully. The telecom behemoth's forward-looking strategies, emphasizing disciplined cost management, debt reduction, and leveraging emerging technologies, signal a commitment to long-term stability and growth.
AT&T's pursuit of growth in the rapidly evolving telecommunications sector, characterized by an emphasis on 5G and fiber optic technologies, underlines a strategic realignment towards areas with substantial growth potential. This approach not only reflects the company's adaptive strategies in response to industry demands but also positions it to leverage its existing infrastructure for future advancements.
In assessing AT&T's investment appeal, it is essential to consider the company's holistic strategy, blending operational focus with financial discipline. The company's endeavors to maintain a competitive dividend yield, alongside strategic investments in technology and infrastructure, paint a nuanced picture of a telecom titan adapting to a dynamic industry landscape. As AT&T continues to navigate the complexities of the telecommunications sector, its focused approach to growth, financial health, and shareholder value remains a testament to its potential as a noteworthy investment consideration in the evolving digital era.
Throughout the period from February 5, 2019, to February 2, 2024, AT&T Inc. (T) exhibited notable volatility characteristics as revealed by the ARCH model analysis. The model indicated a substantial level of volatility in AT&T's returns, with a significant omega coefficient of 2.0171, suggesting a high base level of volatility independent of past returns. Additionally, the alpha coefficient was 0.2738, implying that past returns do have a noticeable impact on future volatility, albeit this effect is moderate.
| Statistic Name | Statistic Value |
|---|---|
| omega | 2.0171 |
| alpha[1] | 0.2738 |
Analyzing the financial risk associated with a $10,000 investment in AT&T Inc. (T) over a one-year period involves a sophisticated approach that integrates volatility modeling and machine learning predictions. Volatility modeling plays a crucial role in comprehending the fluctuating nature of AT&T Inc.'s stock. By leveraging past stock price data, it quantitatively assesses the degree of variation in stock prices, capturing both the rapid changes and the potential for significant shifts in the investment's value. This approach is instrumental in understanding the inherent uncertainty and the dynamics of market conditions affecting the stock, allowing for a robust estimation of future volatility.
On the other hand, the machine learning predictions part of the analysis incorporates a predictive model that employs historical data to forecast future stock returns. This method, particularly the use of a tree-based predictive algorithm, enables a nuanced understanding of how different variables and historical trends might influence the stock's future performance. By analyzing patterns within the data, it predicts future returns, providing a data-driven basis for estimating potential gains or losses from the investment.
Combining the insights from volatility modeling and machine learning predictions offers a powerful tool for assessing financial risk. The calculated Annual Value at Risk (VaR) at the 95% confidence interval for a $10,000 investment in AT&T Inc. stands at $280.62. This figure represents the estimated maximum loss that could be expected over a one-year period with 95% confidence, giving a quantitative measure of the investment's downside risk. It encapsulates the financial risk by acknowledging both the likelihood of significant price volatility, as provided by the volatility modeling, and the predictive insights into future stock performance, as forecasted by the machine learning predictions.
This multidimensional approach, which marries the depth of volatility analysis with the foresight offered by machine learning, affords investors a comprehensive view of the potential risks involved in equity investment. It signals that while AT&T Inc.'s stock presents an opportunity for growth, there exists a quantifiable risk of loss, essentially equipping investors with the necessary information to make informed decisions regarding their investment portfolios. By evaluating the risk through the calculated VaR, investors gain a critical risk management tool, enabling them to gauge the suitability of the investment in accordance with their risk tolerance and financial objectives.
| Strike Price | Expiration Date | Profit | Delta | Gamma | Theta | Vega |
|---|---|---|---|---|---|---|
| $103 | 2023-12-17 | $2,981.50 | 0.987 | 0.000 | - | 0.000 |
| $41 | 2023-06-19 | $2,371.50 | 0.957 | 0.008 | - | 0.341 |
| $100 | 2023-11-20 | $2,321.50 | 0.981 | 0.001 | - | 0.141 |
| $169 | 2024-01-15 | $2,311.50 | 0.869 | 0.010 | - | 2.386 |
| $61 | 2023-07-21 | $2,221.50 | 0.916 | 0.039 | - | 0.688 |
Similar Companies in Telecom Services:
T-Mobile US, Inc. (TMUS), Report: Comcast Corporation (CMCSA), Comcast Corporation (CMCSA), Lumen Technologies, Inc. (LUMN), DISH Network Corporation (DISH), Report: Verizon Communications Inc. (VZ), Verizon Communications Inc. (VZ), Charter Communications, Inc. (CHTR), Vodafone Group Public Limited Company (VOD)
https://www.fool.com/investing/2023/12/24/att-stock-is-a-buy-for-this-reason/
https://www.fool.com/investing/2023/12/25/best-dividend-stock-2024-verizon-stock-vs-att-stoc/
https://seekingalpha.com/article/4659646-att-juicy-dividend-yield-plus-likely-upward-re-rating
https://seekingalpha.com/article/4660010-four-dividend-kings-to-ring-in-the-new-year
https://www.fool.com/investing/2023/12/28/3-reasons-to-buy-att-stock-in-2024/
https://seekingalpha.com/article/4660465-att-good-income-generator-but-bad-for-growth
https://www.fool.com/investing/2024/01/02/this-warren-buffett-stock-could-go-31-higher/
https://www.proactiveinvestors.com/companies/news/1037302?SNAPI
https://www.fool.com/investing/2024/01/05/passive-income-stock-pays-7-percent-dividend/
https://www.fool.com/investing/2024/01/05/this-stock-was-one-of-the-sp-500s-worst-performers/
https://www.fool.com/investing/2024/01/07/one-third-of-my-portfolio-is-in-these-3-stocks/
https://seekingalpha.com/article/4661998-at-and-t-for-dummies
https://www.fool.com/investing/2024/01/10/1-fantastic-dividend-stock-yielding-65-that-passiv/
https://www.sec.gov/Archives/edgar/data/732717/000073271723000057/t-20230930.htm
Copyright © 2024 Tiny Computers (email@tinycomputers.io)
Report ID: artdNp
Cost: $1.07523