TIM S.A. (ticker: TIMB)
2024-02-04
 TIM S.A., operating under the ticker symbol TIMB, represents a notable player in the telecommunications sector, specifically within the South American market. As a subsidiary of Telecom Italia, TIM S.A. has established a significant presence in Brazil, where it has become one of the leading mobile telecommunications service providers. The company offers a wide range of services including mobile and fixed broadband, voice, and data services to both consumer and business segments. Over the years, TIM S.A. has embarked on various strategic initiatives aimed at expanding its network infrastructure, enhancing service quality, and fostering innovation in digital services. These endeavors have not only contributed to its competitive stance in the market but have also underscored its commitment to technological advancement and customer satisfaction. Financially, TIM S.A. has shown resilience and adaptability amidst the challenges posed by market dynamics and regulatory changes, displaying a robust financial performance that reflects its operational efficiencies and strategic foresight.
| Full Time Employees | 9,253 | Previous Close | 18.04 | Open | 17.88 |
|---|---|---|---|---|---|
| Day Low | 17.71 | Day High | 17.91 | Dividend Rate | 0.68 |
| Dividend Yield | 0.0379 | Payout Ratio | 0.882 | Five Year Avg Dividend Yield | 3.2 |
| Beta | 0.446 | Trailing PE | 18.57 | Forward PE | 13.51 |
| Volume | 265,219 | Average Volume | 453,729 | Average Volume 10 Days | 378,740 |
| Bid | 17.75 | Ask | 18.82 | Market Cap | 8,632,252,416 |
| Fifty Two Week Low | 10.2 | Fifty Two Week High | 18.94 | Price to Sales Trailing 12 Months | 0.369 |
| Fifty Day Average | 17.9134 | Two Hundred Day Average | 15.6988 | Trailing Annual Dividend Rate | 0.188 |
| Trailing Annual Dividend Yield | 0.01042 | Enterprise Value | 55,551,152,128 | Profit Margins | 0.09807 |
| Shares Outstanding | 484,120,000 | Shares Short | 1,402,594 | Shares Percent Shares Out | 0.0031 |
| Held Percent Institutions | 0.03264 | Book Value | 10.715 | Price to Book | 1.664 |
| Net Income to Common | 2,293,101,056 | Trailing EPS | 0.96 | Forward EPS | 1.32 |
| Peg Ratio | 0.6 | Enterprise To Revenue | 2.376 | Enterprise To Ebitda | 7.86 |
| Total Cash | 4,446,238,208 | Total Debt | 17,442,826,240 | Total Revenue | 23,383,099,392 |
| Revenue Per Share | 48.305 | Return on Assets | 0.04875 | Return on Equity | 0.09016 |
| Sharpe Ratio | 2.158406665691357 | Sortino Ratio | 37.56330595183147 |
| Treynor Ratio | 1.0496362063794085 | Calmar Ratio | 9.55792873250013 |
Based on a comprehensive review of the technical indicators, company fundamentals, balance sheets, cash flows, analyst expectations, and various risk-adjusted performance metrics provided, it's possible to derive an informed perspective on the anticipated movement of TIMB's stock price over the coming months.
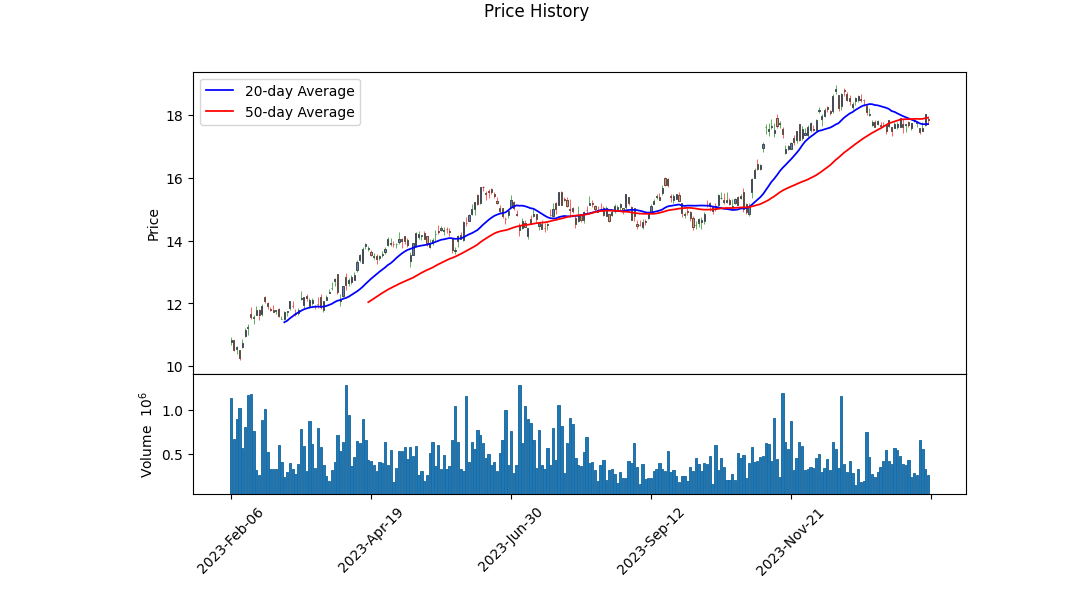
Technical Analysis summary indicates a notably increasing trend in the stock price from an open of $14.63 to a closing around $17.88 over the analyzed period. The positive momentum is confirmed by an ascending OBV (On Balance Volume) indicating healthy buying pressure. However, the presence of a MACD (Moving Average Convergence Divergence) histogram fluctuating near zero towards the end, albeit slightly positive, suggests a potential slowdown in the momentum or consolidation phase.
The fundamentals of the company provide a stronger context for the technical analysis. The company exhibits substantial gross margins at 51.022% and operating margins standing at 20.556%, indicating efficient management and a solid competitive edge in its operations. The EBITDA margins at 30.224% also underline a strong profitability aspect of the company. Additionally, the trailing Peg Ratio at 0.5875, significantly lower than the industry average, may suggest the stock is undervalued based on its growth rate, offering an attractive investment opportunity.
Analyzing the risk-adjusted performance metrics, the Sharpe, Sortino, Treynor, and Calmar ratios deliver remarkable insights into the stock's performance relative to its risks. The high Sortino ratio of 37.56330595183147, in particular, signals that the stock offers significant returns while effectively managing downside volatility, a crucial factor for investors focusing on risk-adjusted outcomes. The attractive Calmar ratio further emphasizes the stock's ability to maintain performance amidst drawdowns.
Considering the financial health demonstrated in Summary of Balance Sheets and the positive trend in Cash Flows, with a notable increase in Operating Cash Flow over the past years, TIMB appears to be in a decent financial position. The reported growth in Free Cash Flow (FCF) underlines the companys capacity for value generation and reinvestment potential.
In conjunction with the positive EPS revisions and the Earnings History showing consistent outperformance against estimates, there's a clear trend of upward adjustments in expectations from analysts. The 'Growth Estimates' segment points towards robust short-to-mid term growth prospects with a significant improvement expected in the upcoming quarters.
Given these aspects, it is quite plausible that TIMB's stock will continue its upward trajectory in the next few months, albeit with periodic consolidations. The robust gross and operating margins, alongside solid growth estimates, underpin a strong fundamental outlook. Coupled with promising technical indicators and exceedingly positive risk-adjusted performance metrics, there's a strong case for continued bullish momentum. Investors should, however, remain cognizant of market-wide influences or sector-specific risks that could impact this outlook.
In the assessment of TIM S.A. (TIMB) using the principles outlined in "The Little Book That Still Beats the Market," two critical financial metrics have been calculated: the Return on Capital (ROC) and the Earnings Yield. The ROC for TIM S.A. stands at 8.36%, which represents the efficiency with which the company employs its capital to generate profits. Although a figure closer to or above 10% is often sought after based on the books criteria, an 8.36% ROC still indicates a respectable level of operational efficiency within the company. On the other hand, the Earnings Yield for TIM S.A. is notably high at 19.35%, indicating that the company's shares potentially offer a high return relative to their price. This high earnings yield is an attractive feature, suggesting that the company is undervalued or is generating substantial profits relative to its share price, hence presenting a potentially lucrative investment opportunity. In the context of Joel Greenblatt's magic formula investing, which balances these two metrics, TIM S.A. displays a strong case, particularly due to its impressive earnings yield, despite its slightly lower ROC.
Based on the key metrics and criteria outlined by Benjamin Graham in "The Intelligent Investor," let's evaluate TIM S.A. (TIMB) to determine its suitability as a value investment.
1. Price-to-Earnings (P/E) Ratio: The P/E ratio for TIM S.A. is approximately 4.01. According to Graham's criteria, a low P/E ratio could indicate that the stock is potentially undervalued relative to its earnings. TIMB's P/E ratio is significantly lower than many industry averages, suggesting it may offer a margin of safety for investors looking for value opportunities.
2. Price-to-Book (P/B) Ratio: TIMB's P/B ratio is approximately 0.15, indicating that the stock is trading at a significant discount to the book value of its assets. Graham often looked for companies trading below their book value as this can provide a cushion against market volatility or poor company performance.
3. Debt-to-Equity Ratio: With a debt-to-equity ratio of around 0.70, TIM S.A. demonstrates a reasonable amount of leverage. Graham preferred companies with low debt-to-equity ratios to mitigate financial risk. While not exceedingly low, TIMB's ratio suggests a sustainable level of debt relative to equity.
4. Dividend Record: TIM S.A. has a consistent history of paying dividends, as shown by the dividend payments listed. Graham favored companies with a strong record of returning value to shareholders. The ongoing commitment to dividends can be a positive signal for investors seeking income in addition to capital appreciation.
5. Earnings Growth: While the provided data does not explicitly detail earnings growth, the history of dividend payments might imply stable or growing earnings, given that dividends are typically paid from profits.
6. Current and Quick Ratios: TIMB's current and quick ratios are both approximately 0.79, indicating its ability to cover short-term liabilities with short-term assets is slightly below Graham's preferable standards. This could be a point of caution for value investors focused on short-term liquidity.
7. Financial Statement Analysis: Detailed analysis of TIM S.A.'s financial statements would be necessary to thoroughly assess the company's long-term prospects, asset quality, earnings stability, and potential for growth all crucial factors in Graham's investment philosophy.
Conclusion: TIM S.A. (TIMB) exhibits several characteristics of a potential value investment according to Benjamin Graham's criteria, such as a low P/E and P/B ratio, a strong dividend record, and reasonable financial leverage. However, its liquidity ratios suggest a closer review of its short-term financial health may be warranted. Investors interested in following Graham's principles should conduct a comprehensive analysis, considering both the financial metrics and the qualitative aspects of the company's operations and industry position.
It's important also to consider that market conditions, industry dynamics, and company-specific factors evolve, so investors should use Graham's criteria as part of a holistic analysis rather than as sole determinants of investment decisions.
| Statistic Name | Statistic Value |
| R-squared | 0.206 |
| Adj. R-squared | 0.205 |
| F-statistic | 325.3 |
| Prob (F-statistic) | 7.77e-65 |
| Log-Likelihood | -2743.5 |
| AIC | 5491 |
| BIC | 5501 |
| coef (const) | -0.0010 |
| coef (beta) | 0.8310 |
| std err | 0.046 |
| t | 18.036 |
| P>|t| | 0.000 |
| [0.025 | 0.741 |
| 0.975] | 0.921 |
| Omnibus | 125.666 |
| Prob(Omnibus) | 0.000 |
| Jarque-Bera (JB) | 909.085 |
| Prob(JB) | 3.93e-198 |
| Skew | -0.003 |
| Kurtosis | 7.168 |
| Cond. No. | 1.32 |
| Alpha | -0.0009741127787108346 |
| Beta | 0.8309793658829846 |
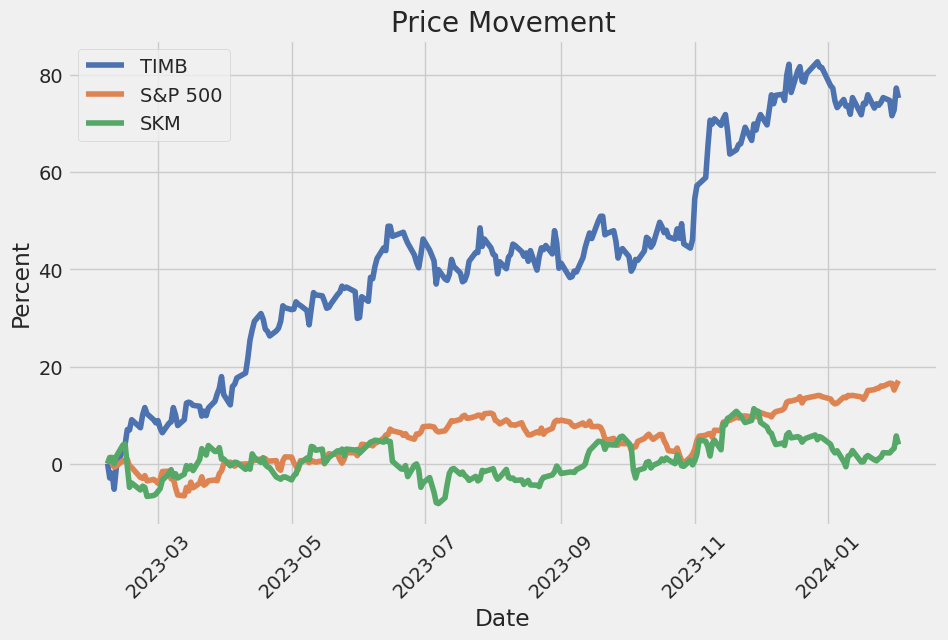
The linear regression analysis illustrates the relationship between TIMB and SPY, offering insights into how movements in the broader market (represented by SPY) relate to the performance of TIMB. Notably, the model reveals a beta coefficient (0.8310) signifying a positive relationship between the movements in SPY and TIMB. However, the alpha value (-0.0009741127787108346) suggests that TIMB, on average, slightly underperforms the market after adjusting for risk. This alpha figure is particularly significant as it represents the portion of returns unexplained by the market's fluctuations, suggesting that TIMB's unique factors lead to a minor underperformance relative to the market trend.
Additionally, the model's R-squared value of 0.206 indicates that approximately 20.6% of TIMB's variance is predictable from SPY's movements. Despite the relatively low R-squared, which signals that a significant portion of TIMB's performance is influenced by factors beyond SPY's movements, the model's F-statistic and its associated probability (Prob (F-statistic) = 7.77e-65) demonstrate the statistical significance of the overall model. Thus, while TIMB does show some sensitivity to market movements as indicated by a positive beta, the alpha and other statistics underscore a nuanced relationship with the broader market, characterized by a slight underperformance and considerations beyond mere market exposure.
TIM S.A., in its 2023 Second Quarter Earnings Call, underlined a period of exceptional financial and operational performance. CEO Alberto Griselli articulated the company's success in executing its strategic plan, leading to a significant year-over-year growth with more than 9% increase in top-line revenue and an EBITDA growth exceeding 17%. This remarkable growth trajectory led to a margin expansion of over 300 basis points. The company also witnessed an impressive operational trend, with key performance indicators such as ARPU, churn, and network quality experiencing their best performances in years, indicating a strong operational foundation supporting the financial success.
The company's commitment to ESG principles played a pivotal role in its strategy, earning recognition for its workplace environment and inclusivity. TIM SA embarked on initiatives aimed at reducing energy consumption through the development of smart public lighting solutions and converting its energy sources to renewable ones. The operator has also made strides in community outreach and digital inclusion, with projects like TimAgro bringing connectivity to rural areas and educational initiatives reaching numerous beneficiaries. These efforts showcase TIM's commitment to integrating ESG principles into its business model while maintaining strong operational and financial performance.
Griselli highlighted the company's revenue dynamics, with a significant contribution from mobile services that saw growth of 9.7%. TIM SA's strategy emphasized network quality, service excellence, and innovative partnerships, such as the launch of the Apple One bundle, positioning the company as a leader in mobile ARPU in Brazil across prepaid, postpaid, and blended categories. The focus on a value proposition characterized by excellence and innovation has paid dividends, leading to robust growth in revenues and ARPU, and achieving a low churn rate.
The financial briefing, escorted by Chief Financial Officer Andrea Viegas, revealed a solid operational and financial performance with double-digit EBITDA growth and a significant expansion in margins, reinforcing the company's strong financial health. The successful integration of M&A activities, coupled with a focus on operational efficiency and cost reduction initiatives like decommissioning processes, has put the company in an advantageous position. The net income more than doubled compared to the second quarter of 2022, and the operational improvements have laid down a strong foundation for sustainable growth.
TIM S.A.'s 2023 second quarter showcased a company that's thriving both operationally and financially, underpinned by a strategic alignment towards sustainable practices, innovation, and customer-centric initiatives. The leadership expressed optimism about maintaining this growth trajectory and continuing to refine its competitive edge in the telecom industry.
TIM S.A., formerly known as Telecom Italia Mobile, is a significant player in the Brazilian telecommunications sector. Its journey began as part of the global expansion of the Telecom Italia Group, aiming to extend its footprint beyond Italy. Over the years, TIM S.A. has evolved, adapting to the rapidly changing telecommunications landscape, positioning itself as a leading mobile network operator in Brazil. The company, publicly traded and part of major stock indexes, has attracted attention from investors worldwide due to its strategic importance in the telecommunications infrastructure of South America's largest economy.
The commitment of TIM S.A. to expanding its network and improving service quality is evident in its investments in technology and infrastructure. The advent of 5G technology has opened new horizons for telecom operators, and TIM S.A. has been at the forefront of this transformation in Brazil. The company's proactive approach in participating in 5G spectrum auctions and its collaboration with equipment suppliers and technology partners underscore its ambition to lead the 5G revolution in Brazil. This ambition is not just about enhancing mobile internet speeds for consumers but is also about enabling a wide array of IoT (Internet of Things) applications, which have the potential to revolutionize various sectors, including agriculture, manufacturing, and smart cities.
Financially, TIM S.A. has shown resilience and adaptability. Despite the challenges posed by market fluctuations and regulatory changes, the company has managed to maintain healthy financial metrics. Its revenue streams are diversified, with a significant portion coming from mobile services, and an increasing contribution from fixed broadband and corporate services. The financial health of TIM S.A. is crucial not only for its sustainability and growth prospects but also for dividend-seeking investors who view it as a reliable source of income.
One of the strategic moves by TIM S.A. has been its focus on customer satisfaction and digital transformation. Recognizing the shift in customer behavior, with an increased preference for digital channels, TIM S.A. has invested in digitalizing its customer service and sales platforms. This digital-first approach has enabled it to offer a seamless customer experience, resulting in improved customer loyalty and attracting new subscribers. Moreover, by leveraging big data and AI, TIM S.A. is enhancing its network operations and personalized marketing, thereby increasing its competitive edge in the market.
In the realm of partnerships and mergers, TIM S.A. has shown openness to collaborations that enhance its market presence and service offerings. Its strategy involves not just organic growth but also exploring strategic alliances and synergies with other players in the telecommunications and technology sectors. These partnerships have allowed TIM S.A. to expand its service portfolio, entering new markets and offering innovative solutions that meet the evolving needs of its customers.
Environmental, Social, and Governance (ESG) factors have become increasingly important for companies globally, and TIM S.A. is no exception. The company has integrated ESG principles into its operations, focusing on reducing its environmental footprint, promoting digital inclusion, and ensuring ethical governance practices. These efforts not only contribute to societal goals but also enhance the company's reputation among consumers and investors who prioritize sustainability.
In conclusion, TIM S.A. stands out as a dynamic and forward-thinking company in the Brazilian telecommunications sector. Its focus on 5G technology, financial stability, customer satisfaction, strategic partnerships, and ESG principles positions it well for future growth. As the telecommunications landscape continues to evolve, TIM S.A.'s adaptability and strategic initiatives will be key to its sustained success and competitiveness in the market.
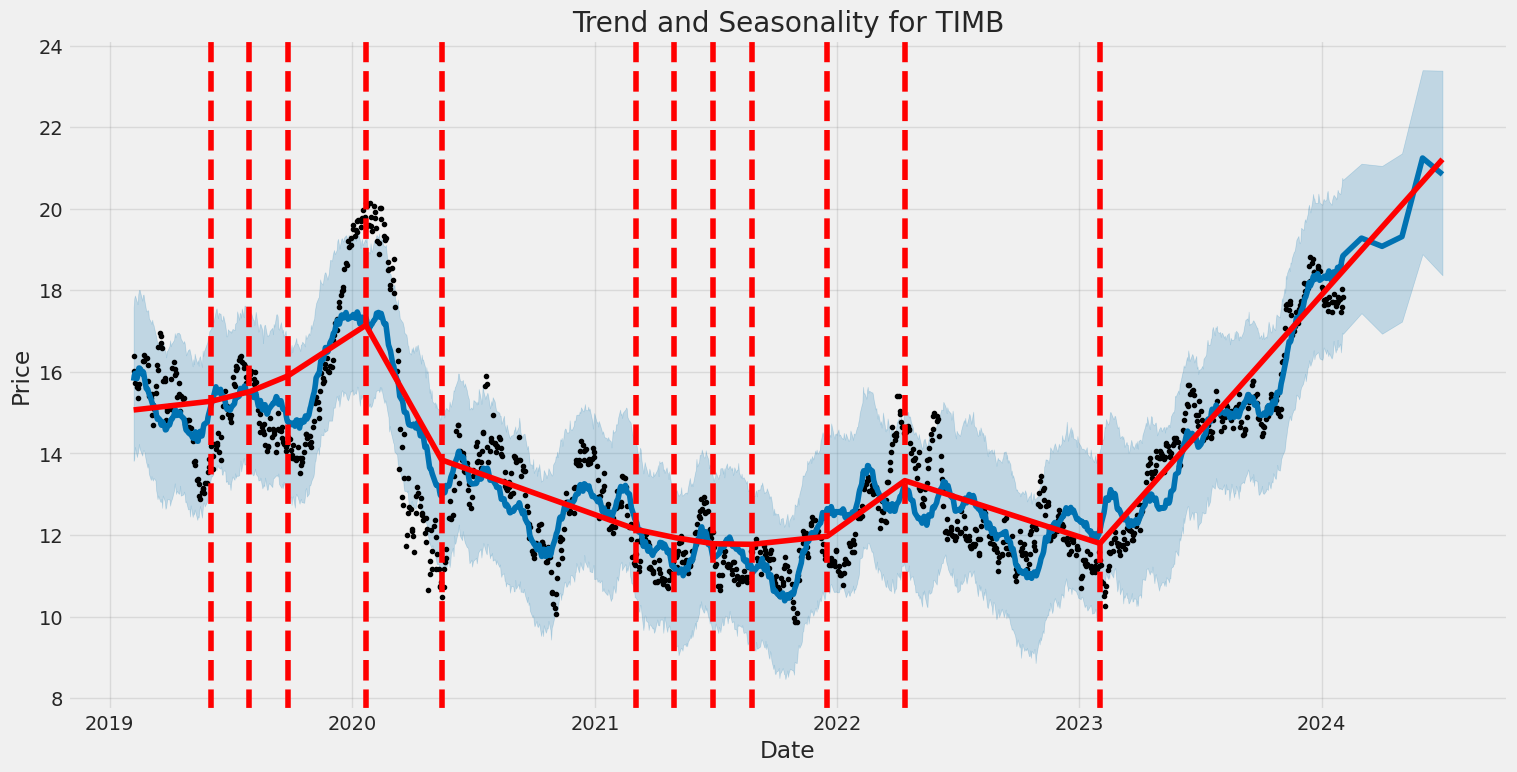
TIM S.A. (TIMB) experienced significant levels of volatility from February 2019 to February 2024, as evidenced by the ARCH model's analysis. The model identifies a strong impact of past market fluctuations on current volatility, with omega at 4.4888 indicating a high base level of volatility and alpha[1] at 0.2156 showing sensitivity to recent market movements. This indicates that TIMB's stock price was not only volatile but also significantly influenced by its own historical price changes during this period.
| Statistic Name | Statistic Value |
|---|---|
| Mean Model | Zero Mean |
| Log-Likelihood | -2841.18 |
| AIC | 5686.36 |
| BIC | 5696.63 |
| No. Observations | 1256 |
| omega | 4.4888 |
| alpha[1] | 0.2156 |
In assessing the financial risks associated with a $10,000 equity investment in TIM S.A. (TIMB) over a year, a nuanced approach utilizing both volatility modeling and machine learning predictions was employed. Volatility modeling, particularly adept at understanding the underlying patterns and fluctuations in stock prices, was integral in capturing the dynamic nature of TIM S.A.'s market behavior. This method is excellent for estimating the inherent volatility in the stock's returns, which is a critical factor in risk assessment. The analysis of stock volatility is essential because it provides insights into the expected variations in stock price, allowing investors to prepare for potential losses.
On the other side, machine learning predictions, through a predictive algorithm that learns from historical data, were used to forecast future returns of TIM S.A.'s stock. This approach leverages historical stock performance data to identify patterns and predict future movements, enhancing the precision of investment risk assessments. The integration of machine learning predictions into the financial analysis broadens the scope of traditional risk evaluation methods by incorporating predictive insights into future stock performance based on learned patterns from past data.
When combining these two methods, a more robust and comprehensive risk analysis framework is established. The volatility modeling enables a profound understanding of the stock's potential price movements and the degree of variability, which is crucial in risk management. Concurrently, machine learning predictions contribute forward-looking insights, allowing for an anticipation of future stock performance beyond mere historical volatility patterns.
Focusing on the Yearly Value at Risk (VaR) at a 95% confidence level, we find that for a $10,000 investment in TIM S.A., the VaR is calculated to be $247.46. This figure represents the expected maximum loss with a 95% confidence interval, indicating that there is a 5% chance that the investment could lose more than this amount over a year. The calculated VaR is an essential outcome of combining volatility modeling and machine learning predictions, as it offers a quantitative measure of the potential risk involved in the investment. This metric is particularly useful for investors in gauging their exposure to loss, informed by an understanding of past volatilities and future stock return predictions. By integrating the insights gained from both volatility modeling and machine learning forecasts, investors are better positioned to evaluate the financial risks of their investment in TIM S.A., considering both the variability of past stock performance and the anticipated future trends.
In the analysis of the most profitable call options for TIM S.A. (TIMB), its essential to consider the Greeks: Delta, Gamma, Vega, Theta, and Rho, along with the strike price, expiration date, premium, return on investment (ROI), and projected profit. Targeting a stock price increase of 5% from the current level, we evaluate the profitability of the options based on their sensitivity to market variables. For effective analysis, specific focus is given to options with a higher Delta, favorable Theta, and significant Vega in the context of their expiration dates and strike prices.
The option with a strike price of 12.5, expiring on 2024-02-16, exhibits a remarkably high Delta of approximately 0.999, which indicates that the option's price is almost moving one-to-one with the stock price. This option has the highest ROI of 1.2219642857, with a profit of 3.4215, and a virtually null Gamma and Vega, suggesting minimal sensitivity to the stocks volatility and acceleration. Given its imminent expiration date within 11 days, this option represents a high direct correlation with the stocks immediate movement, ideal for traders expecting an immediate rise in TIMBs price.
Conversely, an option expiring farther out, specifically on 2024-08-16, with a strike price of 15.0, presents a unique combination of a substantial Vega of 4.1015093937 and a Delta of 0.7277670414, signaling notable price sensitivity to both the underlying stocks movement and implied volatility. Its Theta is relatively low at -0.0051341237, indicating minimal time decay per day, a critical factor given its longer duration until expiration. The high Vega suggests this option could significantly benefit from an increase in volatility, a valuable characteristic if market conditions change. Despite a lower ROI of 0.16296875 and a profit of 0.5215, the lower time sensitivity combined with its Delta and Vega dynamics make it an attractive option for a strategy betting on both directional movement and volatility increase over a longer term.
In a medium-term perspective, the option with a strike price of 17.5, expiring on 2024-03-15, shows an interesting balance with a Delta of 0.5749431653, Vega of 2.272152413, and a comparatively low negative Theta of -0.0163207529. The Gamma of 0.1187090447 suggests a decent reactivity to changes in the stocks price velocity. While its ROI of 0.526875 and profit of 0.4215 dont match the short-term option, its balance of sensitivity to price and volatility, coupled with a more manageable time decay, positions it as an appealing option for those expecting moderate volatility and price movement in the near to medium term.
Considering these analyses, the short-term option expiring on 2024-02-16 with the strike price of 12.5 appears to be the most directly profitable choice for an immediate increase in the stock price. However, for those anticipating not only a direction in price movement but also a significant shift in market volatility, the longer-dated option expiring on 2024-08-16 with a strike price of 15.0 may offer more strategic flexibility and potential for profitability. The medium-term option serves as a balanced choice for traders betting on gradual increases in both the stock price and market volatility over the next few months. Thus, selection among these options should be aligned with the traders forecast on price movement, volatility expectations, and risk tolerance over their respective timelines.
Similar Companies in Telecom Services:
SK Telecom Co.,Ltd (SKM), PLDT Inc. (PHI), Liberty Broadband Corporation (LBRDK), Liberty Broadband Corporation (LBRDA), Telefonica Brasil S.A. (VIV), KT Corporation (KT), Orange S.A. (ORAN), Perusahaan Perseroan (Persero) PT Telekomunikasi Indonesia Tbk (TLK), Telefonica, S.A. (TEF), America Movil, S.A.B. de C.V. (AMX), Report: AT&T Inc. (T), AT&T Inc. (T), Report: Verizon Communications Inc. (VZ), Verizon Communications Inc. (VZ), T-Mobile US, Inc. (TMUS)
Copyright © 2024 Tiny Computers (email@tinycomputers.io)
Report ID: eHX69lP
Cost: $0.23828
https://reports.tinycomputers.io/TIMB/TIMB-2024-02-04.html Home