Twilio Inc. (ticker: TWLO)
2024-02-12
 Twilio Inc. (ticker: TWLO) stands as a prominent player in the cloud communications industry, offering a suite of services that enable developers to build, scale, and operate real-time communications within their software applications. Founded in 2008 and headquartered in San Francisco, California, Twilio has revolutionized the way businesses communicate with their customers by providing APIs for text messaging, voice calls, video calls, and email services, among others. The company's innovative approach allows for the integration of various communication methods into applications, making it a critical tool for companies looking to enhance customer engagement and streamline operations. Twilio's scalable and flexible platform supports a wide range of use cases, from simple notification services to complex contact center solutions, catering to a diverse set of industries worldwide. As of my last update, Twilio has shown a remarkable growth trajectory, though it faces challenges in profitability and competition. However, its continued expansion, including strategic acquisitions and the introduction of new products, positions it well for future growth and industry leadership.
| Full Time Employees | 8,156 | CEO Pay | 1,108,304 | Previous Close | 70.36 |
| Open | 71.69 | Day Low | 71.13 | Day High | 72.59 |
| Volume | 3,310,893 | Market Cap | 12,962,678,784 | Fifty Two Week Low | 45.02 |
| Fifty Two Week High | 79.7 | Price To Sales (TTM) | 3.159 | Enterprise Value | 10,299,673,600 |
| Profit Margins | -21.437% | Shares Outstanding | 181,043,008 | Book Value | 54.812 |
| Last Fiscal Year End | 1672444800 | Net Income To Common | -879,454,976 | Trailing EPS | -4.77 |
| Target High Price | 110.0 | Target Low Price | 50.0 | Total Cash | 3,857,409,024 |
| Total Revenue | 4,102,568,960 | Debt To Equity | 11.969 | Revenue Per Share | 22.279 |
| Return On Assets | -2.82% | Return On Equity | -8.576% | Free Cashflow | 398,327,008 |
| Revenue Growth | 5.2% | Gross Margins | 48.615% | Operating Margins | -9.879% |
| Statistic Name | Statistic Value | Statistic Name | Statistic Value |
| Sharpe Ratio | 0.4742576907363341 | Sortino Ratio | 8.043794589531414 |
| Treynor Ratio | 0.14582962137727654 | Calmar Ratio | 0.4324687163939399 |
Through the lens of technical, fundamental, and balance sheet assessment, we examine TWLO's future stock price movements. Utilizing the provided data and analytical ratios, our analysis incorporates a spectrum of factors from the company's financial health and operational performance to market sentiment and risk-adjusted returns.
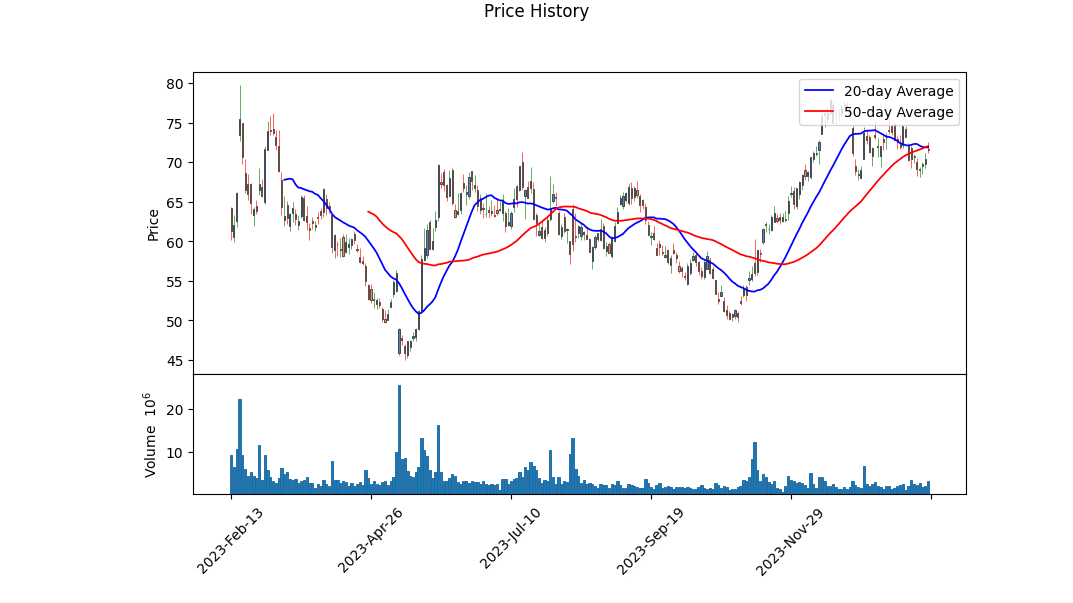
Technical Indicators: The technical analysis landscape shows notable momentum in TWLO's stock price, with the share price experiencing a steady climb in recent trading sessions. The MACD histogram values, nearing the more recent trading days, indicate a shrinking bearish momentum, transitioning towards bullish territory. This shift suggests potential upward price momentum in the forthcoming months, underpinned by increasing trading volumes as evidenced by the positive trend in OBV (On Balance Volume).
Fundamentals and Balance Sheet Strength: Evaluating TWLO's fundamentals reveals a nuanced picture. While TWLO presents a robust growth story with positive analyst expectations regarding revenue and earnings estimatesanticipating a 7.50% sales growth and a forecasted earnings increase to $2.45 for the next yearthere are areas of concern. The company's operational and EBITDA margins remain in the negative territory, signaling ongoing challenges in achieving operational efficiency and profitability. Nonetheless, TWLO's tangible book value and total assets reflect a solid balance sheet foundation, providing financial flexibility and resilience.
Risk-Adjusted Return Ratios: The risk-adjusted return ratiosSharpe, Sortino, Treynor, and Calmaroffer a multifaceted perspective on TWLO's investment viability. The impressive Sortino ratio signifies TWLO's favorable returns against downside risk, making it an attractive proposition for risk-averse investors. Additionally, the positive Sharpe ratio, although moderate, indicates that TWLO is generating adequate excess returns for the volatility endured by its holders. The Treynor and Calmar ratios, while lower, still advocate for TWLO's competent return on risk and drawdown management, respectively.
Market Sentiment and Analyst Expectations: The sentiment surrounding TWLO, boosted by consistently exceeding earnings expectations across the last four quarters, has been optimistic. This performance has likely bolstered investor confidence, further evidenced by substantial upward revisions in earnings estimates. Such positive analyst sentiment, coupled with high growth estimates, positions TWLO favorably in the eyes of potential investors.
Conclusion: Considering the dynamism in TWLO's technical indicators, foundational strength derived from its financial statements, and supportive market sentiment, the outlook for TWLO's stock price in the upcoming months is predominantly positive. The stock demonstrates the capacity for upward movement, supported by robust growth expectations and a favorable risk-return profile. However, prospective investors should also weigh the operational challenges and strive for a balanced view encompassing both the promising prospects and inherent risks.
In our analysis of Twilio Inc. (TWLO) following the principles laid out in "The Little Book That Still Beats the Market," we have delved into two crucial metrics: Return on Capital (ROC) and Earnings Yield. The Return on Capital (ROC) for Twilio stands at -8.77%, pointing towards a challenging scenario where the company is not currently generating a positive return on the capital employed. This figure suggests that Twilio is losing money on the investments it makes in its own business, a red flag for potential investors focusing on profitability and efficient capital allocation. Similarly, the Earnings Yield for Twilio is calculated to be -9.58%, which further emphasizes the company's struggles in terms of profitability from an investor's perspective. Typically, a positive earnings yield is desirable as it indicates that a company is generating earnings compared to its share price, but in Twilio's case, the negative figure underlines the company's current earnings inadequacy relative to its stock price. Both the negative ROC and Earnings Yield require cautious interpretation, suggesting that Twilio may currently face significant challenges in generating profitable growth and providing value to its investors based on these metrics.
| Statistic Name | Statistic Value |
| R-squared | 0.204 |
| Adj. R-squared | 0.203 |
| F-statistic | 320.5 |
| Prob (F-statistic) | 5.32e-64 |
| Log-Likelihood | -3339.1 |
| No. Observations | 1,256 |
| AIC | 6682. |
| BIC | 6693. |
| coef (const) | -0.0392 |
| coef (0) | 1.3257 |
| std err (const) | 0.098 |
| std err (0) | 0.074 |
| t (const) | -0.401 |
| t (0) | 17.902 |
| P>|t| (const) | 0.688 |
| P>|t| (0) | 0.000 |
| [0.025 (const) | -0.231 |
| [0.975 (const) | 0.152 |
| [0.025 (0) | 1.180 |
| [0.975 (0) | 1.471 |
| Omnibus | 343.343 |
| Prob(Omnibus) | 0.000 |
| Skew | 0.139 |
| Kurtosis | 25.621 |
| Cond. No. | 1.32 |
| Alpha | -0.0392 |
| Beta | 1.3257 |
The linear regression model of TWLO against SPY for the observed period indicates a positive beta of 1.3257 and an alpha of -0.0392. This positive beta suggests that TWLO has a tendency to move in the same direction as the SPY but with greater volatility. On the other hand, the negative alpha implies that, after adjusting for market movements, TWLO underperformed the benchmark SPY during this period. The R-squared value of 0.204 means that around 20.4% of TWLO's price movement can be explained by the movements in SPY, leaving a significant portion of the variability unexplained by this model.
Given the findings, investors considering a relationship between TWLO's stock performance and the broader market (SPY) should take into account the relatively high beta, which indicates a higher risk and volatility in comparison to the market. However, the negative alpha is a matter of concern as it points towards TWLOs inability to outperform the market on a risk-adjusted basis. Investors might use this analysis for portfolio diversification, risk assessment, or as a groundwork for further investigation into factors influencing TWLOs performance relative to the market.
Twilio Inc. (TWLO) showcased a strong performance in the third quarter of 2023, surpassing both revenue and non-GAAP profitability expectations. The company reported a revenue of $1.034 billion, demonstrating a notable non-GAAP income from operations amounting to $136 million and an impressive free cash flow of $195 million. This remarkable financial performance led to Twilio raising its full-year non-GAAP income from operations guidance to between $475 million and $485 million. The results reflect Twilio's efficiency gains and underline the foundational strength of its Communications business, which constituted 88% of the quarter's revenue.
Jeff Lawson, Co-Founder and CEO of Twilio, emphasized the company's achievements in the Communications sector, spotlighting a commendable recognition by Gartner, which named Twilio a leader in their inaugural Magic Quadrant for CPaaS (Communications Platform as a Service). This accolade underscores Twilio's advantageous market position and the robust capabilities of its platform. Lawson also discussed the company's focus on expanding its customer base, enhancing self-service capabilities, and leveraging cross-sell opportunities. Additionally, he highlighted a significant enhancement of Twilio's partnership with Softbank, aiming to secure a larger market share through meaningful partnerships.
In addressing the opportunities and challenges in Twilio's Data & Applications (TD&A) segment, Lawson revealed changes in leadership. Elena Donio, President of Twilio Data & Applications, transitioned to an advisory role, with Lawson temporarily taking the helm of TD&A. Despite facing a modest uptick in bookings for the quarter, TD&A represents a critical focus area, especially regarding AI opportunities. Twilio continues to witness remarkable customer wins across both its Flex and Segment offerings, reflecting positive market response to its software solutions. During the SIGNAL events, Twilio revealed its CustomerAI initiative, focusing on predictive and generative capabilities, demonstrating Twilio's commitment to leveraging AI for enhanced customer communications.
Strengthening Twilio's financial backbone, Chief Financial Officer Aidan Viggiano detailed the financials, underscoring a consistent drive towards profitability and efficiency across the business. The notable growth in Communications revenue, reaching $907 million, marks a 5% year-over-year increase, which, alongside strategic initiatives such as the successful execution against the 10DLC registration deadline, contributes to Twilio's positive outlook. Despite challenges in the TD&A segment, Twilio's strategic directions and investments in AI underscore its long-term vision to enhance customer interactions and drive sustained growth.
In summary, Twilio Inc.'s third quarter earnings call of 2023 illustrated a company in a strong financial position, with significant growth in its Communications business and ongoing strategic adjustments in its Data & Applications segment. Through leadership changes, strategic partnerships, and a focus on AI, Twilio aims to solidify its market position, drive efficient growth, and capitalize on emerging opportunities to enhance customer communications and data insights.
1 %
Non-GAAP gross profit and non-GAAP gross margin provide us with useful insight into our operational performance and are indicators of how management assesses the health of our business. By excluding specific expenses such as stock-based compensation, payroll taxes related to stock-based compensation, and the amortization of acquired intangible assets, we can evaluate our core operational performance and compare it across reporting periods. This assessment helps us understand the efficiency of our cost structure and its impact on overall profitability.
In the three months ended September 30, 2023, non-GAAP gross profit increased to $552.6 million from $499.1 million in the corresponding period of 2022. This improvement reflects our ability to manage costs effectively and improve our operational efficiency. Similarly, non-GAAP gross margin expanded from 51% in the third quarter of 2022 to 53% in the third quarter of 2023, demonstrating our ability to enhance profitability in a competitive and rapidly evolving market. The increase in non-GAAP gross margin highlights our successful efforts in optimizing our cost structure and leveraging our scale to improve margins.
Non-GAAP adjustments mainly consist of stock-based compensation, an inherent part of our compensation strategy to attract and retain talent, amortization of acquired intangibles resulting from our strategic acquisitions, and related payroll taxes. These adjustments are significant in understanding our operational performance as they are non-cash expenses that can vary significantly across periods based on our stock price, the timing and valuation of acquisitions, and other factors not directly related to our core operational performance.
By focusing on non-GAAP gross profit and non-GAAP gross margin, we aim to provide investors with a clearer picture of our underlying business performance and operational efficiency. These measures are crucial for internal planning, forecasting purposes, and making strategic decisions to drive sustainable growth and profitability over the long term. However, it's important for investors to consider these non-GAAP measures in conjunction with our GAAP results to fully understand the factors and trends affecting our business.
Twilio Inc., a leader in cloud communications, is navigating a complex landscape shaped by strategic realignments, leadership transitions, and shifts in investor sentiment. Amid these changes, the company's attempts to stimulate growth while maintaining cost efficiency have presented both challenges and opportunities. With its share value significantly reduced from its pandemic peak, Twilio's journey toward profitability and operational stability is under scrutiny, particularly as it undergoes a major management overhaul and grapples with market pressures.
The division into two operational segments communications, focusing on mature products, and data and applications, aiming at growth through high-value software products signals Twilio's strategic pivot. Despite the communications division outperforming its targets, the data and applications segment has lagged, with the Segment acquisition not fully realizing its potential due to marketing and growth challenges. This bifurcation of operations lays bare the difficulties Twilio faces in balancing its portfolio to navigate a path to profitability, particularly when underscored by a commitment to achieve GAAP profitability by 2027.
Market analysts and investors closely monitor Twilio's restructuring efforts. The inclusion of Twilio's stock in Cathie Wood's Ark Innovation ETF underscores a belief in the company's long-term growth potential, despite current hurdles. Twilio's flexible cloud-based software has positioned it as a key beneficiary of the projected expansion in the cloud-based contact center market. However, its current valuation metrics and trading performance reflect the immediate challenges of realizing this growth potential in a competitive and rapidly evolving market.
Complicating Twilio's narrative is the departure of founder Jeff Lawson from the CEO position amidst activist investor pressures. The leadership transition to Khozema Shipchandler, a Twilio veteran, serves as a pivotal moment for the company. This change aims to steer Twilio through its restructuring phases and tackle the operational and strategic challenges head-on. These leadership shifts, coupled with ongoing layoffs and efforts to fend off activist demands, indicate a period of significant organizational flux.
Under Shipchandler's leadership, Twilio's focus remains on enhancing operational efficiency and navigating its strategic direction amidst investor scrutiny. The expected financial outcomes, particularly the anticipation surrounding its earnings report, have investors eager to gauge the effectiveness of these leadership and strategic changes on Twilio's market performance and future growth prospects.
As part of the broader tech and communications sectors, Twilio's fortunes are intertwined with market dynamics, including changing investor expectations and the continuous evolution of digital communication technologies. The company's performance, especially in the face of economic uncertainties and competitive pressures, will be crucial in determining its position as either a valuable investment opportunity or a cautionary tale of growth challenges in the tech sector.
Twilio's journey encapsulates the complexities of scaling and innovating within the tech landscape, marked by strategic gambles, leadership changes, and the relentless pursuit of profitability and market relevance. As it moves forward, stakeholders will closely watch how Twilio adapts to these internal and external factors, striving to transform its potential into tangible success.
Over the specified period, Twilio Inc. (TWLO) experienced notable volatility as indicated by its statistical analysis. The volatility model highlights that there was a significant level of variation in its asset returns, despite the mean of these returns not contributing directly to predicting future volatility. The key features reflecting Twilio's volatility include a notable coefficient (omega) indicating a base level of variance and an alpha parameter suggesting that past returns have a moderate effect on future volatility, though this effect is at the edge of statistical significance.
| Statistic Name | Statistic Value |
|---|---|
| R-squared | 0.000 |
| Adj. R-squared | 0.001 |
| Log-Likelihood | -3459.21 |
| AIC | 6922.42 |
| BIC | 6932.69 |
| No. Observations | 1256 |
| omega | 10.7963 |
| alpha[1] | 0.3864 |
Analyzing the financial risks associated with an investment in Twilio Inc. (TWLO) necessitates a sophisticated approach to assess the potential volatility and future returns. This endeavor is particularly crucial given the inherent uncertainties in the stock market. A combination of volatility modeling and machine learning predictions provides a robust framework for understanding and quantifying these risks over a one-year period.
Firstly, the use of volatility modeling is paramount in capturing the intricacies of Twilio Inc.'s stock fluctuations. This approach is adept at modeling time-varying volatility, which is a characteristic feature of financial time series data such as stock prices. By analyzing historical price data, volatility modeling identifies periods of high and low volatility, providing insights into the underlying risk pattern of the investment. This model effectively forecasts the future volatility of Twilio Inc.'s stock by recognizing patterns in the past, thereby shedding light on the expected variability in returns for the forthcoming year.
Parallelly, the inclusion of machine learning predictions further enhances the analysis by offering predictions on the future returns of Twilio Inc. This predictive model, equipped to handle vast datasets and discover complex relationships, contributes significantly to the assessment by forecasting the direction in which the stock price is expected to move. Leveraging historical data and various indicators, this machine learning approach is tasked with generating return forecasts, thus complementing the volatility model by providing a more rounded view of the expected investment performance.
Combining the insights from both the volatility modeling and machine learning predictions, the financial risk of the $10,000 investment in Twilio Inc. can be quantified through the Value at Risk (VaR) metric. VaR offers a straightforward interpretation of risk by specifying the maximum loss expected over a given period with a certain level of confidence. For this analysis, with a 95% confidence interval, the annual Value at Risk for the investment in Twilio Inc. is calculated to be $498.30. This figure translates to a probability of 95% that the investor will not lose more than $498.30 on their $10,000 investment over the next year, under normal market conditions.
The integration of volatility modeling with machine learning predictions thus provides a comprehensive understanding of the potential risks involved in investing in Twilio Inc. This two-pronged approach allows for an effective assessment of both the expected volatility and returns, culminating in the application of the VaR metric to quantify financial risk. Through this analysis, investors are better equipped to understand the nature and extent of the risks they face, enabling more informed investment decisions.
When analyzing the options trading scenario for Twilio Inc. (TWLO) call options and considering an anticipated target stock price increase of 5% over the current price, several factors derived from "the Greeks" and other metrics should be considered for identifying the most profitable options. These include the Delta, Gamma, Vega, Theta, and Rho values, along with the strike price, days to expiration, and the expected return on investment (ROI) and profit.
Short-term High Delta Options Options with a Delta close to 1.0 indicate they are deep in the money and will likely mimic the stock price movement almost 1:1. For instance, calls with strike prices at $30.0 and $35.0 expiring on February 16, 2024, hold Delta values of 1.0. These options are primed for investors believing in a very near-term rise in TWLO's stock, as they will benefit almost directly from stock price increments. However, the ROI for these is comparatively low, suggesting that while the risk is lower, the margin for profit based on percentage return is also less.
Mid-term Vega Significant Options Considering options with a significant Vega value and a reasonable expiration timeframe allows investors to benefit from increases in implied volatility. Options expiring on February 23, 2024, with strike prices at $60.0, illustrate higher vega values, such as 3.1939615851, indicating a higher sensitivity to volatility a key aspect when anticipating stock movements or market events that could increase option premiums before even a price movement. A Delta of 0.812112265 also suggests these options are still likely to increase in value with a bullish stock move, although not as significantly as those with a higher Delta.
Longer Durations with Balanced Metrics Options with longer durations, such as those expiring in June and July 2024, present a balanced mix of Delta, Vega, and Theta that could offer profitable opportunities for investors with a mid-term outlook. For instance, the option with a strike price of $40.0, expiring in June 2024, offers a higher Delta than options with higher strike prices while maintaining a significant Vega value of 9.5828960336, which could benefit from volatility. Additionally, the longer expiration provides a cushion against time decay, reflected in a moderate Theta value.
High ROI Potentials Options such as the one with a strike price of $38.0, expiring in April 2024, showcase an incredibly high ROI of 1.4412344058. Despite the Delta not being disclosed, such a high ROI indicates a substantial profit potential relative to the premium paid, especially if TWLOs stock performs favorably towards the options strike price. This could appeal to risk-tolerant investors seeking higher returns and believing in significant stock appreciation.
Conclusion The selection of the most profitable option depends largely on the investor's risk tolerance, investment horizon, and bullishness on the underlying stock. Short-term, high Delta options are less risky but offer lower ROI, suitable for conservative investors. Options with high Vega and balanced Greeks, expiring in mid-term (e.g., June 2024), might suit investors seeking to leverage volatility and time decay moderately. High ROI options are riskier but can provide significant returns if the stock performs excellently and aligns with the investor's strike price and expiration timeframe choice. As always, investors should conduct thorough research and consider market conditions, company performance, and potential news impacting the stock before making options trading decisions.
Similar Companies in Internet Content & Information:
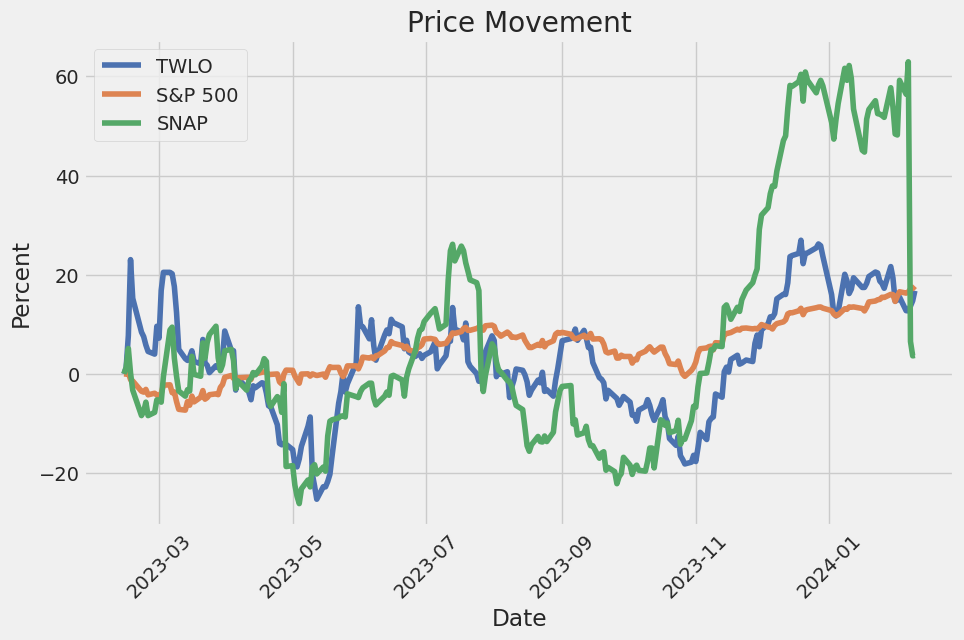
Snap Inc. (SNAP), Fiverr International Ltd. (FVRR), Spotify Technology S.A. (SPOT), Baidu, Inc. (BIDU), Pinterest, Inc. (PINS), Report: Meta Platforms, Inc. (META), Meta Platforms, Inc. (META), Alphabet Inc. (GOOG), Report: Alphabet Inc. (GOOGL), Alphabet Inc. (GOOGL), Tencent Holdings Limited (TCEHY), Bandwidth Inc. (BAND), Vonage Holdings Corp. (VG), RingCentral, Inc. (RNG), 8x8, Inc. (EGHT), Sinch AB (SINCH)
https://www.fool.com/investing/2023/12/29/2-stocks-on-my-watchlist-for-2024/
https://www.fool.com/investing/2023/12/30/this-cathie-wood-stock-is-soaring-magnificently-an/
https://www.cnbc.com/2024/01/08/twilio-ceo-lawson-steps-down-after-bruising-activist-battles.html
https://www.fool.com/investing/2024/01/11/twilio-getting-new-management-team-time-shop-stock/
https://www.fool.com/investing/2024/01/20/could-twilio-become-the-next-amazon/
https://www.fool.com/investing/2024/01/21/2-top-bargain-stocks-ready-for-a-bull-run/
https://seekingalpha.com/article/4664509-twilio-a-rare-value-stock-in-the-tech-sector
https://finance.yahoo.com/news/twilio-twlo-reports-next-week-150037451.html
https://finance.yahoo.com/news/whats-offing-mettler-toledos-mtd-150600567.html
https://finance.yahoo.com/news/twilio-twlo-outperforms-broader-market-225010416.html
https://finance.yahoo.com/news/12-best-communication-stocks-buy-121621723.html
https://finance.yahoo.com/news/beat-likely-qualys-qlys-earnings-124200917.html
https://finance.yahoo.com/news/twilio-inc-twlo-attracting-investor-140006373.html
https://finance.yahoo.com/news/cisco-csco-report-q2-earnings-153900522.html
https://finance.yahoo.com/news/watts-water-wts-q4-earnings-154200510.html
https://www.sec.gov/Archives/edgar/data/1447669/000144766923000226/twlo-20230930.htm
Copyright © 2024 Tiny Computers (email@tinycomputers.io)
Report ID: TI1Unl
Cost: $1.01010
https://reports.tinycomputers.io/TWLO/TWLO-2024-02-12.html Home