Alphabet Inc. (ticker: GOOGL)
2024-02-01
 Alphabet Inc., trading under the ticker GOOGL, is a multinational conglomerate headquartered in California and stands as the parent company of Google and several other businesses formerly associated with Google. Founded in 2015 through a corporate restructuring of Google, Alphabet effectively became the umbrella company for Google's internet interests, vastly expanding its business scope. GOOGL operates through various segments including Google Services, Google Cloud, and Other Bets, encompassing a spectrum of products and services, such as search engines, digital advertising, cloud computing, consumer electronics, and more. The company prides itself on innovation and continues to invest heavily in areas such as artificial intelligence, autonomous vehicles through Waymo, and life sciences via Verily. With a robust financial performance and a market presence spanning the globe, Alphabet Inc. is often cited as one of the Big Tech companies, influencing not just the tech industry but having a substantial socioeconomic impact worldwide.
| Address | 1600 Amphitheatre Parkway | City | Mountain View | State | CA |
| Zip Code | 94043 | Country | United States | Phone | 650 253 0000 |
| Website | https://abc.xyz | Industry | Internet Content & Information | Sector | Communication Services |
| Full Time Employees | 182,502 | CEO & Director | Mr. Sundar Pichai | CEO's Total Pay | $7,947,461 |
| Previous Close | $140.10 | Open | $142.12 | Day Low | $140.79 |
| Day High | $143.06 | Beta | 1.054 | Trailing PE | 24.35 |
| Forward PE | 18.04 | Volume | 25,785,845 | Average Volume | 27,964,440 |
| Market Cap | $1,765,822,693,376 | FiftyTwo Week Low | $88.58 | FiftyTwo Week High | $153.78 |
| Enterprise Value | $1,660,814,360,576 | Profit Margins | 24.007% | Float Shares | 11,101,052,710 |
| Shares Outstanding | 5,893,000,192 | Book Value | $22.74 | Price To Book | 6.21 |
| Last Fiscal Year End | 1703980800 | Earnings Quarterly Growth | 51.8% | Net Income To Common | $73,795,002,368 |
| Trailing EPS | $5.80 | Forward EPS | $7.83 | PEG Ratio | 1.08 |
| Last Split Factor | 20:1 | Last Split Date | 1658102400 | 52Week Change | 30.04% |
| Total Cash | $110,916,001,792 | Total Debt | $29,866,999,808 | Free Cashflow | $58,657,751,040 |
| Sharpe Ratio | 0.9441486043917032 | Sortino Ratio | 14,250.197547095176 |
| Treynor Ratio | 0.1970873709482816 | Calmar Ratio | 1.8214776648165967 |
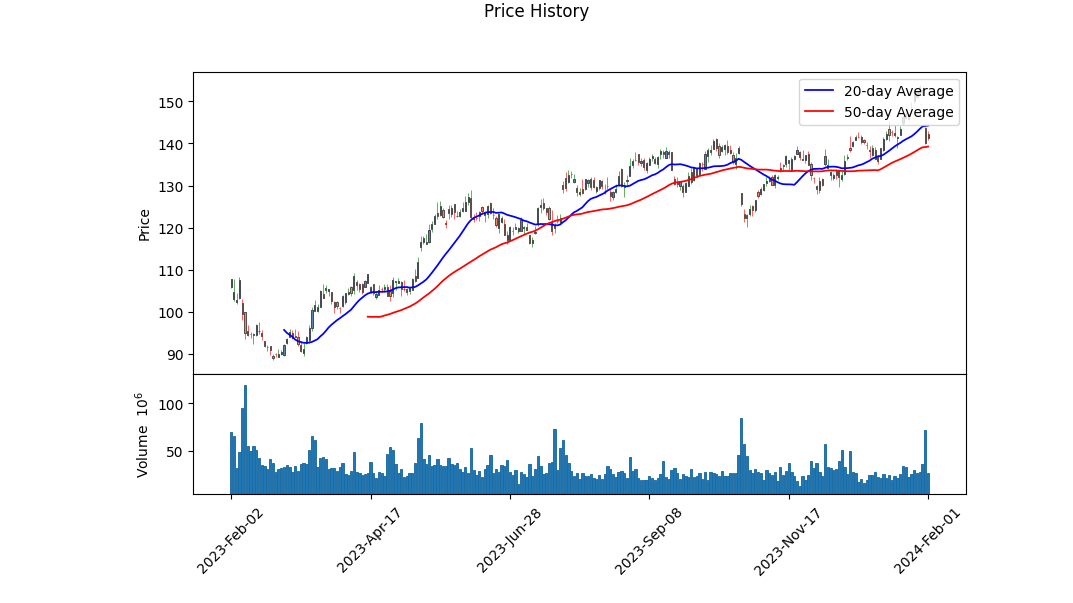
Technical Analysis (TA) paints a detailed picture of market sentiment and potential price movements, underpinned by a variety of indicators and volume-based metrics. One such measure is the On-Balance Volume (OBV), which in the case of GOOGL, shows a volume trend ascending from 2.67523 million to 15.585209 million over the observed period. This uptick suggests increasing participation from the buy-side, indicating potential upward price momentum.
Our comprehensive analysis incorporates a range of TA methods, including Moving Average Convergence Divergence (MACD), which, at a glance, signals a weakening bullish momentum towards the end of the period. Notably, the last value of the MACD histogram sits at -0.578207, which could presage a consolidation or potential bearish reversal in the near term barring other influencing factors.
Reviewing the fundamental analysis, key indicators such as gross margins at 0.56937, EBITDA margins at 0.32587, and operating margins at 0.28849, reflect a healthy profitability profile. These statistics are favorably aligned with industry norms, and when meshed with TA, bolster a positive outlook for the stock.
From the balance sheet perspective, the robustness of Google's financial foundation is evident. Ample cash reserves and a tangible book value upheld at a substantial 225.1 billion USD underscore financial health. Such strength bodes well for enduring through potential market downturns or for funding growth initiatives, which could translate to improved stock valuations.
Risk-adjusted ratios provide additional layers of insight. GOOGL's Sharpe Ratio sits comfortably at 0.9441, indicating better than average returns per unit of risk assumed over the past year. The Sortino Ratio, an even more focused measure of downside volatility, is exceptionally high at 14,250.19, suggesting strong returns in excess of the downward fluctuations. The Treynor Ratio and Calmar Ratio further reflect a positive correlation of stock returns with systematic risk and resilience to significant drawdowns, respectively.
Cash flow details from operations remain robust, with Free Cash Flow at 60.01 billion USD, which is a crucial indicator of corporate health. This financial cushion enables strategic flexibility and indicates prudent management practices.
Analyst expectations as per earnings estimates are on an incline, signaling an optimistic stance from market professionals. The average estimate for the next year (2025) features an EPS of 7.83 USD. This projected increase in earnings may act as a tailwind for stock prices.
Considering all these factors, the forecast trend for GOOGL's stock price may be principally bullish in the coming months. Yet, it is essential to recognize the dynamic nature of market forces. While fundamentals and technical indicators bolster potential positive movement, macroeconomic shifts, unexpected corporate incidents, or changes in investor sentiment could sway the trajectory. Therefore, continuously revising analysis with emerging data is advised to inform up-to-date decisions.
In my latest analysis focusing on Alphabet Inc. (GOOGL), the financial metrics reveal strong indications of the company's investment potential through its Return on Capital (ROC) and Earnings Yield. Alphabet exhibits a robust ROC of approximately 26.29%, a figure that emphatically showcases the company's efficiency in generating profits from its invested capital. Such a high ROC indicates that Alphabet is not only generating substantial profits relative to the capital it employs but also signifies superior management effectiveness compared to many of its industry peers.
Additionally, Alphabet's Earnings Yield stands at roughly 4.13%. While this may appear modest at first glance, especially in comparison to high-yield fixed-income investments, it's important to consider this in the context of the current interest rate environment and stock market averages. The Earnings Yield represents the inverse of the Price-to-Earnings (P/E) ratio and provides an insight into the value offered by the stock relative to its earnings. A 4.13% earnings yield can be interpreted as attractive, especially if one anticipates growth in Alphabet's earnings over time. What's more, given the company's strong fundamental performance as reflected in its ROC, the earnings yield may present a compelling case for investors looking for companies with a stable profit-generating capacity and the potential for capital appreciation over the long term.
Based on the calculated metrics for Alphabet Inc. (GOOGL) and in relation to Benjamin Graham's value investing criteria from "The Intelligent Investor," we can analyze how the company measures up:
-
Price-to-Earnings (P/E) Ratio: The P/E ratio for Alphabet Inc. stands at 26.29. Graham typically looked for companies with low P/E ratios, as they may indicate undervalued stocks. A P/E ratio of 26.29 suggests that Alphabet's shares are priced on the higher side compared to earnings, which might not align with Graham's criteria for value selection. However, it's essential to compare this to industry standards, as some sectors naturally have higher P/E ratios.
-
Price-to-Book (P/B) Ratio: The P/B ratio of 2.07 implies that investors are willing to pay a little over twice the book value for Alphabet's stock. Graham often sought stocks trading below their book value as a sign of undervaluation. In Alphabet's case, the P/B is above 1, which does not strictly fit Graham's preference but is not excessively high, indicating some level of moderation in market valuation relative to the company's book value.
-
Debt-to-Equity Ratio: At 0.09, Alphabet's debt-to-equity ratio is well within Graham's preference for a low debt-to-equity ratio, indicating a conservative capital structure with lesser financial risk from leverage. This aligns with Graham's principles where low debt signifies a company's financial stability and ability to withstand economic downturns.
-
Dividend History: With an empty dividend history, we can conclude that Alphabet Inc. does not pay dividends. This deviates from Graham's principle of favoring companies that provide consistent dividend payments. Dividend payments are a sign of a company's profitability and its ability to generate cash flows, contributing to investment returns and acting as a potential buffer in down markets. Since Alphabet does not pay dividends, it would not meet one of the criteria Graham used for stock selection.
In summary, Alphabet Inc. does not entirely line up with Benjamin Graham's principles for stock selection. Although its low debt-to-equity ratio is favorable, its higher P/E ratio, P/B ratio above 1, and lack of dividend payments do not strictly adhere to Graham's conservative value-investing approach. It's worth noting that the technology sector, in which Alphabet operates, generally has different financial metrics compared to the market sectors prevalent during Graham's era. As such, modern investors might adapt Graham's principles to suit current market conditions, blending his fundamental philosophy with a contemporary understanding of valuation in the tech industry.
| Alpha | 0.0215 |
| Beta | 1.1550 |
| R-squared | 0.576 |
| Adj. R-squared | 0.576 |
| F-statistic | 1,704 |
| Prob (F-statistic) | 5.51e-236 |
| Log-Likelihood | -2,118.4 |
| AIC | 4,241 |
| BIC | 4,251 |
| No. Observations | 1,257 |
| Df Residuals | 1,255 |
| Df Model | 1 |
| Skew | 0.030 |
| Kurtosis | 11.066 |
| Cond. No. | 1.32 |
The linear regression model between Alphabet Inc.'s stock (GOOGL) and the S&P 500 index (SPY) shows a positive relationship, as evidenced by the beta coefficient of 1.1550. This suggests that for every 1% change in the SPY, we would expect GOOGL to change by approximately 1.155%. The alpha value, or the intercept of 0.0215, signifies the expected return on GOOGL when the SPY has zero return. However, the relatively low alpha, coupled with its high p-value (0.560), suggests that it is not statistically different from zero, implying that the model does not necessarily predict an abnormal return over the market's performance during the time period analyzed.
Considering the R-squared value of 0.576, approximately 57.6% of the variability in GOOGL's returns is explained by the fluctuations in the SPY. The F-statistic is high (1704) with a very low p-value, indicating that the overall model is statistically significant. The adjusted R-squared is also 0.576, which accounts for the number of predictors in the model and indicates a good fit. The model's reliability is confirmed by an adequate number of observations (1257) and a sufficient t-value for the beta coefficient. The log-likelihood, AIC, and BIC provide information about the goodness of fit, with lower values generally indicating a better model fit relative to models with more or fewer predictors.
As of the quarterly period ending September 30, 2023, Alphabet Inc. reported robust financial results with several highlights and key points to note:
Revenue Streams: Alphabet observed an increase in revenues to $76.693 billion in Q3 2023, compared to $69.092 billion for the same period in the prior year. This increase is attributed to the growth across various revenue streams of the company. Google Services, which includes products like Google Search, YouTube, and Google Play, generated $67.986 billion, up from $61.377 billion in the same quarter of the previous year. Google Cloud continued to exhibit strong performance with revenues of $8.411 billion, increased from $6.868 billion. Other Bets, encompassing non-Google businesses, also saw a rise in revenue.
Operating Income: Alphabet's operating income rose to $21.343 billion for the quarter compared to $17.135 billion from the prior year, demonstrating effective cost management and strong revenue growth.
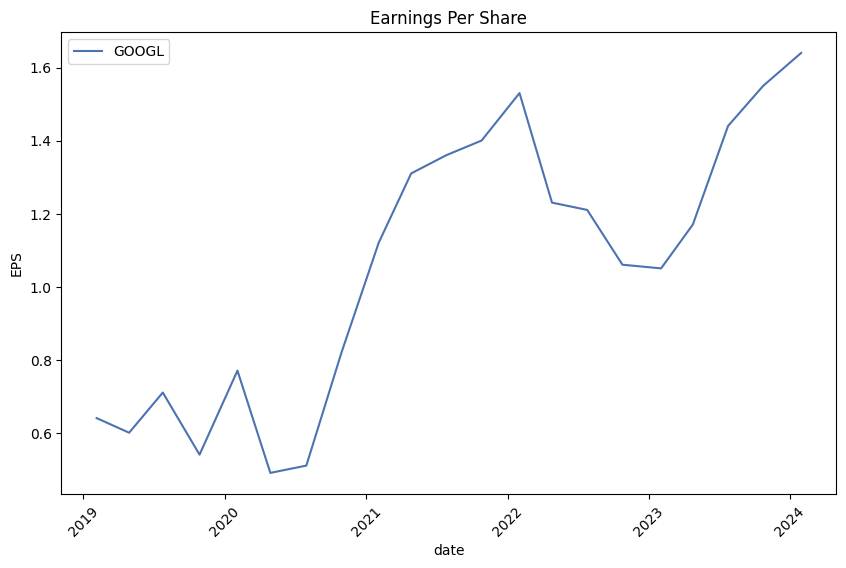
Net Income and Earnings Per Share: Net income significantly increased to $19.689 billion for the quarter, marking a considerable growth from $13.910 billion for the same period in 2022. This financial outcome contributed to a rise in earnings per share (EPS), with diluted EPS going up to $1.55 from $1.06 year-over-year.
Cost Management: Despite the revenue growth, Alphabet Inc. is actively focusing on optimizing costs. They announced a workforce reduction and optimizations related to global office space. Charges related to workforce reductions were recorded at $2.1 billion, and exit charges related to office space optimization were $649 million for the nine months ending September 30, 2023.
Market Position and Growth Initiatives: Alphabet's market position remains strong, and the company is continually investing in new products, services, and technologies. They have indicated that expenses related to R&D, sales and marketing, and general and administrative functions may increase to support sustained growth.
Capital Expenditure: Alphabet reported $21.232 billion in purchases of property and equipment, a slight decrease compared to $23.890 billion for the same period in the prior year, which may contribute to controlling the cash outflows of the company.
Share Repurchase Program: Alphabet continued to return value to shareholders through an aggressive share buyback program, repurchasing $15.918 billion in shares for the quarter and $46.156 billion for the nine months ending September 30, 2023.
Forward Commitments: The company had future fixed or minimum guaranteed commitments related to content licensing agreements amounting to $11.1 billion as of September 30, 2023, which are primarily payable over the next seven years ending in the first quarter of 2030.
Legal and Regulatory Position: Alphabet addressed ongoing legal and regulatory issues, including various international antitrust investigations and claims related to intellectual property and privacy. They have taken necessary actions where applicable and continue to cooperate with regulatory bodies.
The financial outlook for Alphabet reflects a positive trend in revenue growth and operational performance. The company's strategic focus on optimizing costs and investing in future growth initiatives illustrates their continued commitment to enhancing shareholder value and maintaining a robust market standing.
Alphabet Inc. has gained attention for its response to regulatory pressures and innovations in artificial intelligence (AI), both of which significantly impact its outlook. In the realm of regulatory adjustments, Alphabet's Google has obliged to payment settlements and operational changes in response to antitrust lawsuits, indicating an industry-wide move toward fostering competition and challenging established tech giants' market positions.
Recently, Alphabet Inc. came to a significant settlement, resulting from an antitrust lawsuit actioned by all 50 U.S. state attorneys general. As noted in reports, Google has agreed to pay a $700 million sum and will make consequential changes to the Play Store's billing practices. According to Forbes, dated December 19, 2023, $630 million of the settlement will benefit consumers, and the rest is allocated to state funds. This comes post a legal defeat against Epic Games, focusing on anti-competitive issues surrounding Google's Play Store, where Alphabet Inc. voiced intentions to appeal the court decision. This settlement also requires Alphabet to modify its payment system and simplify app downloading processes.
The settlement's terms allow developers to inform users of alternative purchasing avenues outside the Play Store. Moreover, developers can now implement their own payment systems, bypassing Google's services, which could lead to cost savings for consumers. Forbes reported the introduction of 'user choice billing,' with developer fees cut to between 11% and 26%, accompanied by Google's commitment to streamline the sideloading process a move allowing app installations directly from the internet.
Notwithstanding these changes, critics like Epic Games perceive the settlement as insufficient, planning further legal actions to challenge Google's operations. The industry-wide regulatory trend is accelerating, with an emphasis on encouraging competition.
As for Alphabet's prospects and stock performance, several reports suggest a positive trajectory, especially in the context of AI a sector where Alphabet competes vigorously, particularly with Microsoft. AI has the potential to revolutionize Alphabet's various business segments, including ad sales, YouTube, and cloud services. Investment analysts, as mentioned in reports by The Motley Fool, point to Alphabet's stock as a favorable investment based on its competitive AI position and current trading multiple relative to its peers known as the 'MAG7'. Reports from S&P Global Market Intelligence credited Alphabet's share price increase majorly to its advancements in AI technologies which could further harness generative AI for improved ad targeting and customer engagement.
Alphabet's financial robustness is also recursive, with the company achieving $77 billion in free cash flow in 2023, surpassing that of its competitors. While Sean Williams from The Motley Fool projected a 36% stock increase, the broader market performance appeared diversified, and according to Jeff Saly's analysis on YouTube, 2024 may shift focus from a few large-cap stocks to a broad spectrum of investment opportunities.
The challenges and strategies related to generative AI have been central to Alphabet's direction. With the introduction of AI projects like Bard and the upcoming Gemini, Alphabet admitted prior mistakes but also reaffirmed its commitment to the field. In contrast, competitors like OpenAI, with Microsoft as a significant backer, have undergone leadership changes that could impact their AI roadmaps.
In terms of AI's role in market dynamics, the investment sentiment conveyed by interviewee Jeff Saly recognizes AI as a marginal growth driver but already priced into stocks. Market diversification has led to an equally weighted S&P 500 outperforming the cap-weighted version, which is a phenomenon attributed to the rise in small caps and shifting focus from tech giants.
Amidst Alphabet's legal concessions and tech advancements, the company has also faced international challenges, as evidenced by a fine imposed by Russia for content deemed at odds with local legislation. As reported by Forbes journalist Zachary Folk, this fine highlights the complex interplay of global content policies and underscores Alphabet's potential navigational challenges in international content regulation.
Alphabet Inc. finds itself at an intersection of rigorous regulatory pressures and cutting-edge technological developments. Its strategies to navigate antitrust settlements while actively participating in the ever-evolving AI landscape illustrate the company's role as a primary player in tech, faced simultaneously with incredible opportunity and heightened accountability. As Alphabet continues adjusting Google's Play Store practices and pushing the envelope in AI, all eyes remain on how these changes will translate into consumer benefits, industry competition, and investor returns.
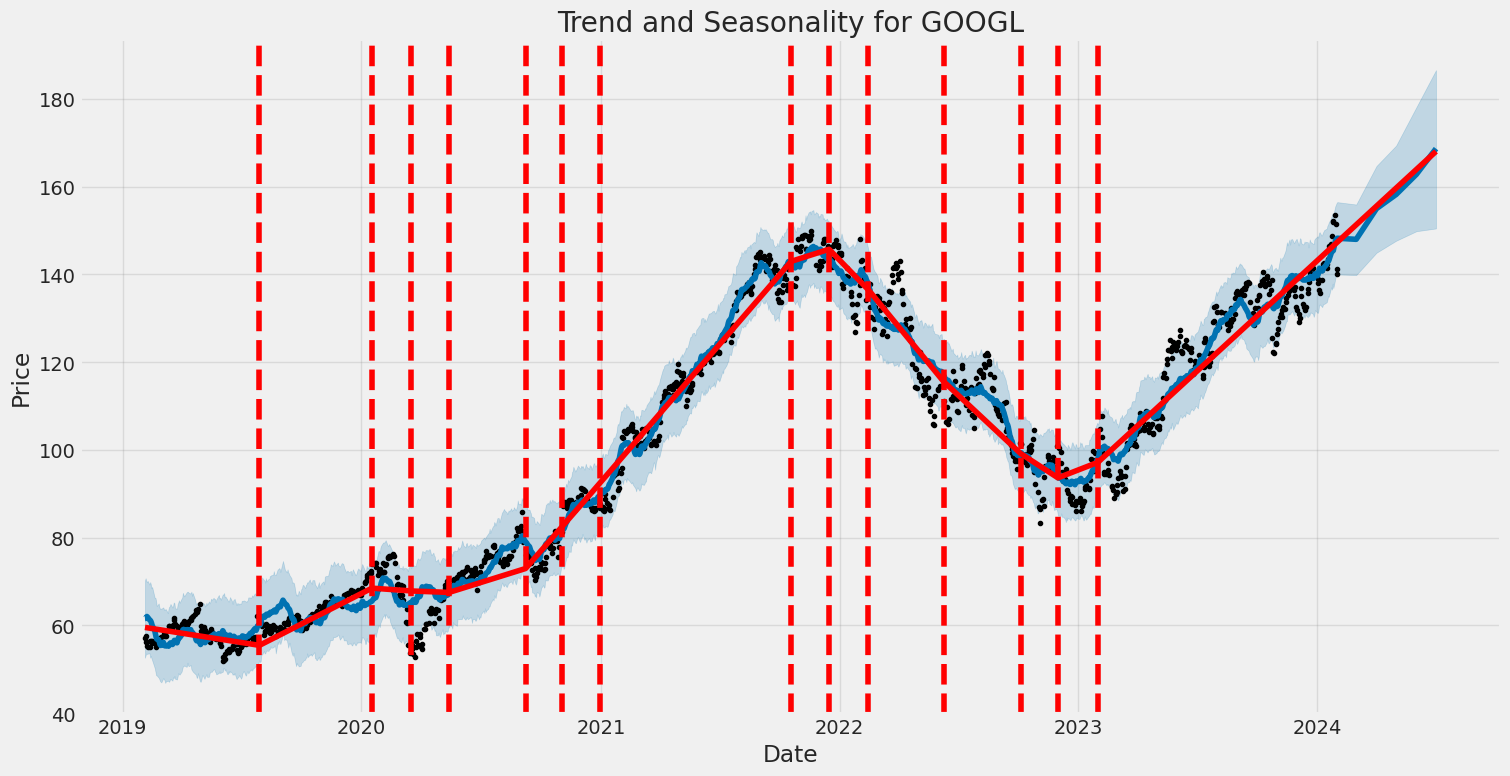
Alphabet Inc. (GOOGL) experienced varying levels of fluctuations in stock price between February 2019 and February 2024, as indicated by an ARCH volatility model applied to that period. The model suggests that there was significant movement away from the mean stock price, as the large coefficient for the 'omega' value in the volatility model indicates persistent volatility over time. Moreover, the alpha[1] value signifies that past volatility had a substantial impact on future volatility, pointing to a pattern where large changes in stock price were likely followed by similarly large changes, reflecting a sort of momentum in the volatility.
| Statistic Name | Statistic Value |
|---|---|
| R-squared | 0.000 |
| Log-Likelihood | -2,620.73 |
| AIC | 5,245.46 |
| BIC | 5,255.73 |
| No. Observations | 1,257 |
| omega | 3.0540 |
| alpha[1] | 0.2610 |
To analyze the financial risk associated with a $10,000 investment in Alphabet Inc. (GOOGL) over a one year period, an integration of volatility modeling and machine learning predictions can be employed. Volatility modeling, particularly the one that leverages the Generalized Autoregressive Conditional Heteroskedasticity approach, is a statistical tool used to estimate the level of financial volatility based on previous price data. This model is adept at capturing the volatility clustering commonly observed in financial time series, where high-volatility events tend to follow high-volatility events, and low-volatility events tend to follow low-volatility events.
Using the volatility model on historical stock price data from Alphabet Inc., we can extract a measure of the stock's volatility over time. This volatility measure indicates the degree of variation in Alphabet Inc.'s stock returns, which encapsulates the risk inherent in the stock's price movements. Higher volatility implies higher risk, as the stock price is more unpredictable. To calculate the Value at Risk (VaR), the model's output can be employed to estimate the maximum expected loss at a specific confidence level, in this case, at 95%. VaR translates these volatility estimates into a monetary value that an investor could expect to lose, with 95% certainty, on their investment over a given time period.
Additionally, machine learning predictions can be utilized to provide future return forecasts. A machine learning model such as a decision tree ensemble method can take numerous variables into account, including historical returns and myriad market indicators, to predict the direction and magnitude of future stock returns. Once trained on past data, this model can generate predictions that incorporate complex patterns and relationships within the financial data that might be missed by traditional linear models or human analysis.
Combining the volatility model's risk assessments with the return predictions of the machine learning model facilitates a more well-rounded view of the stock's financial risk. The machine learning model may also help account for non-linear dynamics and potential structural breaks in the time series data that a traditional volatility model might not fully capture.
With regards to the specific case of Alphabet Inc., the volatility modeling yields a Value at Risk (VaR) of $301.64 for a $10,000 investment at the 95% confidence interval. This suggests that, over the course of a year, there is a 95% chance that the most an investor would expect to lose is $301.64 due to normal market fluctuations. It's a relatively small portion of the total investment, indicating that while there is risk associated with investing in Alphabet Inc., the volatility modeling does not predict extreme risk as per the historical stock price behavior.
When the potential returns as predicted by the machine learning model are considered alongside the VaR, an investor can better gauge the potential upside against the quantified risk, contributing to a more informed investment decision. However, it's crucial for investors to also take into account that past performance and model predictions are not guarantees of future results, and various market conditions and external factors could influence actual outcomes.
Similar Companies in Internet Content & Information:
Alphabet Inc. (GOOG), Report: Twilio Inc. (TWLO), Twilio Inc. (TWLO), Snap Inc. (SNAP), Baidu, Inc. (BIDU), Report: Meta Platforms, Inc. (META), Meta Platforms, Inc. (META), Pinterest, Inc. (PINS), Tencent Holdings Limited (TCEHY), Microsoft Corporation (MSFT), Report: Amazon.com, Inc. (AMZN), Amazon.com, Inc. (AMZN), Report: Apple Inc. (AAPL), Apple Inc. (AAPL), Salesforce, Inc. (CRM), IBM Corporation (IBM), Oracle Corporation (ORCL), SAP SE (SAP), Adobe Inc. (ADBE), Twitter, Inc. (TWTR), Tencent Music Entertainment Group (TME), Spotify Technology S.A. (SPOT)
https://www.fool.com/investing/2023/12/18/alphabet-jumped-again-today-thanks-to-ai-is-the-st/
https://www.fool.com/investing/2023/12/19/better-artificial-intelligence-ai-stock-alphabet-v/
https://seekingalpha.com/article/4658644-naval-task-force-japanese-takeover
https://www.youtube.com/watch?v=4NEZeH7uGJY
https://www.youtube.com/watch?v=YznWa3ZAUwk
https://www.youtube.com/watch?v=-rRj6lHf1tE
https://www.youtube.com/watch?v=xEY16-vWlBw
https://www.youtube.com/watch?v=dpzbDgiE3qY
https://www.fool.com/investing/2023/12/20/3-faang-stocks-30-to-53-upside-in-2024-wall-street/
https://www.fool.com/investing/2023/12/20/alphabet-just-said-checkmate-to-microsoft-but-here/
https://www.fool.com/investing/2023/12/20/why-alphabet-stock-was-climbing-today/
https://www.fool.com/investing/2023/12/20/alphabet-stock-climbed-again-today-thanks-to-ai-is/
https://www.sec.gov/Archives/edgar/data/1652044/000165204423000094/goog-20230930.htm
Copyright © 2024 Tiny Computers (email@tinycomputers.io)
Report ID: RFevNo
Cost: $0.84673
https://reports.tinycomputers.io/GOOGL/GOOGL-2024-02-01.html Home