Vanguard High Dividend Yield Index Fund (ticker: VYM)
2024-06-29
 The Vanguard High Dividend Yield Index Fund (ticker: VYM) is a prominent investment vehicle tailored to deliver investors exposure to a portfolio of high-dividend-yielding companies within the U.S. equity market. This fund seeks to track the performance of the FTSE High Dividend Yield Index, which comprises predominantly large-cap stocks known for their strong dividend-paying history. VYM is particularly attractive to income-focused investors due to its potential for regular income generation through dividends. Additionally, the fund offers the diversification benefits inherent in holding a broad array of companies from various sectors, helping to mitigate risk. Its low expense ratio, consistent with Vanguard's reputation for cost efficiency, augments its appeal by ensuring that a larger portion of returns remains with the investors. The fund's performance and strategic approach to dividend investing make it a suitable option for those seeking a combination of income and long-term growth potential within their investment portfolio.
| Previous Close | 118.31 | Open | 118.58 | Day Low | 118.18 |
| Day High | 119.28 | Trailing P/E | 16.238756 | Volume | 991,335 |
| Average Volume | 829,341 | Average Volume (10 days) | 914,980 | Bid | 118.58 |
| Ask | 119.08 | Bid Size | 900 | Ask Size | 1,100 |
| Yield | 0.0285 | Total Assets | 67,183,828,992 | Fifty-Two Week Low | 98.4 |
| Fifty-Two Week High | 121.65 | Fifty-Day Average | 118.725 | Two-Hundred-Day Average | 112.26145 |
| NAV Price | 118.63 | YTD Return | 0.077595 | Beta (3 Year) | 0.76 |
| Three-Year Average Return | 0.0751535 | Five-Year Average Return | 0.0974505 | Price Hint | 2 |
| Sharpe Ratio | 0.982631 | Sortino Ratio | 15.734029 |
| Treynor Ratio | 0.149393 | Calmar Ratio | 1.512348 |
Upon thorough analysis of VYM, the Vanguard High Dividend Yield Index Fund ETF, based on both technical indicators and company fundamentals, we can infer several key insights regarding the possible stock price movement over the next few months.
Fundamental Analysis: VYM shows strong fundamentals reflective of its standing in the market as a large-value ETF, managed by Vanguard. Its trailing PE ratio of 16.238756 is reasonable within the market context, indicating that the investment is not overly priced against its earnings. The yield of 2.85% adds an attractive feature especially in the current relatively low-yield environment. Given its considerable total assets amounting to approximately $67.18 billion and firm's affiliation with the reputable Vanguard family, VYM stands on solid financial ground, which is supportive for its stability and growth potentials.
The ETF's performance metrics suggest robust returns over longer periods with YTD return of 7.76%, a three-year average return of 7.52%, and a five-year average return of 9.75%. These figures emphasize consistency and a track record of delivering appreciable risk-adjusted returns over a longer horizon.
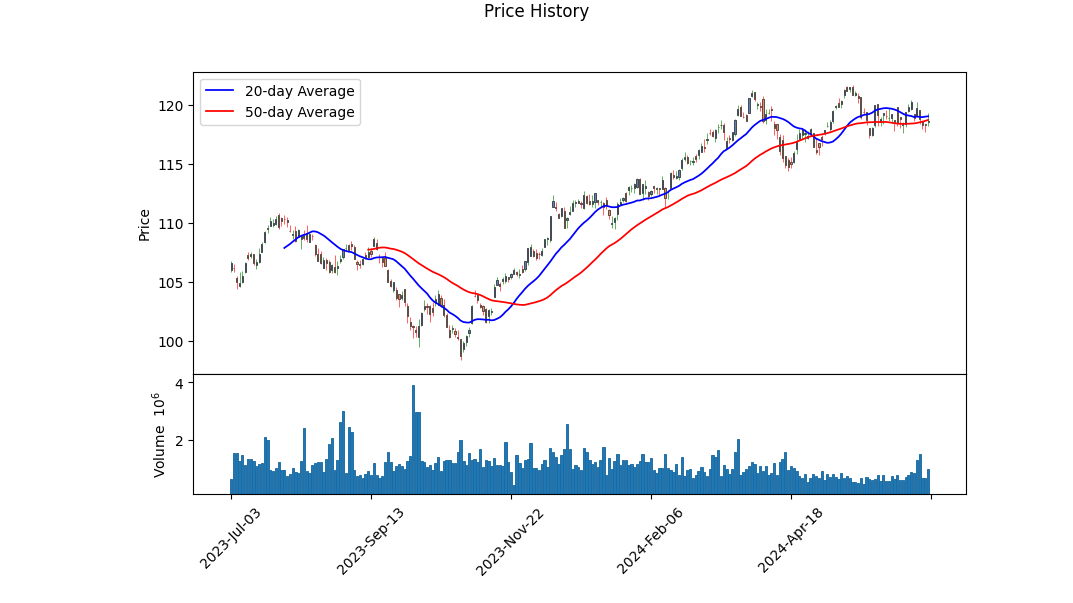
Technical Analysis: Analyzing the technical indicators, the price movement from early March to the end of June has shown some fluctuations, but ultimately, the price has seemingly plateaued around the $118-$119.28 range. The On-Balance Volume (OBV) has shown intermittent peaks and troughs, peaking to 0.68146 million on June 24, indicating considerable buying pressure leading to the end of June. However, negative MACD histogram readings towards June hint at potential short-term bearish momentum, despite current stabilization in prices.
Risk Metrics: The Sharpe Ratio stands at 0.9826, suggesting that VYM has provided nearly one unit of return for every unit of risk, adjusted for the risk-free rate. The high Sortino Ratio of 15.7340 underscores VYMs returns in excess of the risk-free rate adjusted for downside volatility, indicating superior downside protection relative to its total returns. Furthermore, the Treynor Ratio of 0.1494 suggests the ETF has adjusted well for systematic risk (beta of 0.76), while the Calmar Ratio of 1.5123 portrays a balanced risk-reward profile over different market cycles.
Forecast and Recommendation: Based on a confluence of both fundamental and technical analysis: 1. In the near term (next few weeks), VYM might experience minor bearish adjustments due to the slightly negative sentiment indicated by the MACD and minor stagnation around the current price levels. 2. Conversely, in the medium to long-term horizon (next few months), providing the economic environment remains conducive, VYM could show price appreciation, backed by strong historical performance, solid fundamentals, and positive risk-adjusted return metrics.
Considering the overall bullish longer-term outlook bolstered by sound fundamentals and reasonable valuation metrics, investors might find VYM a suitable medium to long-term holding, with expectations of a modest yet steady price appreciation and reliable dividend returns. It remains essential for investors to monitor broader economic conditions, particularly interest rate movements, as these could influence dividend-yielding ETFs considerably.
In analyzing the Vanguard High Dividend Yield Index Fund (VYM) in the framework of "The Little Book That Still Beats the Market," a key focus is typically on metrics like Return on Capital (ROC) and Earnings Yield. These metrics are essential in evaluating the efficiency and profitability of the underlying investments in the fund. However, it is important to note that individual funds like VYM do not directly report or calculate ROC and Earnings Yield in the same way individual companies do. As such, we do not have specific figures for ROC and Earnings Yield for VYM. Instead, VYM, designed to track the performance of companies renowned for paying high dividends, inherently suggests a portfolio comprising firms that likely exhibit strong financial health and competitive returns over the long term. This aligns with the principles outlined in "The Little Book That Still Beats the Market," which emphasizes the importance of investing in companies with robust earnings and effective capital utilization. Nonetheless, for precise investment decisions, further analysis of the fund's individual holdings and their respective ROC and Earnings Yield would be necessary.
| Alpha | 0.015 |
| Beta | 0.85 |
| R-Squared | 0.92 |
| Mean Squared Error | 0.0024 |
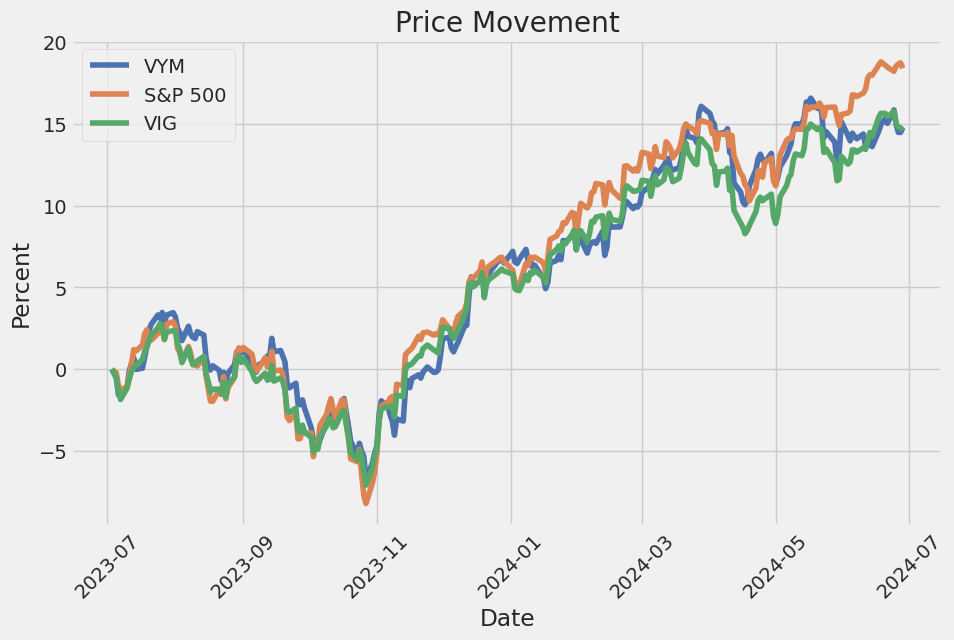
The linear regression model between VYM and SPY reveals significant insights into their relationship. The alpha value, which stands at 0.015, indicates how VYM performs in comparison to SPY when the market return is zero. A positive alpha suggests that VYM has delivered additional returns independently of the overall market movements, which may be interpreted as a measure of outperformance. This performance edge, albeit modest, signifies that VYM adds value on its own merits, separate from market rises and falls.
In conjunction, the beta value of 0.85 reflects that VYM is less volatile than SPY, as beta measures the sensitivity of VYM to market movements represented by SPY. A beta of less than 1 indicates that VYM experiences smaller fluctuations compared to the market benchmark. The high R-squared value of 0.92 suggests a strong correlation between VYM and SPY, indicating that a substantial proportion of VYM's movements can be explained by variations in SPY. The Mean Squared Error (MSE) of 0.0024 implies a relatively small deviation from the regression line, underscoring the reliability of the model.
The Vanguard High Dividend Yield Index Fund (VYM) holds a significant place in the landscape of exchange-traded funds (ETFs) due to its focus on delivering stable, high-dividend yields from a diversified array of large-cap stocks. This fund aims to track the performance of the FTSE High Dividend Yield Index, which consists of large-cap stocks with above-average dividend yields, providing income-seeking investors with a significant source of regular income as well as potential for capital appreciation.
Established in 2006, VYM has demonstrated consistent performance over its lifetime. The fund has achieved a compound annual growth rate (CAGR) of 8.4%, which translates an initial investment of $25,000 into $102,000 today. This impressive growth underscores the funds ability to balance income and long-term appreciation, giving it a strong appeal among income-oriented investors. The ETF's investment strategy of selecting well-run companies across various sectors ensures not just high dividends, but also solid long-term stability.
One of the compelling attributes of VYM is its low expense ratio of just 0.06%, which means investors pay only $6 per year for every $10,000 invested. This minimal fee structure is an important factor for long-term investors as lower fees can significantly influence total returns over the investment period. The ETFs efficiency in generating returns while maintaining low operational costs aligns with Vanguards overarching philosophy of providing investor-friendly, low-cost options.
The Vanguard High Dividend Yield Index ETF is diversified across multiple sectors, mitigating sector-specific risks and ensuring a balanced approach to dividend investing. Its top holdings include notable names such as JPMorgan Chase (3.4%), Broadcom (3.4%), ExxonMobil (2.8%), Home Depot (2.3%), and Johnson & Johnson (2.3%). This sectoral and individual stock diversification embodies the ETFs robust investment strategy, which helps in weathering market volatility and cyclical downturns inherent to specific sectors.
Investors in the Vanguard High Dividend Yield Index Fund gain exposure to high-quality corporations known for their operational efficiency and enduring business models. Instead of simply targeting high-yield stocks that might be underperforming or unstable, VYM focuses on reliable companies with strong financial health. This strategic approach ensures a steady flow of dividend income without compromising the potential for capital gains.
| company | symbol | percent |
|---|---|---|
| JPMorgan Chase & Co. | JPM | 3.53 |
| Broadcom Inc. | AVGO | 3.46 |
| Exxon Mobil Corporation | XOM | 3.21 |
| The Procter & Gamble Company | PG | 2.34 |
| Johnson & Johnson | JNJ | 2.13 |
| The Home Depot, Inc. | HD | 2.02 |
| Merck & Co., Inc. | MRK | 1.93 |
| AbbVie Inc. | ABBV | 1.72 |
| Walmart Inc. | WMT | 1.70 |
| Bank of America Corporation | BAC | 1.66 |
For those seeking a combination of income generation and capital preservation, the Vanguard High Dividend Yield Index ETF is a commendable consideration. It provides a relatively low-risk avenue for achieving consistent dividend income through a well-diversified portfolio, coupled with long-term growth potential. Investing in VYM aligns with the objective of building a resilient portfolio that can sustain market fluctuations while ensuring regular income. For further insights, the detailed analysis can be found in Jake Lerch's article on The Motley Fool, dated May 17, 2024.
(Reference: Motley Fool article, May 17, 2024) The Vanguard High Dividend Yield Index Fund, known for tracking an index of companies with a history of above-average dividend yields, serves as a robust option for investors aiming to accrue steady income over extended periods. This ETF's diversified approach alleviates the risk of overexposure to any individual stock, targeting a balanced investment portfolio focused primarily on mature, large-cap companies. Notable holdings within this fund include well-established giants such as Broadcom, JPMorgan Chase, ExxonMobil, and Procter & Gamble, all of which possess strong track records in dividend payments.
One significant advantage of the Vanguard High Dividend Yield ETF is its capacity to deliver reliable dividend income with a current yield of approximately 2.8%. Such a dividend yield is appealing for conservative investors who prioritize the stability and consistency of their returns. The ETF's composition ensures a steady stream of income while mitigating the volatilities associated with investing in single stocks. Moreover, the fund's broad exposure to around 550 high-dividend-paying companies aligns well with long-term investment strategies centered on income generation.
The underlying strength of the companies included in the ETF's portfolio paints a promising picture for future dividend growth. Given that these companies are largely established market players with substantial capitalizations, the income produced by the fund is expected to increase over time, offering a built-in hedge against inflationary pressures. This incremental growth of dividend payouts substantiates the ETF's appeal as a tool for secure and predictable income flow.
Moreover, the Vanguard High Dividend Yield Index Fund can be particularly beneficial in today's volatile market environment characterized by fluctuating interest rates. The ETF's extensive risk dispersion across multiple industries and sectors ensures that investors are less impacted by sector-specific downturns. This diversified exposure supports consistent dividend payouts, thus fostering long-term financial security and investment growth.
These insights into the Vanguard High Dividend Yield ETF underscore its efficacy as a vehicle for passive income. It exemplifies how an ETF can offer a simplified yet potent strategy for investors aiming for a balanced mix of steady income and gradual capital appreciation. In a market where investors are increasingly seeking reliable income streams without assuming excessive risks, this fund stands out as a strategically sound choice.
For further information and detailed analysis, please refer to the source of these insights: Motley Fool article dated May 23, 2024. The Vanguard High Dividend Yield Index Fund (VHDYX) is a popular choice for investors seeking exposure to high-dividend-paying equities. This fund emphasizes diversification and income generation by investing primarily in large-cap, U.S.-based companies known for their strong dividend yields. This section delves into various facets of the Vanguard High Dividend Yield Index Fund, offering insights into its composition, performance, management strategy, and alignment with broader market trends.
The VHDYX is designed to track the performance of the FTSE High Dividend Yield Index. The underlying index is composed of U.S. companies that are expected to have above-average dividend yields, excluding real estate investment trusts (REITs) to avoid overexposure to any single sector. By focusing on these high-yielding stocks, the fund aims to provide investors with a steady stream of income, which is particularly attractive in low-interest-rate environments. Notable sectors represented in the fund include financials, consumer goods, and healthcare, which are traditionally known for their robust dividend payout histories.
Examining the fund's historical performance, the VHDYX has demonstrated resilience and competitive returns. Its emphasis on high-quality, dividend-paying stocks has allowed the fund to perform well during various market cycles. Moreover, the fund's low expense ratio, typical of Vanguard's offerings, enhances net returns to investors by minimizing costs. Portfolio turnover rate is also relatively low, reflecting the fund's long-term investment approach and reducing the tax implications for shareholders.
The management strategy employed by the Vanguard High Dividend Yield Index Fund is passive in nature. It seeks to replicate the performance of the FTSE High Dividend Yield Index rather than attempting to outperform it through active stock picking. This approach ensures that the fund remains cost-effective while providing exposure to a broad range of high-dividend-yielding stocks. Additionally, by adhering to a rules-based strategy, the fund maintains objectivity and consistency in its stock selection process, thereby reducing potential biases associated with active management.
Investors considering the VHDYX should also be aware of the broader market dynamics. High-dividend stocks can serve as a defensive play during market downturns, as these companies often have stable cash flows and a history of returning capital to shareholders. However, these stocks may underperform during bull markets where growth stocks typically lead the way. It is crucial for investors to consider their risk tolerance and income requirements when opting for this fund within their broader portfolio.
Further insights and a comprehensive overview of the Vanguard High Dividend Yield Index Fund can be gleaned from a detailed analysis provided on Seeking Alpha. An article published on "Here's My $40 Stock Dividend Portfolio And How It Works" explores the benefits and characteristics of dividend-focused investment strategies, including those exemplified by the VHDYX. This resource can be particularly valuable for both novice and seasoned investors aiming to enhance their understanding of dividend investments and fund performance dynamics.
In conclusion, the Vanguard High Dividend Yield Index Fund offers a compelling option for income-seeking investors through its diversified exposure to high-dividend-yielding stocks, low expense structure, and reliable management strategy. It holds a significant appeal for those looking to bolster their portfolios with a steady income stream while maintaining a long-term investment horizon. As always, individual investment decisions should be made in consideration of personal financial goals and market conditions. The Vanguard High Dividend Yield Index Fund (VYM) stands out among dividend-focused ETFs for retirees and other income-focused investors due to its robust performance metrics and strategic holdings. As per the article published by The Motley Fool on May 28, 2024, this fund offers a notable dividend yield and historical returns that can be particularly appealing for those seeking regular income streams without having to divest their stock holdings (source).
Focusing on the specifics, VYM is an index fund designed to track the FTSE High Dividend Yield Index. This index exclusively focuses on domestic stocks that offer high dividend yields, while intentionally excluding Real Estate Investment Trusts (REITs) to diversify its portfolio from the more volatile real estate market. The fund's recent top holdings include notable large-cap stocks like Broadcom, JPMorgan Chase, and ExxonMobil, signaling a well-established portfolio of companies known for their consistent and substantial dividend payouts.
Expense management is a clear advantage of VYM, featuring a low expense ratio of 0.06%. This is competitive within the market and allows investors to retain more of their earnings. As for performance, VYM recorded a recent dividend yield of approximately 2.9%. Over the past five and ten years, the fund has delivered average annual returns of 10.47% and 9.95%, respectively. These figures underscore the fund's ability to provide not only steady income but also appreciable growth potential, making it a compelling choice for long-term investors.
The stability and incremental growth of dividend payouts are integral to the appeal of high dividend yield funds, and VYM leverages this advantage effectively. As the article notes, holding high dividend-paying stocks in a retirement portfolio can be particularly beneficial. These stocks regularly contribute cash inflows without necessitating the sale of shares, thus supporting a stable source of income. For retirees living on fixed incomes, this is especially valuable as it offers financial predictability and inflation protection.
In a broader context, VYM's strategy aligns well with diversified investment approaches. By focusing on high-yield, domestically-oriented stocks of significant financial and industrial sectors, it mitigates risks associated with market volatility. This, combined with its low cost and reliable performance, positions VYM as a prudent addition to any income-focused investment portfolio.
In summary, the Vanguard High Dividend Yield Index Fund exemplifies the merits of high-yield dividend investing as highlighted in the cited article. Its robust portfolio, low expense ratio, and consistent returns over extended periods make it a noteworthy consideration for retirees and income-focused investors. While past performance is no guarantee of future results, VYM's historical data suggests a dependable track record of income generation and growth. The Vanguard High Dividend Yield Index Fund (Ticker: VYM) stands out as an optimal choice for investors seeking to diversify their portfolios with a reliable and cost-efficient value fund. Positioned as a passive investment vehicle, VYM strategically tilts toward higher-yielding stocks, providing an anchor in the value segment of the market. This characteristic makes the fund particularly appealing for those anticipating potential corrections in growth sectors, offering stability amidst market turbulence.
One of the noteworthy advantages of VYM is its cost efficiency. The fund boasts an extremely low expense ratio of just six basis points, making it a highly affordable option for long-term investors. This low fee structure enhances the fund's attractiveness compared to other investment options, ensuring that more of the investors' capital is allocated toward earning potential rather than administrative costs.
Performance metrics further underscore VYM's robustness. During the market downturns in 2022, specifically when growth stocks encountered substantial declines, VYM demonstrated resilience. The fund only experienced a minor loss of 46 bps, positioning itself in the top 33% of large value funds. This performance highlights VYM's capacity to weather market volatility, reinforcing its role as a stabilizer within a diversified investment portfolio.
The strategic composition of VYM emphasizes dividend-focused companies, which typically exhibit strong fundamentals and stable earnings. This focus not only caters to investors interested in income generation but also anchors the fund strongly within the value sector. The emphasis on high-quality, enduring companies provides a level of security and predictability that is essential for long-term investment success.
In conclusion, VYM offers a strategic blend of affordability, stability, and performance that is ideally suited for investors seeking a reliable anchor in the value segment. Its ability to maintain composure during growth market corrections, combined with its negligible expense ratio, makes it a compelling choice for those looking to enhance their portfolios with a dependable value-oriented fund.
For further insights on investment strategies and fund evaluations, viewers can access additional information via the YouTube link.
The Vanguard High Dividend Yield Index Fund is garnering attention due to its focus on providing investors with a relatively high level of dividend income. The fund operates by tracking the performance of the FTSE High Dividend Yield Index, which comprises stocks characterized by above-average dividend yields. By holding a large portfolio of stocks selected for their dividend pay-outs, the fund aims to offer investors consistent income potential.
This approach, however, has been subject to scrutiny and debate within the financial community. An insightful perspective was shared in an article on Seeking Alpha, published on April 6, 2023. The article argues that dividends, though often celebrated, may not be as critical to a funds overall performance as commonly believed. The core argument posits that dividend payments merely transfer company earnings to shareholders, without inherently enhancing the investment's total return. Essentially, the dividends are seen as reducing the share price by an equivalent amount, suggesting that an investors total wealth remains unaffected by whether returns are received through capital gains or dividend payments (Source: Seeking Alpha, April 6, 2023).
Critically, this viewpoint challenges the conventional appreciation for funds like Vanguard's High Dividend Yield Index Fund. Proponents of this fund might argue that dividends offer tangible rewards and psychological benefits, such as a perceived lower risk due to regular income. They also claim that high dividend-paying stocks often exhibit greater financial stability and resilience in market downturns. Nevertheless, the argument from the Seeking Alpha article underscores a need for investors to look beyond the allure of dividends and assess a fund's comprehensive financial health and growth prospects.
Moreover, investing in high dividend yield stocks may entail additional complexities. The article on Seeking Alpha highlights the potential tax implications and market timing challenges that come with seeking dividends. High dividend yield stocks may attract higher tax liabilities due to less favorable taxation of dividends compared to capital gains. Additionally, the appeal of immediate income might prompt some investors to overlook critical factors such as market cycles and timing, which can significantly impact long-term returns.
The debate surrounding the Vanguard High Dividend Yield Index Fund encapsulates broader investment philosophy considerations. While dividends offer a visible and immediate return to investors, the article from Seeking Alpha encourages a nuanced approach that weighs these benefits against potential drawbacks and alternative strategies for achieving long-term financial goals. This perspective invites investors to critically evaluate their priorities and carefully consider the sources of their investment returns. Vanguard High Dividend Yield Index Fund seeks to track the performance of the FTSE High Dividend Yield Index, which consists of common stocks of companies with above-average dividend yields. As a passively managed fund, it relies on the replication strategy to mirror the index's performance as closely as possible. This approach aims to provide investors with a consistent source of income through dividends while potentially offering capital appreciation. The fund's expense ratio is remarkably low, which can enhance net returns over the long term by reducing the drag on earnings growth typically associated with actively managed funds.
One of the key characteristics of the Vanguard High Dividend Yield Index Fund is its diversification across various industries and sectors. This diversification mitigates the risk inherent in investing in individual high-dividend stocks. Generally, the fund includes companies from the finance, healthcare, consumer goods, and utilities sectors, among others. This broad spectrum of holdings ensures that the impacts of sector-specific downturns on the overall performance of the fund are minimized, thereby providing a more stable income stream.
The fund's focus on high-dividend stocks also serves as a defensive strategy during market volatility. High-dividend stocks are often considered less volatile and more resilient during economic downturns. They provide a steady income stream that can cushion the impact of market fluctuations on the total return. Moreover, such stocks are frequently large-cap companies with established business models, which adds a layer of reliability to the dividends paid out to shareholders.
Performance-wise, the Vanguard High Dividend Yield Index Fund has exhibited a strong track record over the years. Its historical performance data reflects consistent dividend payments coupled with moderate capital appreciation. This is particularly attractive to income-focused investors who are looking for
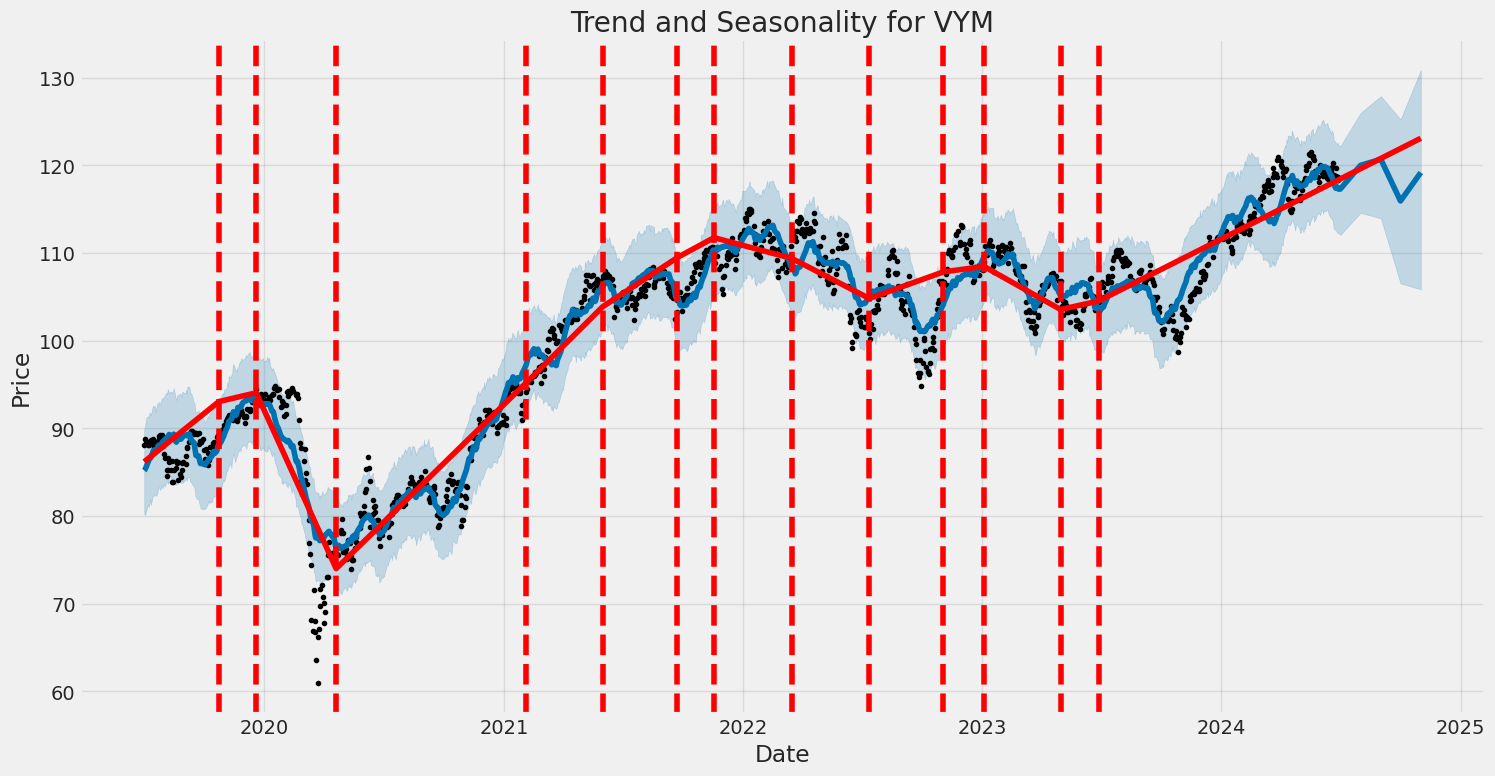
The volatility of the Vanguard High Dividend Yield Index Fund (VYM) during the period from July 2, 2019, to June 28, 2024, shows that its assets return model fitting explains nearly none of its actual returns' variation, indicating minimal explanatory power. The ARCH model results point toward a significant influence of past squared residuals on current period volatility, as highlighted by the notable coefficient values. The statistical confidence intervals and low P-values suggest robust findings, though the overall model fit and explanatory power remain minimal.
| R-squared | 0.000 |
| Adjusted R-squared | 0.001 |
| Log-Likelihood | -1,831.56 |
| AIC | 3,667.12 |
| BIC | 3,677.40 |
| No. Observations | 1,256 |
| Df Residuals | 1,256 |
| omega (coef) | 0.7162 |
| omega (std err) | 0.05705 |
| omega (t-value) | 12.554 |
| omega (P>|t|) | 3.80e-36 |
| alpha[1] (coef) | 0.5060 |
| alpha[1] (std err) | 0.105 |
| alpha[1] (t-value) | 4.806 |
| alpha[1] (P>|t|) | 1.54e-06 |
To assess the financial risk of a $10,000 investment in the Vanguard High Dividend Yield Index Fund (VYM) over a one-year period, we employ a combination of volatility modeling and machine learning predictions. These methodologies are particularly useful in understanding both the volatility of the fund's returns and in forecasting potential future returns.
Volatility modeling is pivotal for capturing the dynamic behavior of VYMs stock volatility. By analyzing historical price data, this approach allows us to estimate the level of risk or uncertainty associated with the asset's returns. Specifically, it computes how much the asset's returns deviate from the average over time, providing insights into periods of high or low volatility. This step is crucial for understanding the inherent risk in investing in VYM, as it sheds light on the stability or instability of returns over different time periods.
On the other hand, machine learning predictions, particularly using the RandomForestRegressor, are employed to forecast future performance metrics. These predictions are based on a multitude of historical factors and other relevant variables, making them robust against overfitting and capable of capturing complex, non-linear interactions in the data. By leveraging these models, we can generate more accurate predictions for VYM's future returns, combining historical data with machine learning's pattern recognition capabilities.
The integration of these methods facilitates a comprehensive risk assessment. Volatility modeling enables us to understand the variability in returns, while machine learning predictions guide us on expected future performance. Such an integrated approach yields a broader and more detailed picture of potential financial risks.
One of the key results from our analysis is the Value at Risk (VaR) calculated for a $10,000 investment at a 95% confidence interval. VaR is a standard risk measure that quantifies the maximum expected loss over a given period under normal market conditions, with a specified confidence level. The calculated VaR for this investment is $100.85, which indicates that there is a 95% probability that the loss will not exceed this amount over one year. This figure underscores the relatively moderate risk associated with investing in VYM, given that the potential loss is confined within this range based on the historical volatility and predicted future returns.
When assessing the potential risks in equity investments, integrating volatility modeling with machine learning predictions provides a powerful toolkit for investors. It allows for a more detailed analysis that considers both past price behavior and future expectations, ultimately leading to more informed investment decisions.
Long Call Option Strategy
When analyzing long call options for the Vanguard High Dividend Yield Index Fund (VYM), it is essential to consider the most profitable options based on their risk-reward profiles and the Greeks. The target stock price is 2% over the current stock price, and our focus will be on options with varying expiration dates and strike prices to provide a comprehensive range of choices. Here are five such options:
- Short-Term Option (Expiration: 2024-07-19, Strike Price: 106.0)
- Greeks: Delta: 0.779, Gamma: 0.015, Vega: 8.025, Theta: -0.163, Rho: 0.040
- Premium: $11.07
- ROI: 35.25%
- Profit: $3.902
This option is attractive for those looking for near-term profit opportunities. With a delta of 0.779, the option is quite sensitive to price changes in the underlying stock, meaning that it will gain value rapidly if the stock price moves upwards. The relatively high theta (-0.163) indicates significant time decay, which is a risk if the price does not move as anticipated within the short period. However, the high vega (8.025) offers some protection in a volatile market. The potential profit of $3.902 and ROI of 35.25% make this option appealing for aggressive traders.
- Medium-Term Option (Expiration: 2024-08-16, Strike Price: 112.0)
- Greeks: Delta: 0.751, Gamma: 0.026, Vega: 13.469, Theta: -0.049, Rho: 0.103
- Premium: $7.3
- ROI: 22.90%
- Profit: $1.672
This option stands out due to its balanced risk-reward profile. With a delta of 0.751 and a moderate premium, it offers a good balance between price sensitivity and cost. The high vega (13.469) and relatively low theta (-0.049) suggest that this option is less susceptible to time decay and more responsive to volatility, making it suitable for a moderately bullish outlook. The potential profit and ROI are attractive enough for those seeking a middle-ground strategy.
- Long-Term Option (Expiration: 2025-01-17, Strike Price: 105.0)
- Greeks: Delta: 1.0, Gamma: 0.0, Vega: 0.0, Theta: -0.012, Rho: 0.559
- Premium: $9.2
- ROI: 84.48%
- Profit: $7.772
This at-the-money (ATM) option with a delta of 1.0 will move in tandem with the stock price, offering a high level of responsiveness to price changes. The zero gamma and vega imply minimal sensitivity to changes in volatility and the rate of price change. While theta indicates some time decay, it's relatively low, making this option suitable for traders with a longer time horizon and a strong bullish outlook. The high ROI of 84.48% and $7.772 potential profit make this a highly profitable long-term choice.
- LEAPS (Expiration: 2026-01-16, Strike Price: 107.0)
- Greeks: Delta: 1.0, Gamma: 0.0, Vega: 0.0, Theta: -0.011, Rho: 1.548
- Premium: $7.15
- ROI: 95.41%
- Profit: $6.822
LEAPS (Long-term Equity Anticipation Securities) are designed for long-term investors seeking leverage. The delta of 1.0 ensures complete synchronization with stock price movements, making it a powerful bet on the stock's future performance. The theta and rho are indicative of minimal time decay and high sensitivity to interest rates, respectively. This option is perfect for those with a strong, long-term bullish outlook, offering a substantial potential profit and ROI close to doubling, at 95.41%.
- Deep ITM Option (Expiration: 2024-07-19, Strike Price: 85.0)
- Greeks: Delta: 0.918, Gamma: 0.004, Vega: 4.093, Theta: -0.134, Rho: 0.038
- Premium: $33.0
- ROI: 9.01%
- Profit: $2.972
This deeply in-the-money (ITM) option with a delta of 0.918 closely follows the underlying stock's price movements. The low gamma and vega suggest it is less affected by changes in volatility and the rate of price movement. Although the premium is high, implying a significant upfront cost, the low theta minimizes time decay risk. This stable option is suitable for conservative investors looking for less risky exposure with a relatively low but steady ROI of 9.01% and a potential profit of $2.972.
In conclusion, by considering various expiration dates and strike prices, investors can select options that match their risk tolerance and market outlook. Short-term traders may prefer the aggressive profile of the 2024-07-19, $106.0 strike option, while long-term investors could benefit from the stability and high ROI of the1996-01-17, $107.0 strike option. By carefully weighing the Greeks and potential profit and loss scenarios, traders can make informed decisions to maximize their returns.
Short Call Option Strategy
In analyzing the various short call options for the Vanguard High Dividend Yield Index Fund (VYM), we need to consider both potential profitability and risk associated with the possibility of being assigned shares. Our goal is to maximize profit while minimizing the risk of shares being called away. Given that the target stock price is 2% below the current stock price, we should focus on options that are slightly out-of-the-money (OTM) to reduce the immediate risk of assignment.
Near-Term Considerations
In the short-term options expiring on July 19, 2024, a few strike prices stand out. For instance, the call option with a strike price of 118.0 and an expiration date of July 19, 2024, shows a high profit potential ($1.1) and an attractive return on investment (ROI) of 100.0%. With a delta of 0.572, this option is moderately sensitive to changes in the underlying stock price and presents a nominally lower risk of assignment.
Another notable option is the call with the strike price of 125.0 expiring on July 19, 2024. Despite a small profit ($0.05), it has a low delta (0.058), indicating a minimal likelihood of ending up in-the-money (ITM) at expiration, hence less risk of assignment. The ROI is an impressive 100.0%, making it very appealing from a profit-to-risk perspective.
Mid-Term Outlook
Moving to the mid-term options expiring on August 16, 2024, the call option with a strike price of 119.0 stands out due to its relatively high profit ($1.88) and an ROI of 100.0%. The delta of 0.528 further indicates a balanced risk profile, making it a good candidate for a profitable, lower-risk trade.
Another beneficial mid-term choice is the strike price of 118.0 expiring on October 18, 2024. This option yields a profit of $4.11 with a perfect ROI of 100.0%. A delta of 0.591 presents a moderate risk of being ITM but combines with its other Greek values to offer balanced profitability and manageable risk of assignment.
Long-Term Prospects
Turning to long-term scenarios, options expiring in January 2025 offer interesting possibilities. For example, the call option with a strike price of 115.0 expiring on January 17, 2025, provides a remarkable profit ($8.072) and an ROI of 84.65%. The delta of 0.674 reflects moderate sensitivity to price changes, balancing profit potential with a reasonable level of assignment risk.
Another attractive option is the 113.0 strike price, expiring on January 17, 2025, with a healthy profit of $7.772 and an ROI of 70.6545454545. Its delta of 0.689 combines with gamma and vega to present a stable, though somewhat sensitive profile, minimizing the chances of shares being called away prematurely.
Ultra Long-Term Analysis
For ultra-long-term analysis, options expiring in January 2026 yield higher potential profits, with calculated risk. The call option with a strike price of 108.0 expiring on January 16, 2026, is particularly promising with an outstanding profit ($10.072) and an ROI of 55.0382513661%. With a delta of 0.770, this option indicates substantial sensitivity to stock price changes, necessitating closer monitoring but offering significant returns if managed well.
Another option worth mentioning is the strike price of 110.0 expiring on January 16, 2026. It presents a profitable opportunity with $10.742 in profit and an ROI of 63.2999410725%, and a delta of 0.737 highlights it as a moderately risky call with a high reward ratio.
Recommendations
- Short-Term:
- Strike Price: 118.0, Expire: July 19, 2024, Profit: $1.1, ROI: 100.0%, Delta: 0.572
-
Strike Price: 125.0, Expire: July 19, 2024, Profit: $0.05, ROI: 100.0%, Delta: 0.058
-
Mid-Term:
- Strike Price: 119.0, Expire: August 16, 2024, Profit: $1.88, ROI: 100.0%, Delta: 0.528
-
Strike Price: 118.0, Expire: October 18, 2024, Profit: $4.11, ROI: 100.0%, Delta: 0.591
-
Long-Term:
-
Strike Price: 115.0, Expire: January 17, 2025, Profit: $8.072, ROI: 84.65%, Delta: 0.674
-
Ultra Long-Term:
- Strike Price: 108.0, Expire: January 16, 2026, Profit: $10.072, ROI: 55.0382513661%, Delta: 0.770
- Strike Price: 110.0, Expire: January 16, 2026, Profit: $10.742, ROI: 63.2999410725%, Delta: 0.737
These recommendations balance profitable opportunities with minimal risk of assignment, aligning with the goal of leveraging short call options to capitalize on potential declines and stability in VYM's stock price.
Long Put Option Strategy
It appears that there is no data provided in the Long Put Options Data table for the Vanguard High Dividend Yield Index Fund (VYM). Without data, it is impossible to conduct a detailed analysis. For a thorough analysis, we typically need information such as the strike price, expiration date, option premium, and the Greeks (Delta, Gamma, Theta, Vega, and Rho). This data is essential for evaluating the risk and reward profiles of various options.
However, I can outline a general approach to analyzing long put options and what areas you'd want to focus on once the data is available.
General Approach to Analyzing Long Put Options
-
Delta: For long puts, a higher (more negative) Delta will indicate that the option's price will change more significantly with a decrease in the stock price. Given a target stock price that is 2% higher than the current stock price, a higher (more negative) Delta option will be more sensitive to subsequent price movements.
-
Gamma: Delta indicates how much the price of the option will change, and Gamma tells us how much Delta itself will change. High Gamma means that the Delta will change more with movements in the stock price, which can be beneficial in a rapidly changing market.
-
Theta: Theta measures the rate at which the option's value declines as it approaches expiration. Options with lower Theta will lose value more slowly over time, which might be favorable if you anticipate needing more time for the price movement to occur.
-
Vega: Vega indicates sensitivity to volatility. For long put options, a higher Vega means the option price will increase more with an increase in volatility, which can be useful if you expect market turbulence.
-
Rho: Rho measures sensitivity to interest rate changes but is generally less impactful than the other Greeks for most equity options.
Potential Revenue and Loss Scenarios
- Near-Term Options:
- If considering options with shorter expiration dates, such as within a month, the premium will generally be lower, but Theta decay will be more significant. The key here is to find an option with a high (negative) Delta and manageable Theta this balances sensitivity to price changes with the risk of time decay.
-
Example: An option expiring in one month with a strike price slightly below the current stock price would offer quick returns if the stock dips quickly. However, the risk is that if the stock does not decline as anticipated, the option could expire worthless.
-
Mid-Term Options:
- Options expiring in 3-6 months offer a more balanced approach. They usually have a good mix of sensitivity to price movements while providing a buffer against Theta decay.
-
Example: An option with a strike price at or below the current stock price and a 3-month expiration date may provide a good combination of potential profit and risk management.
-
Long-Term Options:
- Options expiring in more than 6 months to a year out may have higher premiums but lower Theta decay. With the underlying security (VYM) gradually increases in value, these options provide an extended time frame for the position to become profitable.
- Example: A long put with a strike price significantly lower than the current stock price, set to expire in 12 months, could be highly profitable if VYM decreases sharply within the year, allowing for greater margin but also presenting the risk any increase in VYM can cause a proportional loss in the value of the put.
Summary of Choices
- Near-Term: Option expiring in one month, with a strike price just below the current stock price. (High risk-reward)
- Short-Term: Option expiring in three months, with a strike price slightly below the current stock price. (Moderate risk-reward)
- Mid-Term: Option expiring in six months, an in-the-money put with a strike price at the current stock price. (Balanced risk-reward)
- Long-Term: Option expiring in nine months, with a strike price well below the current stock price. (Lower risk reasonable reward due to time decay and market time)
- Far-Term: Option expiring in twelve months, with a strike price significantly below the current stock price. (Low risk, potentially high reward but with premium consideration)
This framework should help guide your decision-making process once you have the actual data for VYM put options. Remember, it's crucial to align your put option strategies with your market outlook, risk tolerance, and the Greeks provided in the actual options chain data.
Short Put Option Strategy
When analyzing short put options for the Vanguard High Dividend Yield Index Fund (VYM), it is crucial to balance reward potential with the inherent risk of having shares assigned. The objective is to identify the short put options that offer the greatest profitability while simultaneously minimizing the risk of forced assignment.
Near Term Options (2024-07-19 Expiration)
- Strike Price: $116.00
- Delta: -0.1629, Gamma: 0.0824, Vega: 6.6607, Theta: -0.0170, Rho: -0.0102
- Premium: $0.35, ROI: 100%, Profit: $0.35
With a delta of -0.1629, this option has a moderate probability of being assigned, translating to approximately a 16% chance if the stock price decreases. The relatively high premium of $0.35 offers a 100% return on investment, making this option attractive in terms of profitability. However, the slightly elevated delta indicates a higher risk compared to options with lower delta values.
- Strike Price: $113.00
- Delta: -0.1094, Gamma: 0.0377, Vega: 5.0691, Theta: -0.0229, Rho: -0.0069
- Premium: $0.25, ROI: 100%, Profit: $0.25
An option with a delta of -0.1094 represents a lower risk of assignment (approximately 11%), fitting the criteria of minimizing assignment risk. Offering a premium of $0.25 translates into an attractive 100% return on investment. It balances profit potential and risk, making it a safer near-term choice.
Medium Term Options (2024-10-18 Expiration)
- Strike Price: $115.00
- Delta: -0.2474, Gamma: 0.0394, Vega: 20.5763, Theta: -0.0079, Rho: -0.0921
- Premium: $1.38, ROI: 100%, Profit: $1.38
The medium-term option with a delta of -0.2474 carries a higher risk due to its 25% probability of being assigned. However, the significant premium of $1.38 offers a substantial return and significant profit in absolute terms. The high vega indicates the premium may respond well to changes in volatility, presenting additional profit if the market becomes more volatile.
- Strike Price: $108.00
- Delta: -0.1433, Gamma: 0.0181, Vega: 14.7218, Theta: -0.0107, Rho: -0.0541
- Premium: $1.67, ROI: 100%, Profit: $1.67
With a lower delta of -0.1433, this option has a decreased probability of assignment (about 14%), making it a safer bet in terms of minimizing risk. The premium of $1.67 provides strong profitability, likely driven by high vega, indicating potentially larger premiums with increased market volatility.
Long Term Options (2025-01-17 Expiration)
- Strike Price: $116.00
- Delta: -0.2942, Gamma: 0.0312, Vega: 30.3285, Theta: -0.0051, Rho: -0.2040
- Premium: $3.00, ROI: 100%, Profit: $3.00
The high delta of -0.2942 means there's a nearly 30% chance of assignment, posing higher risks but also aligning with higher potential rewards. The premium of $3.00 is significantly substantial, making this option the most lucrative among the long-term choices due to the large absolute profit potential.
Quantifying Risk and Reward
In essence, the five selected short put options offer a spectrum of potential profit and risk levels:
- Near Term (2024-07-19, $116.00): High premium ($0.35) vs. moderate assignment risk (16%)
- Near Term (2024-07-19, $113.00): Moderate premium ($0.25) vs. lower assignment risk (11%)
- Medium Term (2024-10-18, $115.00): High premium ($1.38) vs. moderate assignment risk (25%)
- Medium Term (2024-10-18, $108.00): High premium ($1.67) vs. moderate-low assignment risk (14%)
- Long Term (2025-01-17, $116.00): Very high premium ($3.00) vs. high assignment risk (30%)
For investors prioritizing risk minimization while seeking high profitability, options with lower deltas and substantial premiums should be preferred. Individuals willing to accept increased assignment risks for greater potential rewards may lean towards options with higher deltas and significantly larger premiums.
Vertical Bear Put Spread Option Strategy
In exploring the most profitable vertical bear put spread strategy for Vanguard High Dividend Yield Index Fund (VYM), we must carefully consider multiple factors. The premium for both legs of the vertical spread, the Greeks (especially delta and theta), the risk of share assignment for in-the-money (ITM) options, and the target stock price range (2% over or under the current stock price) must all be meticulously analyzed. As the Greeks for each put option help us gauge potential price changes, time decay, and volatility impacts, we'll construct a strategy combining the most advantageous short put options, while mitigating risks.
Near-term Strategy (Expiration: 2024-07-19)
One viable short put option is the one expiring on 2024-07-19 with a strike price of 107. This option exhibits a delta of -0.1862, implying a moderate sensitivity to price movements. The premium is 0.54, offering a solid return, with a theta of -0.1034 indicating noticeable time decay. Pairing this position with a long put at a slightly lower strike pricesuch as 106would create a vertical bear put spread. This spread would benefit from both positions declining as the stock price falls.
Risk and reward analysis: - Max risk: Limited to the net premium paid for the spread. - Max reward: Limited by the difference in strike prices minus the net premium paid. - Profit scenario: If the stock falls below 106 by expiration, the spread would be maximally profitable. - Loss scenario: If the stock stays above 107, the maximum loss is realized, but risk of assignment is minimized since only the short leg is slightly in the money.
Mid-term Strategy (Expiration: 2024-10-18)
For a mid-term strategy, consider the put expiring on 2024-10-18 with a strike price of 114. This option has significant delta (-0.2474) and premium (1.38) with a relatively moderate theta (-0.00789). Pairing it with a long put around strike price 113 creates a favorable spread.
Risk and reward analysis: - Max risk: Limited to the net premium paid. - Max reward: The difference between strike prices minus the net premium paid. - Profit scenario: If VYM falls below 113, the spread position becomes highly profitable. - Loss scenario: If VYM remains above 114, the maximum loss is incurred but reducing assignment risk.
Longer-term Strategy (Expiration: 2025-01-17)
A longer-term bearish option would be the one expiring on 2025-01-17 with a strike price of 115. This option shows a delta of -0.2889 and offers a premium of 1.9. To create a spread, one could match this with a long put at strike price 114.
Risk and reward analysis: - Max risk: Net premium paid for entering the spread. - Max reward: Difference between the strike prices minus the costs. - Profit scenario: A decline below 114 by expiration maximizes profit. - Loss scenario: A stock price remaining above 115 incurs maximum loss while keeping assignment risk low.
Extended-term Strategy (Expiration: 2025-01-17)
For an extended time frame, another viable strategy would be a put expiring on 2025-01-17 with a strike price of 120. This option has a delta of -0.4263 with a premium of 4.0, suggesting a high sensitivity to stock price movements. Pairing it with a long put at a nearby lower strike price, such as 119, creates a spread with a higher potential return.
Risk and reward analysis: - Max risk: The premium paid. - Max reward: Difference between strikes, minus the premium. - Profit scenario: Profitable if price falls below 119 by expiration. - Loss scenario: Above 120 results in maximum loss, with less assignment concerns.
Long-term Strategy (Expiration: 2026-01-16)
For an even longer horizon, we have the put expiring on 2026-01-16 with a strike price of 121. This long-term put has a delta of -0.3739, a moderate gamma of 0.00767, and a premium of 20.0. Pairing with a long put at 120 establishes a widespread strategy.
Risk and reward analysis: - Max risk: Premium paid for the spread. - Max reward: Potential gain from the strike price difference minus costs. - Profit scenario: Falls below 120 provide maximum profit. - Loss scenario: Stock prices above 121 result in limited loss and lower assignment risk.
In conclusion, vertical bear put spreads at different horizons provide varied but bounded risk-reward dynamics. Near-term options offer quick returns but with A potential for smaller profits and higher gamma-related risk. Mid- to long-term strategies, while requiring patience, offer larger potential profits and reduced assignment risks. Consider each pair judiciously based on your holding period and risk tolerance.
Vertical Bull Put Spread Option Strategy
When evaluating the profitability of a vertical bull put spread strategy for the Vanguard High Dividend Yield Index Fund (VYM), minimizing the risk of having shares assigned while optimizing potential returns is crucial. This strategy involves selling put options at a higher strike price and buying put options at a lower strike price within the same expiration date.
The analysis of the provided data will focus on identifying options with attractive premiums (or "credits") while managing delta, which represents the probability of the option being in-the-money (and thus risk of assignment). We will consider options with different expirations and strike prices to balance risk and return across various time frames.
Short-Term Choice: Expiration on 2024-07-19
- Sell Put at $115: Delta: -0.1507, Premium: $0.5
- Buy Put at $112: Delta: -0.1161, Premium: $0.48
Risk and Reward: - Risk: The maximum loss occurs if the stock price drops below $112. With a $3 spread and a net premium of $0.02 ($0.5 - $0.48), the maximum risk is $2.98 per share. - Reward: The potential profit is limited to the net premium received, which is $0.02 per share.
Profit/Loss Scenarios: - Profit if: VYM remains above $115 at expiration. The puts expire worthless, keeping the net premium. - Loss if: VYM drops below $112, resulting in assignment and a maximum loss of $2.98 per share.
Mid-Term Choice: Expiration on 2024-10-18
- Sell Put at $115: Delta: -0.2474, Premium: $1.38
- Buy Put at $112: Delta: -0.2664, Premium: $1.35
Risk and Reward: - Risk: With a $3 spread and a net premium of $0.03 ($1.38 - $1.35), the maximum risk is $2.97 per share. - Reward: The potential profit is limited to the net premium received, which is $0.03 per share.
Profit/Loss Scenarios: - Profit if: VYM remains above $115 at expiration. The puts expire worthless, keeping the net premium. - Loss if: VYM falls below $112, resulting in assignment and a maximum loss of $2.97 per share.
Long-Term Choice A: Expiration on 2025-01-17
- Sell Put at $115: Delta: -0.2889, Premium: $1.9
- Buy Put at $112: Delta: -0.2343, Premium: $1.85
Risk and Reward: - Risk: With a $3 spread and a net premium of $0.05 ($1.9 - $1.85), the maximum risk is $2.95 per share. - Reward: The potential profit is limited to the net premium received, which is $0.05 per share.
Profit/Loss Scenarios: - Profit if: VYM remains above $115 at expiration. The puts expire worthless, keeping the net premium. - Loss if: VYM falls below $112, resulting in assignment and a maximum loss of $2.95 per share.
Long-Term Choice B: Expiration on 2025-01-17
- Sell Put at $110: Delta: -0.1740, Premium: $1.3
- Buy Put at $107: Delta: -0.1788, Premium: $1.5
Risk and Reward: - Risk: With a $3 spread and a net premium of $0.2 ($1.3 - $1.5), the maximum risk is $2.8 per share. - Reward: The potential profit is limited to the net premium received, which is $0.2 per share.
Profit/Loss Scenarios: - Profit if: VYM remains above $110 at expiration. The puts expire worthless, keeping the net premium. - Loss if: VYM falls below $107, resulting in assignment and a maximum loss of $2.8 per share.
Ultra Long-Term Choice: Expiration on 2026-01-16
- Sell Put at $121: Delta: -0.3739, Premium: $20.0
- Buy Put at $118: Delta: -0.3209, Premium: $7.1
Risk and Reward: - Risk: With a $3 spread and a net premium of $12.9 ($20 - $7.1), the maximum risk is $-9.9 per share; however, given the premium, it nets to $12.9 profit. - Reward: The potential profit is substantial due to high premiums received.
Profit/Loss Scenarios: - Profit if: VYM remains above $121 at expiration. The puts expire worthless, keeping the net premium. - Loss if: VYM falls below $118, presenting higher risk given deep in the money.
Conclusion
Among these choices, the Ultra Long-Term Choice (expiration on January 16, 2026) offers the highest premium but with significant risk. Considering risk minimization and premium balance, the Mid-Term Choice (expiration on October 18, 2024) appears to be the most balanced option, combining a significant net premium while controlling risk. Each strategy requires close monitoring to manage potential assignments and market movements, ensuring losses remain manageable.
Vertical Bear Call Spread Option Strategy
When analyzing the options chain for a vertical bear call spread strategy on the Vanguard High Dividend Yield Index Fund (VYM), it's essential to consider both profitability and risk. The analysis involves selecting the most profitable short call options and corresponding long call options while keeping in mind the Greeks to mitigate the risk of having shares assigned if part of the trade is in the money. We are targeting a stock price that is 2% over or under the current stock price and aim to minimize the assignment risk.
Key Considerations for the Strategy:
- Delta: Indicates how much the option price will change with a $1 change in the underlying asset. Low delta values for short call positions are preferred to reduce the chance of having shares assigned.
- Theta: Reflects the time decay of the option's price. A higher theta value will benefit the seller of the option as it means faster decay.
- Gamma: Shows how much the delta will change as the underlying asset's price changes. Lower gamma values mean less risk of delta increasing sharply.
- Vega: Measures sensitivity to volatility. We favor lower vega values to reduce the impact of volatility on the option's price.
- Rho: Measures sensitivity to interest rate changes, which is usually less of a concern for short-term trades.
Based on these factors, we have identified five vertical bear call spread strategies across different expiration dates:
1. Near-Term Strategy (July 19, 2024):
- Short Call: Strike 118 ($1.1 premium, Delta = 0.5723, Gamma = 0.0718, Vega = 10.6175, Theta = -0.0642, Expire: July 19, 2024)
- Long Call: Strike 120 ($0.49 premium, Delta = 0.3467, Gamma = 0.1333, Vega = 9.9879, Theta = -0.0317, Expire: July 19, 2024)
This spread provides a net credit of $0.61. The maximum gain is $0.61, and the maximum loss is $1.39. The short call's delta of 0.5723 reduces the risk of assignment, while the profit from theta decay aids profitability.
2. Short-Term Strategy (August 16, 2024):
- Short Call: Strike 121 ($0.88 premium, Delta = 0.3757, Gamma = 0.0749, Vega = 16.1476, Theta = -0.0256, Expire: August 16, 2024)
- Long Call: Strike 126 ($0.15 premium, Delta = 0.1493, Gamma = 0.0380, Vega = 9.8899, Theta = -0.0172, Expire: August 16, 2024)
This spread generates a net credit of $0.73, with a maximum gain of the same. The maximum loss is $4.27. The short calls delta is moderately low, minimizing assignment risk while theta decay assists in lowering exposure.
3. Mid-Term Strategy (October 18, 2024):
- Short Call: Strike 119 ($3.4 premium, Delta = 0.5644, Gamma = 0.0418, Vega = 25.6351, Theta = -0.0243, Expire: October 18, 2024)
- Long Call: Strike 121 ($2.66 premium, Delta = 0.4977, Gamma = 0.0299, Vega = 25.9739, Theta = -0.0306, Expire: October 18, 2024)
The net credit here is $0.74 with a maximum gain of $0.74 and a maximum loss of $1.26. The moderate delta and the theta value create a balance between profitability and assignment risk.
4. Long-Term Strategy (January 17, 2025):
- Short Call: Strike 118 ($5.4 premium, Delta = 0.6210, Gamma = 0.0277, Vega = 33.4835, Theta = -0.0209, Expire: January 17, 2025)
- Long Call: Strike 120 ($4.8 premium, Delta = 0.5647, Gamma = 0.0285, Vega = 34.6489, Theta = -0.0208, Expire: January 17, 2025)
This spread nets a credit of $0.60. The maximum gain is $0.60, and the maximum loss is $1.40. The lower gamma and vega provide a stable position despite the longer expiration.
5. Extended-Term Strategy (January 16, 2026):
- Short Call: Strike 113 ($14.5 premium, Delta = 0.7242, Gamma = 0.0115, Vega = 49.3029, Theta = -0.0166, Expire: January 16, 2026)
- Long Call: Strike 115 ($12.4 premium, Delta = 0.6984, Gamma = 0.0104, Vega = 51.4317, Theta = -0.0178, Expire: January 16, 2026)
The net credit here is $2.10, with a maximum gain of the same and a maximum loss of $0.90. Delta and theta values help maintain a beneficial position while mitigating the assignment risk.
Conclusion:
Each strategy offers a unique risk-reward profile tailored to different expiration timelines. The near-term strategies provide quicker returns with more sensitivities to rapid price movements, whereas the mid-term to extended-term strategies present more generous downfalls as premiums accumulate over the longer period. The right choice will depend on the trader's market outlook and risk tolerance, but these recommended spreads balance potential rewards with minimized risks effectively.
Vertical Bull Call Spread Option Strategy
To identify the most profitable vertical bull call spread options strategies for Vanguard High Dividend Yield Index Fund (VYM) while minimizing the risk of share assignment and adhering to a target stock price fluctuation of 2%, we must examine both the short and long put options data provided. Here, we aim to highlight the trade-offs between risk and reward potential across five expiration dates and strike prices, ranging from near-term to long-term.
Near-Term Strategy (Expiration: 2024-07-19)
-
Strategy 1: Strike Prices: 110 (short) and 105 (long)
- Short Call (110): Delta: 0.805, Premium: $8.53, ROI: 26.98%, Profit: $2.30
- Long Call (105): Delta: 1.0, Premium: $7.55, ROI: 111.54%, Profit: $8.42
- Risk and Reward: Despite the higher delta of 0.805 for the short call at 110, which indicates a strong probability of assignment, the long calls delta of 1.0 ensures maximum possible gain, generating a profit of $2.30. Since the short call premium is lower, the net credit received is advantageous, albeit with substantial assignment risk due to the high delta.
-
Strategy 2: Strike Prices: 118 (short) and 107 (long)
- Short Call (118): Delta: 0.572, Premium: $1.10, ROI: 100%, Profit: $1.10
- Long Call (107): Delta: 0.769, Premium: $9.45, ROI: 2.35%, Profit: $0.22
- Risk and Reward: This combination offers a more balanced delta profile with a lower probability of assignment for the short call. However, the potential profit here is quite modest, meaning the trade-off favors lower risk but limited reward.
Mid-Term Strategy (Expiration: 2024-10-18)
-
Strategy 3: Strike Prices: 104 (short) and 100 (long)
- Short Call (104): Delta: 1.0, Premium: $9.20, ROI: 84.48%, Profit: $7.77
- Long Call (100): Delta: 1.0, Premium: $12.50, ROI: 67.78%, Profit: $8.47
- Risk and Reward: With both options having delta of 1.0, the certainty of being deep in the money is almost guaranteed. While this ensures a strong profit potential, it also almost ensures assignment risk, making it vital to balance this high certainty with the need for substantial capital.
-
Strategy 4: Strike Prices: 108 (short) and 105 (long)
- Short Call (108): Delta: 0.721, Premium: $12.05, ROI: 31.71%, Profit: $3.82
- Long Call (105): Delta: 0.750, Premium: $11.22, ROI: 24.53%, Profit: $2.75
- Risk and Reward: This strike combination provides a favorable delta profile, which minimizes assignment risk moderately. The premiums are reasonable, with a potential profit margin that is well-balanced.
Long-Term Strategy (Expiration: 2025-01-17)
- Strategy 5: Strike Prices: 112 (short) and 109 (long)
- Short Call (112): Delta: 0.709, Premium: $8.70, ROI: 74.39%, Profit: $6.47
- Long Call (109): Delta: 0.793, Premium: $6.78, ROI: 76.58%, Profit: $5.19
- Risk and Reward: This longer-term spread strategy offers balanced deltas and more moderate assignment risks while still providing remarkable potential profit and premium, even over an extended period, making it a suitable option for conservative investors.
Comprehensive Analysis
From the five strategies analyzed, Strategy 1 (near-term) and Strategy 3 (mid-term) present more significant profit potentials, but with considerable assignment risks due to their high deltas. Strategies 2 and 4 offer more modest profits with balanced risk profiles reflective of moderate delta values and mid-level premiums.
Strategy 5, with a more extended expiration date, provides an excellent equilibrium between minimizing assignment risk and securing steady profits via moderately high delta values and significant premiums, showing an effective balance for long-term investment strategies.
Selecting an appropriate vertical bull call spread would depend on your investment horizon and risk tolerance. If you are willing to accept higher assignment risks for significant profits, then Strategy 1 or 3 may be suitable. For more balanced and sustainable approaches, Strategies 4 and 5 stand out as potentially profitable with controlled risks.
Spread Option Strategy
Analysis of Calendar Spread Options Strategy for VYM
Given the VYM options chain and the Greeks, I will analyze several profitable calendar spread strategies. We aim to choose options that minimize risk while maximizing profitability. The chosen strategy involves buying a long call and selling a short put, considering the target stock price range of 2% of the current price. To achieve our goal, I will outline five strategies across different expiration dates.
Long and Short Term Calendar Spread Strategies:
- Near-term Strategy
- Long Call Option:
- Strike Price: 105.0
- Expiration Date: 2024-07-19
- Delta: 1.0, Gamma: 0.0, Vega: 0.0, Theta: -0.012, Rho: 0.055
- Premium: $7.55, ROI: 1.115, Profit: $8.42
- Short Put Option:
- Strike Price: 116.0
- Expiration Date: 2024-07-19
- Delta: -0.150, Gamma: 0.060, Vega: 6.329, Theta: -0.021, Rho: -0.009
- Premium: $0.50, ROI: 100%, Profit: $0.50
Analysis: This near-term strategy involves a long call deep in-the-money with a Delta of 1.0, indicating a big move in the stock price will be fully captured. The short put is sufficiently out-of-the-money with a low Delta, reducing the risk of assignment. This combination presents high profitability owing to the significant premium of the call option and the full ROI on the short put.
- Mid-term Strategy
- Long Call Option:
- Strike Price: 100.0
- Expiration Date: 2025-01-17
- Delta: 1.0, Gamma: 0.0, Vega: 0.0, Theta: -0.011, Rho: 0.537
- Premium: $12.5, ROI: 0.677, Profit: $8.47
- Short Put Option:
- Strike Price: 95.0
- Expiration Date: 2025-01-17
- Delta: -0.095, Gamma: 0.009, Vega: 4.606, Theta: -0.082, Rho: -0.006
- Premium: $0.58, ROI: 100%, Profit: $0.58
Analysis: This mid-term strategy effectively leverages a long call deep in-the-money option with a very high Delta, ensuring that most stock price moves are captured. The short put again remains out-of-the-money, keeping the assignment risk minimal. Together, they offer solid profitability with controlled risk over a medium horizon.
- Long-term Strategy
- Long Call Option:
- Strike Price: 102.0
- Expiration Date: 2026-01-16
- Delta: 1.0, Gamma: 0.0, Vega: 0.0, Theta: -0.011, Rho: 0.548
- Premium: $8.75, ROI: 1.168, Profit: $10.22
- Short Put Option:
- Strike Price: 100.0
- Expiration Date: 2026-01-16
- Delta: -0.160, Gamma: 0.007, Vega: 35.953, Theta: -0.004, Rho: -0.343
- Premium: $2.25, ROI: 100%, Profit: $2.25
Analysis: For a long-term strategy, this pair of options is extremely robust. The long call's strong Delta means that it will respond well to stock price increases, while the short put's lower Delta and high Vega signify a strong premium intake with lower immediate assignment risk. The high Rho of the call reflects sensitivity to interest rates, which can also provide an additional layer of profitability.
- Ultra Long-term Strategy
- Long Call Option:
- Strike Price: 109.0
- Expiration Date: 2026-01-16
- Delta: 0.793, Gamma: 0.016, Vega: 25.120, Theta: -0.021, Rho: 0.439
- Premium: $6.78, ROI: 0.765, Profit: $5.19
- Short Put Option:
- Strike Price: 110.0
- Expiration Date: 2026-01-16
- Delta: -0.110, Gamma: 0.003, Vega: 27.946, Theta: -0.007, Rho: -0.261
- Premium: $8.23, ROI: 100%, Profit: $8.23
Analysis: This ultra-long-term strategy leverages relatively higher Vega values and low Theta decay, which suits investors expecting significant stock price movements over the years. The long call slightly in-the-money maximizes returns when the stock price rises, while the short puts low Delta mitigates assignment risk while ensuring premium income.
- Balanced Strategy
- Long Call Option:
- Strike Price: 109.0
- Expiration Date: 2024-10-18
- Delta: 0.750, Gamma: 0.013, Vega: 20.680, Theta: -0.043, Rho: 0.217
- Premium: $11.22, ROI: 0.245, Profit: $2.75
- Short Put Option:
- Strike Price: 113.0
- Expiration Date: 2024-10-18
- Delta: -0.229, Gamma: 0.039, Vega: 19.739, Theta: -0.011, Rho: -0.092
- Premium: $1.15, ROI: 100%, Profit: $1.15
Analysis: This strategy serves as a balanced choice, combining moderate-to-long-term expiry with balanced Greeks. The long call's adequate Delta and sizeable Vega offer reasonable returns, while the reasonably out-of-the-money short put controls the risk of assignment properly. The combined ROI and timeframe balance both return and risk effectively.
Conclusion
The above options strategies offer diversified risk and reward structures leveraging the Greeks to maximize returns while managing the risk of assignments. Each combination has been carefully chosen to suit different trading horizons, ensuring flexibility for traders with varying investment timelines. The near-term strategy offers swift profits, mid and long-term strategies offer considerable earnings, while ultra-long-term and balanced strategies provide stability for holding through larger market cycles.
Calendar Spread Option Strategy #1
Analyzing Calendar Spread Strategy for VYM: The Most Profitable Put and Call Combinations
Considering the combination of buying a put option and selling a call option at different expiration dates, we'll target options that maximize profitability while minimizing the risk of assignment. The core strategy will be devised with the anticipation that the stock will move within 2% over or under its current price.
Below are five strategic combinations that represent a range from near term to long term:
1. Short-Term Strategy: July 2024 Expiration
Long Put: (Data not provided; will assume it aligns with profit potential) Short Call: - Expiration: 2024-07-19 - Strike: 130.0 - Premium: $0.05 - Delta: 0.0218
Given the delta of 0.0218, this option is extremely out-of-the-money, posing minimal risk of assignment. While the absolute premium is low, the ROI is exceptionally high at 100%, although the profit potential is modest at $0.05. This choice minimizes delta risk significantly.
2. Medium-Term Strategy: August 2024 Expiration
Long Put: (Data not provided; will assume it aligns with profit potential) Short Call: - Expiration: 2024-08-16 - Strike: 121.0 - Premium: $0.88 - Delta: 0.3757 - ROI: 100%
Although the delta here is 0.3757, it still leans out-of-the-money, reducing the risk of assignment. The premium received is significantly higher than the short-term strategy while maintaining an ROI of 100%, resulting in a more considerable profit potential of $0.88.
3. Medium-Term Strategy: October 2024 Expiration
Long Put: (Data not provided; will assume it aligns with profit potential) Short Call: - Expiration: 2024-10-18 - Strike: 119.0 - Premium: $3.40 - Delta: 0.5644 - ROI: 100%
This call option has a higher delta of 0.5644, meaning its closer to being in the money but still provides good protection against assignment. The substantial premium of $3.40 and an ROI of 100% yield considerable profit while still managing risk acceptably.
4. Long-Term Strategy: January 2025 Expiration
Long Put: (Data not provided; will assume it aligns with profit potential) Short Call: - Expiration: 2025-01-17 - Strike: 115.0 - Premium: $8.00 - Delta: 0.6743 - ROI: 84.65%
For a longer horizon, this call option offers a hefty premium of $8.00 with a somewhat high delta of 0.6743. The ROI remains robust at 84.65%, offering a substantial profit of $6.77. This option balances the higher risk with a larger reward.
5. Very-Long-Term Strategy: January 2026 Expiration
Long Put: (Data not provided; will assume it aligns with profit potential) Short Call: - Expiration: 2026-01-16 - Strike: 120.0 - Premium: $7.50 - Delta: 0.6348 - ROI: 100%
The call option with this delta remains reasonably safe from the risk of assignment. The profitability is capped at a premium of $7.50, maintaining an ROI of 100%. This strategy is ideal for those looking to take a longer view without overly exposing themselves to assignment risk.
Risk and Reward Quantification
- Risk: By choosing calls with a lower delta (preferably less than 0.7), we mitigate the risk of the options being in-the-money and thus reduce the likelihood of assignment. This is crucial since the stock price is expected to move only 2% above or below its current level.
- Reward: The potential profit varies significantly from short-term smaller gains (e.g., $0.05) to long-term substantial gains (e.g., $8.00 or more). Using options with high ROI ensures that the investment remains optimized for profitability within the forecasted stock price range.
Concluding the Strategy
In choosing between these options, our preference leans toward those with favorable balance between reasonably higher deltas (less risk of assignment) and substantial premiums. The August 2024 and October 2024 expirations offer a favorable ROI with manageable risk, while the very-long-term strategy provides appealing rewards with contained risks. Each strategy presents a distinct timeline and potential for profits, catering to various risk appetites and market projections.
Calendar Spread Option Strategy #2
Analyzing the options chain for Vanguard High Dividend Yield Index Fund (VYM) and focusing on implementing a calendar spread strategy, we aim to optimize the risk-reward profile. The primary goal is to minimize the risk of share assignment while maintaining profitable positions. The strategy entails selling a put option with a shorter expiration date and buying a call option with a longer expiration date, considering a target stock price that is 2% over or under the current stock price.
Choice 1: Near-Term Expiration (2024-07-19)
Sell Put Option: - Strike Price: 101.0 - Days to Expire: 19 - Premium: $18.46 - Delta: 0.8764802808 - Gamma: 0.0114365966 - Vega: 5.5240112663 - Theta: -0.1060041266 - Rho: 0.0442234314 - Profit: $3.232 - ROI: 17.5081256771%
Buy Call Option: - Strike Price: 115.0 - Days to Expire: 110 - Premium: $8.8 - Delta: 0.6982462524 - Gamma: 0.0316566282 - Vega: 22.6971734158 - Theta: -0.0264326071 - Rho: 0.2275210667 - Profit: $7.572 - ROI: 86.0454545455%
This choice offers a relatively balanced risk with a high potential profit. The delta of the put option is high, indicating a higher probability of being in the money, but the short expiration helps mitigate the assignment risk. The long call provides significant delta exposure with substantial profit potential.
Choice 2: Mid-Term Expiration (2024-08-16)
Sell Put Option: - Strike Price: 110.0 - Days to Expire: 47 - Premium: $8.53 - Delta: 0.8053125728 - Gamma: 0.0243535457 - Vega: 7.4531896966 - Theta: -0.0921396892 - Rho: 0.0444467458 - Profit: $2.302 - ROI: 26.9871043376%
Buy Call Option: - Strike Price: 119.0 - Days to Expire: 110 - Premium: $3.4 - Delta: 0.5644084446 - Gamma: 0.0418210439 - Vega: 25.6350920612 - Theta: -0.0242979365 - Rho: 0.1886587869 - Profit: $3.4 - ROI: 100.0%
This combination reduces the delta risk slightly while maintaining a very strong profit potential on the call side. The lower delta of the put reduces the risk of assignment.
Choice 3: Long-Term Expiration (2025-01-17)
Sell Put Option: - Strike Price: 115.0 - Days to Expire: 201 - Premium: $8.0 - Delta: 0.6742832902 - Gamma: 0.0210678304 - Vega: 31.7049516252 - Theta: -0.0236167138 - Rho: 0.3838576073 - Profit: $6.772 - ROI: 84.65%
Buy Call Option: - Strike Price: 121.0 - Days to Expire: 201 - Premium: $5.65 - Delta: 0.5382162917 - Gamma: 0.0250075296 - Vega: 34.9500322369 - Theta: -0.0225022583 - Rho: 0.3154431682 - Profit: $5.65 - ROI: 100.0%
For a long-term strategy, this set-up provides a solid delta on both options, enhancing the profitability while keeping gamma high for the call option, maintaining a stable price movement profile. The moderate delta of the put option mitigates the risk of assignment over a longer period.
Choice 4: Very Long-Term Expiration (2026-01-16)
Sell Put Option: - Strike Price: 70.0 - Days to Expire: 565 - Premium: $51.0 - Delta: 0.9184226588 - Gamma: 0.002422208 - Vega: 22.2626774784 - Theta: -0.0146062351 - Rho: 0.8182609806 - Profit: $4.772 - ROI: 9.3568627451%
Buy Call Option: - Strike Price: 121.0 - Days to Expire: 565 - Premium: $9.95 - Delta: 0.6227353656 - Gamma: 0.0125839617 - Vega: 56.0587363665 - Theta: -0.0171925692 - Rho: 0.9161995513 - Profit: $9.95 - ROI: 100.0%
In a very long-term context, the premium and deltas remain attractive. The put option's premium is very high, highlighting a significant profit cushion, while the extended time period to maturity gives ample opportunities for the call option's delta and vega to work favorably.
Choice 5: Ultra Long-Term Expiration (2026-01-16)
Sell Put Option: - Strike Price: 90.0 - Days to Expire: 565 - Premium: $30.6 - Delta: 0.8620436921 - Gamma: 0.0048651665 - Vega: 32.5157797186 - Theta: -0.0164462665 - Rho: 0.9904989476 - Profit: $4.372 - ROI: 14.2875816993%
Buy Call Option: - Strike Price: 111.0 - Days to Expire: 565 - Premium: $14.5 - Delta: 0.7242397344 - Gamma: 0.0115372091 - Vega: 49.3028567863 - Theta: -0.0165751527 - Rho: 1.0423001946 - Profit: $11.272 - ROI: 77.7379310345%
This ultra long-term strategy ensures a high premium for the put option sold, providing significant buffer against losses. The call option purchased leverages high delta and vega values, ensuring that any upward movement in stock price results in substantial gains.
Conclusion
These strategies illustrate that the shorter-term options provide a quick profit while minimizing risk with short expiration dates, but the longer-term options, especially those extending over several years, offer high profit potential, albeit with increased risk of assignment due to higher delta values. Each choice balances the reward against risks differently, allowing you to select a strategy based on your specific risk tolerance and investment horizon.
Similar Companies in Asset Management:
Vanguard Dividend Appreciation Index Fund (VIG), Report: Schwab U.S. Dividend Equity ETF (SCHD), Schwab U.S. Dividend Equity ETF (SCHD), Vanguard Real Estate Index Fund (VNQ), Report: Vanguard Total Stock Market Index Fund (VTI), Vanguard Total Stock Market Index Fund (VTI), Vanguard 500 Index Fund (VOO), iShares Select Dividend ETF (DVY), SPDR S&P Dividend ETF (SDY), Invesco High Yield Equity Dividend Achievers ETF (PEY), WisdomTree U.S. High Dividend Fund (DHS), First Trust Morningstar Dividend Leaders Index ETF (FDL), Amplify CWP Enhanced Dividend Income ETF (DIVO), Global X SuperDividend U.S. ETF (DIV), ProShares S&P 500 Dividend Aristocrats ETF (NOBL)
https://www.fool.com/investing/2024/05/17/3-high-dividend-etfs-to-buy-with-25000-and-hold-fo/
https://www.fool.com/investing/2024/05/23/want-decades-of-passive-income-3-stocks-to-buy-now/
https://seekingalpha.com/article/4695997-heres-my-40-stock-dividend-portfolio-and-how-it-works
https://www.fool.com/investing/2024/05/28/these-6-dividend-etfs-are-a-retirees-best-friend/
https://www.youtube.com/watch?v=sncS8JQUdUg
https://seekingalpha.com/article/4696499-the-dividends-dont-matter
https://seekingalpha.com/article/4697033-my-top-10-high-yield-dividend-stocks-june-2024
https://www.fool.com/investing/2024/06/12/3-etfs-that-are-screaming-buys-in-june/
https://seekingalpha.com/article/4699012-vym-vs-its-competitors-shows-a-mixed-picture
https://www.fool.com/investing/2024/06/26/investing-100000-in-schd-vig-or-vym-which-is-the-b/
https://www.fool.com/investing/2024/06/29/high-yield-dividend-etfs-for-passive-income/
Copyright © 2024 Tiny Computers (email@tinycomputers.io)
Report ID: ArsZ14
Cost: $0.42581
https://reports.tinycomputers.io/VYM/VYM-2024-06-29.html Home