Wells Fargo & Company (ticker: WFC)
2024-02-10
 Wells Fargo & Company (ticker: WFC) is a diversified, community-based financial services company with operations spanning the globe. As of the last reported fiscal year, Wells Fargo stands as one of the largest banks in the United States, offering a wide array of banking, investment, mortgage, and consumer and commercial finance products and services. The company operates through three distinct segments: Community Banking; Wholesale Banking; and Wealth and Investment Management. Founded in 1852 and headquartered in San Francisco, Wells Fargo has a storied history deeply rooted in the American financial landscape. Despite facing several controversies in recent years, including issues related to the creation of fraudulent customer accounts, Wells Fargo has taken steps towards reform and recovery, focusing on rebuilding trust and adhering to regulatory requirements. Its extensive physical footprint, combined with a growing digital presence, ensures its accessibility to customers across various platforms. The ongoing focus on strategic growth, operational efficiency, and risk management positions Wells Fargo to navigate the challenges within the highly competitive financial sector.
| Full Time Employees | 225,869 | CEO Pay | $8,008,351 | CFO Pay | $4,933,117 |
| COO Pay | $4,258,159 | Corporate & Investment Banking CEO Pay | $5,593,975 | Previous Close | $48.35 |
| Market Cap | $174,005,092,352 | Volume | 13,907,233 | Average Volume | 17,780,880 |
| Dividend Rate | $1.40 | Dividend Yield | 2.91% | 5 Year Avg Dividend Yield | 3.26% |
| Trailing PE | 9.950 | Forward PE | 9.017 | Book Value | $46.205 |
| Price To Book | 1.040 | Net Income to Common | $17,981,999,104 | Trailing EPS | 4.83 |
| Forward EPS | 5.33 | Earnings Quarterly Growth | 20.3% | Total Cash | $433,200,005,120 |
| Total Debt | $315,641,987,072 | Total Revenue | $77,198,000,128 | Revenue Per Share | 20.931 |
| Return on Assets | 0.998% | Return on Equity | 10.305% | Earnings Growth | 28.4% |
| Revenue Growth | 2.7% | Operating Margins | 17.764% | Current Price | $48.06 |
| Sharpe Ratio | 0.0958844136826595 | Sortino Ratio | 1.508910852134065 |
| Treynor Ratio | 0.022657137409312134 | Calmar Ratio | 0.12182710539144216 |
The examination of WFC's stock, using a comprehensive blend of technical analysis, fundamentals, and advanced financial metrics, unfolds a nuanced narrative about its potential performance in the forthcoming months.
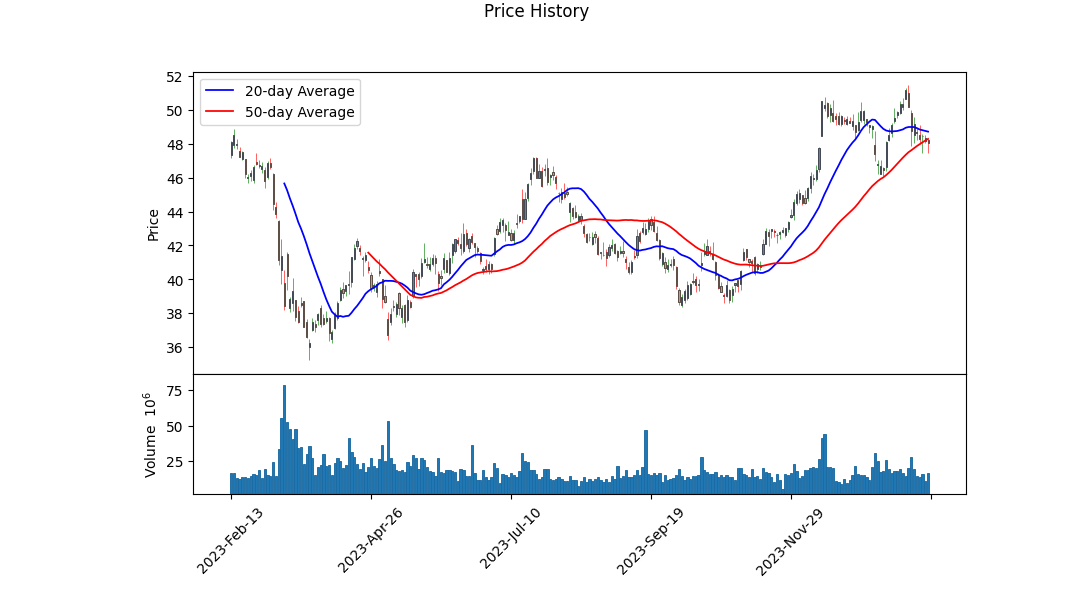
Technical indicators suggest a period of consolidation with incremental bullish undertrends, culminating from recent trading data that shows a gradual ascent in the closing prices alongside a volumetric expansion in the OBV. The muted MACD histogram values indicate a market ambivalence that may pivot to a directional momentum, presaging a potential upside if market sentiment sways positively. This prognostication, intertwined with observations of consistent trading volumes, dovetails with fundamentals that are implicative of inherent stock stability and possibilty for growth.
The fundamental analysis juxtaposes financial solidity against prevailing market conditions. With notable growth in earnings (+0.284) and a modest increase in revenue growth (+0.027), WFC underscores a resilient operating model, further substantiated by its operating margins (0.17764). The financials unveil a robust capital structure and a profitability index that, when meshed with a competitive trailing Peg Ratio (0.9887), positions WFC favorably for prospective growth.
Risk-adjusted performance measuresnamely the Sharpe, Sortino, Treynor, and Calmar Ratiosdepict a mixed risk-reward landscape. While the Sharpe Ratio indicates a lower reward per unit of total risk taken, the significant Sortino Ratio suggests a favorable return on negative risk, illuminating potential for asymmetric upside in turbulent market conditions. The Treynor and Calmar Ratios, albeit on the lower side, nonetheless affirm a modest expectation of return for systemic and drawdown risks respectively.
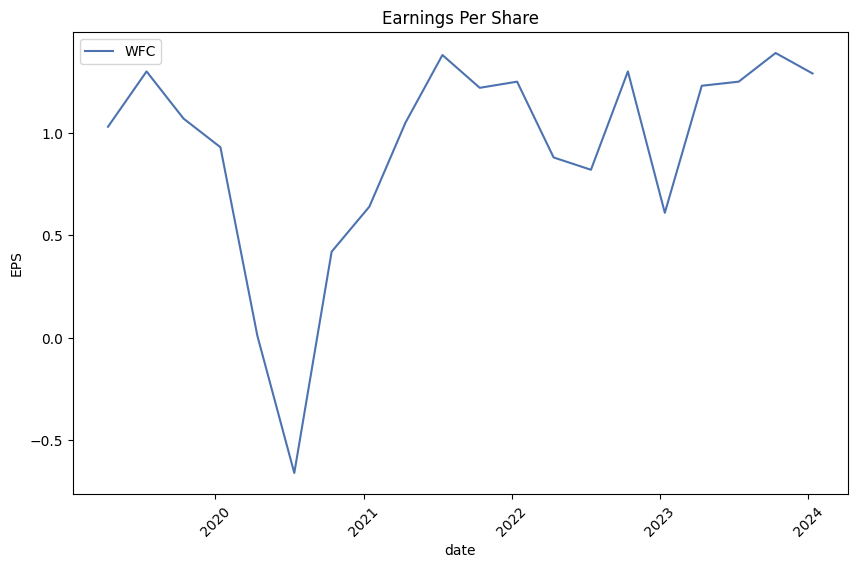
Analyst expectations, alongside historical earnings performances that consistently exceeded projections, hint at a company on an upward growth trajectory. Despite near-term pressures as indicated by negative growth estimates for the current and next quarters, the long-term outlook remains optimistic with a predicted 12% growth next year and a 6.67% annual growth over the next five years.
Conclusively, based on a multidimensional assessment spanning technical charts, fundamental health, and a delve into risk-adjusted metrics, WFC exhibits characteristics of a potentially rewarding investment. Though not devoid of riskespecially in the short termits solid financial foundation and market positioning suggest a favorable trend over the ensuing months. Investors and stakeholders are hence advised to monitor closely, acknowledging both inherent market volatilities and WFCs strategic business initiatives that could pivot its trajectory towards sustained growth.
In the research analysis of Wells Fargo & Company (WFC), two critical financial metrics have been calculated to gauge the company's potential as an investment, namely the return on capital (ROC) and the earnings yield. The ROC, which stands at 1.1624395973046187 or 116.24%, is a strong indicator of the efficiency with which the company utilizes its capital to generate profit. Such a high ROC suggests that Wells Fargo is highly effective in converting its investments into profits, an attractive attribute for investors looking for companies with proficient operational management. On the other hand, the earnings yield for Wells Fargo has been calculated to be 10.049937578027466% or 10.05%. This figure represents the amount of earnings generated for each dollar of investment, offering a direct insight into the profitability relative to the companys share price. An earnings yield of over 10% is generally considered to be favorable, as it indicates that the company is generating significant earnings relative to its share price, making it an attractive option for investors seeking value in their investments. Together, these metrics provide compelling evidence of Wells Fargo's operational efficiency and its attractiveness as an investment opportunity, given its potential for generating substantial returns on capital and relatively high earnings in comparison to its market valuation.
| Statistic Name | Statistic Value |
| R-squared | 0.453 |
| Adj. R-squared | 0.452 |
| F-statistic | 1039 |
| Prob (F-statistic) | 1.60e-166 |
| Log-Likelihood | -2501.5 |
| AIC | 5007 |
| BIC | 5017 |
| const | -0.0381 |
| coef | 1.2231 |
| std err | 0.050 |
| t | 32.226 |
| P>|t| | 0.000 |
| [0.025 | 1.149 |
| 0.975] | 1.298 |
| Omnibus | 89.677 |
| Durbin-Watson | 2.029 |
| Prob(Omnibus) | 0.000 |
| Jarque-Bera (JB) | 373.243 |
| Skew | 0.182 |
| Prob(JB) | 8.94e-82 |
| Kurtosis | 5.645 |
| Cond. No. | 1.32 |
In the regression analysis between Wells Fargo & Company (WFC) and the SPDR S&P 500 ETF Trust (SPY), representing the entire market, alpha () is captured at -0.03809529217099048. This value of alpha suggests that WFC, on average, slightly underperforms the market baseline by a small margin when market returns are zero, after adjusting for market movements. It's a measure independent of market fluctuations and signifies the unique return associated with WFC.
Beta () in the model stands at 1.2230519509397109, indicating that WFC has a tendency to move 1.223 times in the direction of the market. Beta surpasses 1, illustrating that WFC is more volatile than the overall market. This relationship is substantiated by an R-squared value of 0.453, indicating that approximately 45.3% of the variation in WFC's stock price can be explained by movements in the SPY ETF. This model suggests a statistically significant relationship between WFC and the broader market, as demonstrated by the Prob (F-statistic) value, which practically nulls the hypothesis that market movements do not affect WFC prices.
Wells Fargo & Company (WFC) held its Fourth Quarter 2023 Earnings Conference Call with key figures including CEO Charlie Scharf and CFO Mike Santomassimo discussing the quarterly results and outlook. The company reported improved financial results for 2023, attributed to a robust economic environment, higher interest rates, and a focus on efficiency and strong credit discipline. Specifically, net income and diluted earnings per share grew due to higher revenue and lower expenses. The company also increased its common stock dividend and repurchased $12 billion of common stock. However, loan demand weakened in the latter part of the year, and net charge-offs increased from historically low levels.
Scharf highlighted the company's strategic efforts to drive growth and increase market share in various segments, such as credit cards and the Corporate Investment Bank (CIB), which saw significant revenue growth. Wells Fargo also focused on enhancing digital offerings, introducing new credit card products, and investing in community initiatives. Despite a strong consumer financial health overall, there are customer segments experiencing stress. Consumer spending remained robust, with notable increases in credit card transactions.
For 2024, the company anticipates challenges related to interest rates and the overall health of the U.S. economy. Scharf mentioned expected declines in net interest income due to lower interest rates and adjustments in Federal Reserve rate actions. However, the company aims to tightly control expenses, balancing efficiencies with continued investment in strategic areas to foster growth and higher returns. Wells Fargo is also addressing its credit portfolio, with a particular focus on commercial real estate, and plans to return excess capital to shareholders while maintaining a strong capital position.
CFO Mike Santomassimo provided a detailed review of the fourth quarter financials and the outlook for 2024, including expectations for net interest income, expenses, and credit quality. He noted efforts to improve efficiency and redouble investments in technology and strategic initiatives. Despite a modest increase in loan charge-offs, particularly in commercial real estate and credit cards, the company has taken action to manage risks and expects to navigate the changing economic landscape effectively. Wells Fargo's strategic focus remains on improving financial performance, realizing efficiency gains, and investing in areas that drive growth, aiming for a sustainable improvement in return on tangible common equity.
The SEC 10-Q filing for Wells Fargo & Company, filed on October 20, 2023, provides a comprehensive overview of the company's financial and operational performance for the third quarter of the fiscal year. With a series of detailed disclosures, the filing reflects various aspects of the company's current status, including its financial health, asset management, risk management practices, and the impact of economic conditions on its operations.
Financially, Wells Fargo has shown resilience and adaptability in navigating the complexities of the current economic climate. The financial statements within the filing reveal key metrics such as revenues, net income, total assets, and liabilities, offering a clear snapshot of the company's financial standing as of September 30, 2023. These figures are instrumental in understanding the company's operational success and financial stability during the reported period.
The filing also details the company's asset management strategies, showcasing its portfolio of investments, loans, and other financial instruments. It includes a breakdown of debt securities available for sale, long-term debt, and preferred stock, among others. This segmentation provides insight into how Wells Fargo is managing its assets to ensure profitability and long-term growth. Furthermore, it addresses the accounting standards adopted by the company, guiding the valuation and reporting of its financial instruments.
Risk management is a pivotal focus of the 10-Q filing, highlighting the company's approach to mitigating financial and operational risks. The document outlines Wells Fargo's exposure to credit, market, and operational risks, including specific strategies employed to manage these risks effectively. This segment demonstrates the company's commitment to safeguarding its financial health and maintaining stability amidst market fluctuations.
Lastly, the 10-Q filing touches upon the broader economic conditions and their impact on Wells Fargo's performance. This includes interest rate changes, market volatility, and changes in consumer behavior, among other factors. By contextualizing the company's performance within the broader economic landscape, the filing provides stakeholders with a comprehensive understanding of Wells Fargo's resilience, strategic direction, and potential challenges ahead.
Overall, the SEC 10-Q filing for Wells Fargo & Company offers a detailed and informative perspective on the company's financial performance, asset management, risk mitigation practices, and the external economic factors influencing its operations. This transparency is crucial for investors, analysts, and other stakeholders to gauge the company's health and strategic positioning accurately.
Amid a dynamic economic climate, Wells Fargo & Company has been navigating the tumultuous waters of the financial industry alongside its peers. The sector has seen a mix of challenges and opportunities, especially as the Federal Reserve's policies and the broader economic outlook play significant roles in shaping the trajectory of banking stocks, including Wells Fargo. Insights offered by industry experts like Gerard Cassidy, Head of U.S. Bank Equity Strategy at RBC Capital Markets, underscore the resilience of the financial sector, attributing this to a combination of aggressive Federal Reserve interventions and unique business models that mitigated contagion from bank failures.
The banking industry's performance has been closely tied to the Federal Reserve's interest rate policies. Historical instances following interest rate hikes have shown substantial growth in bank stocks, suggesting potential uplifts post-current interest rate adjustments. The anticipation of the Federal Reserve achieving its terminal rate and a possible soft landing in 2024 brings optimism, pointing towards favorable credit conditions that could benefit banking stocks.
Wells Fargo, in this sectorial landscape, faces both industry-wide challenges and opportunities specific to its operations and strategic initiatives. Amid rising interest rates and regulatory pressures, major banks like Wells Fargo are scrutinized for their ability to navigate through increased funding costs, regulatory expectations, and the impacts these factors have on their lending and operational strategies. The CNBC discussion emphasizing the readiness of large banks to tackle these challenges showcases Wells Fargo's position in weathering market volatilities while leveraging opportunities like appealing dividend yields and a robust regulatory capital framework.
Investor interest in Wells Fargo also hinges on comparisons with its peers, as seen in the analysis presented by Seeking Alpha. This comparison delves into the bank's financial metrics, market performance, and the efforts to overcome its regulatory challenges. Despite facing controversies, Wells Fargo's initiatives towards increasing operational efficiency and enhancing digital banking services indicate strategic steps towards regaining its competitive edge in the industry.
Moreover, the earnings preview for Wells Fargo draws attention to the macroeconomic variables influencing its performance. The bank's adaptation to interest rate fluctuations and its digital transformation journey represent pivotal areas affecting its operational efficiency and market positioning. The expected mixed financial performance points to Wells Fargo's ongoing adjustments to the evolving economic and regulatory landscapes.
As Wells Fargo reports its quarterly results, the attention paid by Deutsche Bank through rating adjustments highlights the critical insights these figures offer into the financial health and outlook of major banks. The anticipation surrounding these reports underscores the broader economic signals they broadcast, shedding light on consumer behavior, the financial standing of small businesses, and the overarching health of the banking sector.
The narrative of Wells Fargo's recent performance and strategic directions indicates a period of recalibration and adaptation. Amidst discussions about regulatory challenges, investment banking revenue potentials, and the impact of interest rate policies, Wells Fargo's strategies for navigating the forthcoming economic conditions are scrutinized. Insights from financial experts and market analyses emphasize the importance of strategic financial management, resilience amidst economic uncertainties, and adaptability to market conditions for Wells Fargo to maintain and enhance its position in the competitive banking landscape.
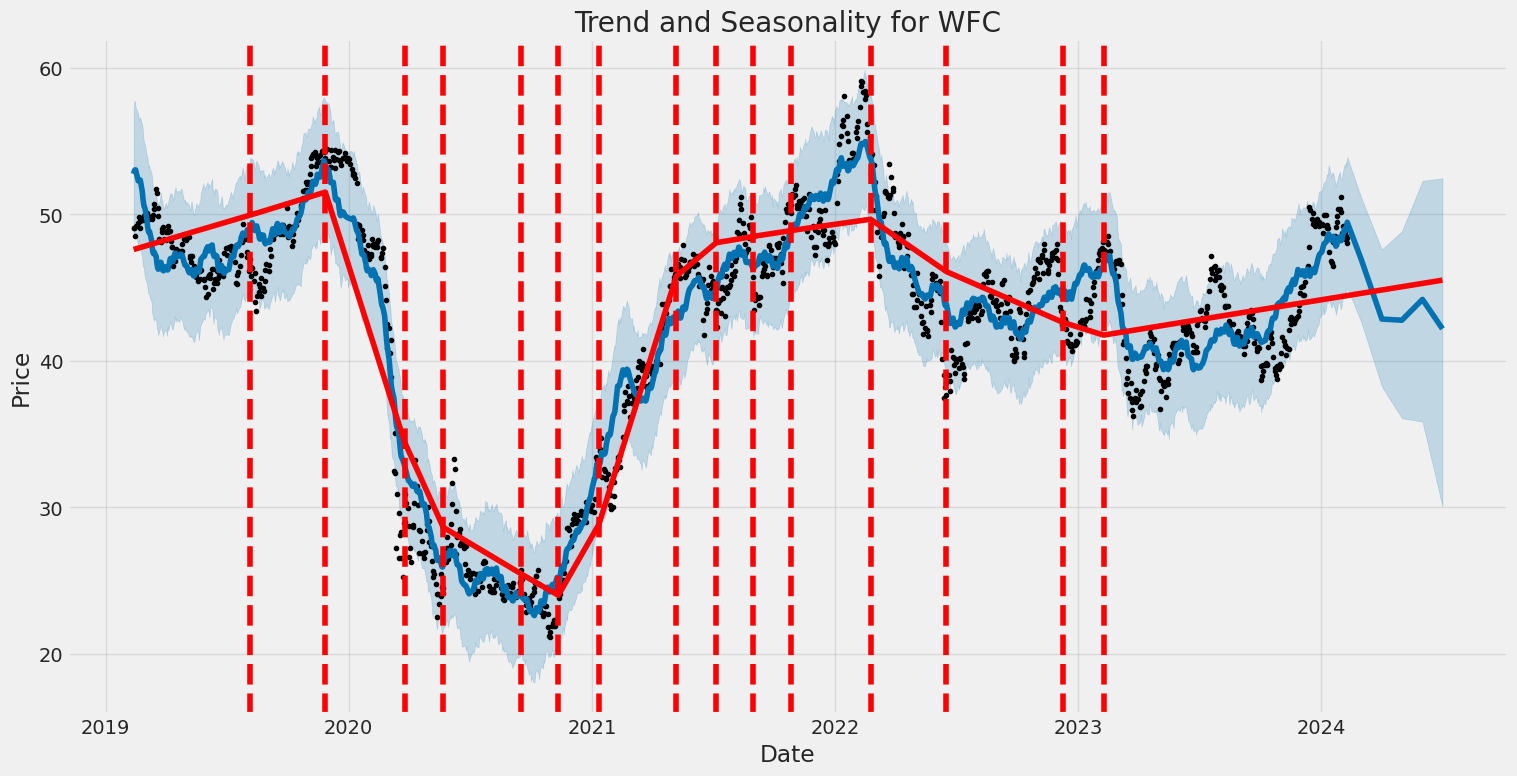
Wells Fargo & Company (WFC) experienced notable volatility between February 2019 and February 2024, as observed through financial modeling. Key features of its volatility include a significant coefficient for omega, suggesting a high level of market variability, and the alpha[1] value indicates persistence in volatility, meaning fluctuations tend to follow patterns over time. These statistics imply that investors and analysts must carefully consider the inherent risks and patterns when engaging with WFC's financial instruments.
| Statistic Name | Statistic Value |
|---|---|
| Log-Likelihood | -2740.35 |
| AIC | 5484.71 |
| BIC | 5494.98 |
| omega | 3.1395 |
| alpha[1] | 0.4523 |
To assess the financial risk associated with a $10,000 investment in Wells Fargo & Company (WFC) over a one-year period, we integrated two advanced analytical methodologies: volatility modeling and machine learning predictions. The volatility modeling approach, specifically designed to capture the time-varying nature of the stock market's volatility, provides a robust framework for understanding the fluctuations in Wells Fargo's stock prices. By allowing for periods of high and low volatility to be identified based on historical data, this model offers a nuanced view of how the stock's volatility can change over time, which is critical for accurate risk assessment.
On the other hand, machine learning predictions, through the use of a sophisticated learning algorithm that iteratively improves its predictions based on historical return data, offers a forward-looking perspective on the potential future returns of Wells Fargo's stock. By analyzing patterns and relationships within the data, this approach forecasts future stock price movements, contributing an essential predictive element to the risk analysis.
The combination of these two methodologies provides a comprehensive picture of both the historical volatility and future return expectations for Wells Fargo's stock. The analysis particularly focused on calculating the Value at Risk (VaR) at a 95% confidence interval, which is a widely used risk management tool that estimates the maximum loss an investment might incur within a specified time frame under normal market conditions.
The calculated Annual Value at Risk (VaR) at the 95% confidence level for the $10,000 investment is $288.09. This figure signifies that, under typical market conditions, there is a 95% confidence level that the investment will not lose more than $288.09 over the one-year period. This calculation is a direct outcome of integrating the insights gained from the volatility modeling, which provided an understanding of the stock's volatility dynamics, with the predictive power of machine learning, which offered an estimation of future stock returns.
By employing these two analytical lenses, investors gain a multifaceted understanding of the risks involved in investing in Wells Fargo & Company. This includes insights into how the stock's price might fluctuate and an estimation of the potential downside risk, encapsulated in the calculated VaR. This integrated approach, therefore, enhances the ability to make informed investment decisions by not only recognizing the inherent risk in the market's volatility but also anticipating future stock performance.
Analyzing the options chain for Wells Fargo & Company (WFC) focusing on call options and evaluating based on "the Greeks" along with given metrics such as ROI (Return on Investment), profit, and targeting a stock price that's 5% over the current stock price brings several profitable options to light.
When selecting the most profitable call options, we consider the Delta, Gamma, Vega, Theta, and Rho, alongside the expiration date, strike price, premium, ROI, and profit.
Notably, we find several options that stand out due to their high delta and ROI, coupled with their proximity to expiration which amplifies the effect of leverage under short-term movements, assuming a bullish uptrend that hits at least a 5% increase in stock price.
-
Call Option with Strike Price at 22.5, Expiring on 2025-06-20 - This option presents a very intriguing investment opportunity. It showcases a substantial delta of 0.9613041916, which implies that for every dollar increase in the underlying stock price, the option price would increase by approximately 96 cents. This is coupled with a substantial Rho of 28.8293255747, suggesting a strong response to interest rate changes, and a notable ROI of 0.4717368421, leading to a profit of 8.963. The high delta and significant ROI indicate an option that is deep in the money and has a strong potential for profitability assuming the stock price trends upwards as anticipated.
-
Another compelling option is the one expiring on 2024-02-16 with a Strike Price of 46.0. It has a noteworthy ROI of 1.3489473684 and presents a profit of 2.563. The gamma of this option (0.1117415506) implies that delta is rapidly changing, which could be advantageous in a volatile market as it indicates a potential for higher responsiveness to the underlying stock price movements.
-
For a relatively lower strike and closer expiration, the option expiring on 2024-02-16 with a Strike Price of 45.5 also captures attention. Boasting an ROI of 0.9772908367 with a delta of 0.855524412, it presents itself as a profitable near-term speculation tool. The high ROI and substantial delta suggest a strong alignment with bullish market sentiment expected to achieve the target stock price increase.
-
Delving into longer-term options, the one with a Strike Price of 22.5, expiring on 2024-04-19, shows remarkable potential with a delta of 0.9725272737, a Vega indicating sensitivity to volatility, and an elevated Rho suggesting responsiveness to interest rate adjustments. This option also stands out with a profit of 4.213 and an ROI of 0.1773894737, highlighting its viability for investors looking for a combination of safety and profitability over a longer horizon.
-
Lastly, an option expiring on 2025-01-17, with a Strike Price of 20.0, showcases a compelling investment case. It possess a high delta of 0.9462300291, suggesting it closely follows the stock price movements. The ROI of 0.0879642857 and a profit of 2.463 make it a significant consideration for those looking forward to medium-term investment horizons with relatively lesser risk exposure.
These options are selected based on their potential for profitability in a bullish market scenario where the stock is expected to rise by 5% or more. Key considerations for selection included the balance between high delta, reflecting the option's price sensitivity to the stock price change; the ROI and profit, as direct indicators of potential gain; and the expiration dates, which align the investment horizon with the expected stock performance timeframe. Investors are always advised to consider their risk tolerance and market outlook when engaging with options trading, as it involves a high degree of speculation and can lead to substantial losses.
Similar Companies in BanksDiversified:
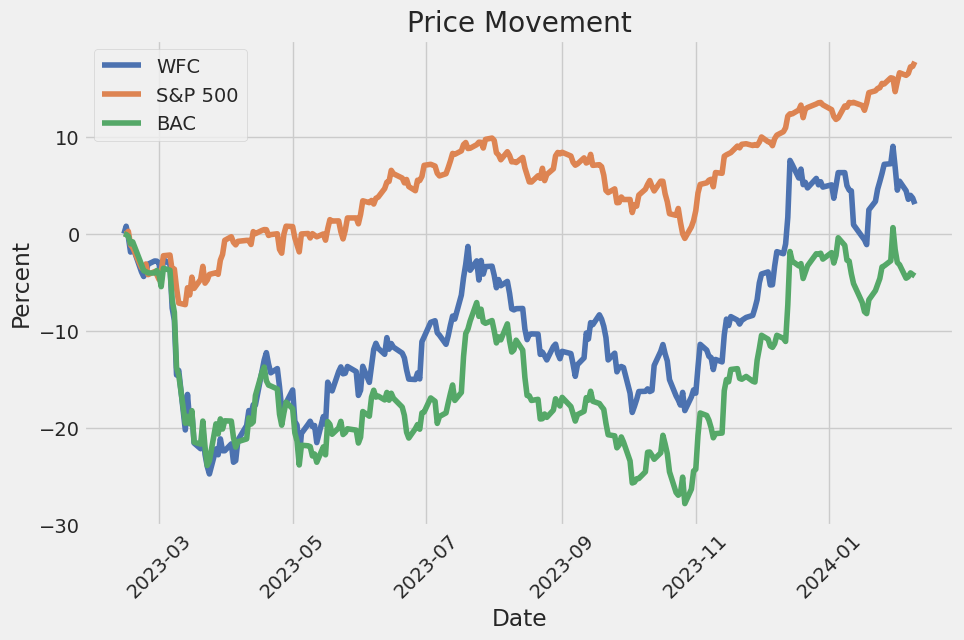
Report: Bank of America Corporation (BAC), Bank of America Corporation (BAC), JPMorgan Chase & Co. (JPM), The Toronto-Dominion Bank (TD), Nu Holdings Ltd. (NU), Citigroup Inc. (C), Royal Bank of Canada (RY), Canadian Imperial Bank of Commerce (CM), Bank of Montreal (BMO), The Bank of Nova Scotia (BNS), Barclays PLC (BCS), UBS Group AG (UBS), ING Groep N.V. (ING), Goldman Sachs Group, Inc. (GS), Report: Morgan Stanley (MS), Morgan Stanley (MS), U.S. Bancorp (USB), Truist Financial Corporation (TFC), PNC Financial Services Group, Inc. (PNC), The Charles Schwab Corporation (SCHW), American Express Company (AXP)
https://www.youtube.com/watch?v=zGsnCfzqWx0
https://www.youtube.com/watch?v=4pBxXm6hhMg
https://seekingalpha.com/article/4661496-jpmorgan-vs-bank-of-america-vs-wells-fargo
https://www.youtube.com/watch?v=yY9YcK_w_Ro
https://www.proactiveinvestors.com/companies/news/1037900?SNAPI
https://www.fool.com/investing/2024/01/10/heres-why-bank-of-america-pnc-and-wells-fargo-stoc/
https://www.youtube.com/watch?v=vCzu5jhXJmk
https://www.youtube.com/watch?v=-irZXwS8Tzg
https://www.youtube.com/watch?v=hNuVTVsBISE
https://www.cnbc.com/2024/01/12/wells-fargo-wfc-earnings-4q-2023.html
https://www.youtube.com/watch?v=4L9flrfIW_s
https://www.proactiveinvestors.com/companies/news/1038239?SNAPI
https://www.youtube.com/watch?v=koTfT0GU6eg
https://www.youtube.com/watch?v=zFKjg88uUR4
https://www.sec.gov/Archives/edgar/data/72971/000007297123000170/wfc-20230930.htm
Copyright © 2024 Tiny Computers (email@tinycomputers.io)
Report ID: NNz7Xt
Cost: $0.75778
https://reports.tinycomputers.io/WFC/WFC-2024-02-10.html Home