Cactus, Inc. (ticker: WHD)
2024-02-17
 Cactus, Inc. (ticker: WHD) is a recognized leader in the design, manufacture, and sale of wellhead and pressure control equipment used in the extraction of oil and gas. The company's offerings primarily cater to the needs of onshore and offshore drilling operations across major oil-producing regions. With a keen focus on innovation and safety, Cactus, Inc. has established a reputation for delivering high-quality products and services that enhance the operational efficiency and productivity of its customers. Its product lineup includes wellhead systems, fracture stacks, and related services aimed at enhancing the integrity and control of the drilling process. Cactus operates with a direct sales model, leveraging its technological expertise and customer service to foster strong relationships within the energy sector. Financially, WHD has shown resilience amidst the volatile oil market, illustrating its ability to adapt and maintain profitability. As the industry continues to evolve with an increasing emphasis on sustainability and efficiency, Cactus, Inc. is well-positioned to continue its trajectory of growth, leveraging its innovative solutions to meet the demands of a dynamic energy sector.
| Statistic Name | Statistic Value | Statistic Name | Statistic Value | Statistic Name | Statistic Value |
|---|---|---|---|---|---|
| City | Houston | State | TX | Country | United States |
| Phone | 713 626 8800 | Website | cactuswhd.com | Industry | Oil & Gas Equipment & Services |
| Sector | Energy | Full Time Employees | 1,200 | Previous Close | 45.95 |
| Open | 45.96 | Day Low | 45.52 | Day High | 47.15 |
| Dividend Rate | 0.48 | Dividend Yield | 0.0104 | Payout Ratio | 19.40% |
| Beta | 1.964 | Trailing PE | 19.90 | Forward PE | 14.85 |
| Volume | 746,522 | Average Volume | 710,718 | Average Volume 10 Days | 640,650 |
| Market Cap | 3,015,967,488 | 52 Week Low | 31.365 | 52 Week High | 57.00 |
| Price to Sales TTM | 2.99 | Enterprise Value | 3,177,970,944 | Profit Margins | 14.97% |
| Shares Outstanding | 65,323,100 | Shares Short | 3,307,544 | Book Value | 12.568 |
| Price to Book | 3.67 | Net Income to Common | 151,212,992 | Trailing EPS | 2.32 |
| Forward EPS | 3.11 | Total Revenue | 1,009,868,032 | EBITDA | 317,500,000 |
| Free Cash Flow | 116,490,128 | Operating Cash Flow | 287,880,992 | Gross Margins | 36.39% |
| EBITDA Margins | 31.44% | Operating Margins | 28.66% | Revenue Growth | 56.00% |
| Sharpe Ratio | -0.10536926841023472 | Sortino Ratio | -1.7408448609045708 |
| Treynor Ratio | -0.03680511433152426 | Calmar Ratio | -0.19576838933829238 |
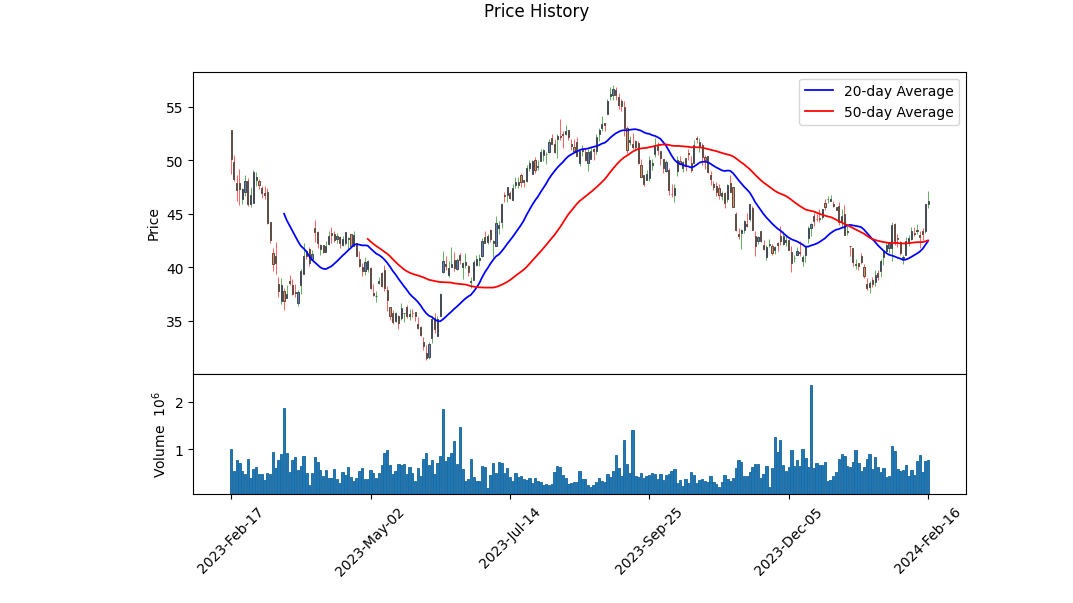
Delving into the financial performance and technical indicators of WHD, a crucial observation is noted in its sharp contrast between technical indicators and financial fundamentals. The technical analysis reveals a fluctuating price movement with a recent uptrend, characterized by an increasing On-Balance Volume (OBV) and a positive Moving Average Convergence Divergence (MACD) histogram. These indicators typically signal growing investor interest and potential bullish momentum in the short to medium term.
However, a more nuanced assessment surfaces when juxtaposing the technical analysis with various financial ratios and fundamental data. The company's fundamentals, highlighted by solid earnings growth projections and a robust balance sheet, suggest a strong financial position. Specifically, consistent growth in earnings and revenue, alongside a healthy balance sheet with a notable increase in cash, cash equivalents, and a tangible book value, underpin the company's intrinsic value. It is also noteworthy that the company demonstrates a low debt level, further strengthening its financial health.
Furthermore, the company's valuation metrics, such as the Altman Z Score of 7.312858384243643 and a Piotroski Score of 6, signify a low bankruptcy risk and good financial health, respectively. These scores, combined with a working capital of 315,581,000 and retained earnings growth, underscore a stable operational and financial foundation which is poised for sustained growth.
Nevertheless, the risk-adjusted return ratios, including negative Sharpe, Sortino, Treynor, and Calmar ratios, convey caution. These indices reflect the stock's return potential vis-a-vis its risk, illustrating a period of underperformance relative to its risk profile in the past year. This discrepancy between the company's financial health and its risk-adjusted performance could be attributed to external market conditions, investor sentiment, or specific sectoral challenges that the company may have faced.
Considering the escalation in OBV, a positive trend in the MACD histogram, and robust financial health, the forecast for WHD's stock price in the forthcoming months leans towards a positive trajectory. However, investors are advised to maintain vigilance, accounting for the risk-return paradox highlighted by the risk-adjusted return ratios. The anticipation of continued earnings growth, backed by solid fundamentals and positive technical indicators, suggests upside potential. Yet, the market's broader sentiment and macroeconomic factors will play a crucial role in materializing these gains. Investors should weigh these elements, integrating both technical analysis and fundamental perspectives to sculpt informed investment decisions.
In our analysis of Cactus, Inc. (WHD), two critical metrics stand out, providing insight into the company's financial health and attractiveness as an investment option. Firstly, the Return on Capital (ROC) is calculated at 17.44%. This is a significant figure, suggesting that Cactus, Inc. effectively uses its capital to generate profit, a pivotal indicator of operational efficiency and a promising sign for investors seeking companies that can translate their investments into earnings efficiently. Secondly, the Earnings Yield for Cactus, Inc. stands at 3.96%. While this may appear modest in isolation, it provides an interesting perspective when comparing the yield to prevailing interest rates or other investment opportunities. This yield offers a quantitative measure of the company's profitability relative to its share price, providing investors with a metric to gauge potential returns on investment in comparison to other options in the market. Together, these metrics paint a picture of Cactus, Inc. as a company with a strong operational backbone, capable of generating considerable returns on the capital deployed, which, coupled with a reasonable earnings yield, could make it a compelling choice for investors looking for a blend of efficiency and profitability in their portfolio.
Based on the calculation of key metrics for Cactus, Inc. (WHD), let's evaluate how the company stands in comparison to Benjamin Graham's criteria for stock selection:
1. Price-to-Earnings (P/E) Ratio: The P/E ratio of Cactus, Inc., is 32.21. This is a crucial measure to understand how much investors are willing to pay for $1 of earnings. According to Graham's philosophy, a stock with a low P/E ratio is typically more desirable since it may indicate that the stock is undervalued. Without the context of the industry average P/E ratio (as the data provided is empty in this regard), it is challenging to make a definitive judgment. However, in general, a P/E ratio of 32.21 might be considered on the higher side, suggesting that Cactus, Inc., may not meet Graham's criteria of looking for stocks with low P/E ratios compared to their industry peers.
2. Price-to-Book (P/B) Ratio: Cactus, Inc., has a P/B ratio of 2.695, which compares the company's book value to its market value. Graham often targeted companies trading below their book value. While a P/B ratio of 2.695 indicates that Cactus is trading above its book value, it does not strictly fit within Graham's preferred criteria. However, the acceptability of this ratio can vary depending on the industry standards.
3. Debt-to-Equity Ratio: The debt-to-equity ratio for Cactus, Inc., stands at approximately 0.05. This low ratio conforms to Graham's preference, suggesting that Cactus, Inc., carries lower financial risk due to its minimal reliance on debt to finance its operations. Companies with lower debt are perceived as more financially stable, which aligns well with Graham's investment philosophy.
4. Current and Quick Ratios: Both the current ratio and quick ratio of Cactus, Inc., are calculated as 5.612. These ratios gauge the company's ability to cover short-term obligations, with higher values indicating better liquidity and financial health. Graham emphasized the importance of financial stability, and by this metric, Cactus, Inc., appears to be in a strong position to meet its short-term liabilities.
5. Earnings Growth: The provided data does not include specific figures regarding Cactus, Inc.'s earnings growth. However, Graham valued companies demonstrating consistent earnings growth over a period. An assessment of Cactus, Inc.'s earnings growth would be necessary to fully evaluate its alignment with Graham's methods.
In summary, Cactus, Inc., shows strong potential in terms of its low debt-to-equity ratio and robust liquidity ratios, both of which align with Benjamin Graham's fundamental principles of financial stability and reduced financial risk. However, the company's P/E and P/B ratios suggest it may be trading at a premium compared to its intrinsic value, which might not ideally fit within the classic Graham approach of seeking undervalued stocks. It's important for investors to consider the context of the industry and the broader market when applying Graham's criteria, as these ratios can vary significantly across different sectors.Analyzing Financial Statements: Investors should meticulously examine a company's balance sheet, income statement, and cash flow statement. Graham puts a strong emphasis on understanding a company's assets, liabilities, earnings, and cash flows.
Given the detailed financial data for Cactus, Inc. (Symbol: WHD) across different reporting periods, let's analyze the core aspects:
-
Balance Sheets Analysis: Over time, Cactus, Inc. has shown significant fluctuation in its cash and cash equivalents, ranging from $297,741,000 in Q1 2021 and peaking at $309,082,000 in Q2 2021, before slightly decreasing to $301,669,000 by FY 2021. This indicates liquidity with a positive status but involves fluctuation throughout the financial year. Assets and liabilities structure portrays a stable company with assets often outweighing liabilities, underlining a solid financial position.
-
Income Statement Highlights: The revenue growth from Q1 2021 with $145,899,000 to a remarkable $193,310,000 in Q2 2021 demonstrates a progressive performance throughout the year. The operating income follows a fluctuating yet positive trend, marking the operational strength and effectiveness in generating profit from operational activities.
-
Cash Flow Analysis: The net cash provided by operating activities showcased an uptrend from $17,209,000 in Q1 2021 to a peak of $43,229,000 in Q2 2021, reflecting efficient cash management and operational strength. Capital expenditures also were managed efficiently, supporting the strategic growth while maintaining a healthy cash position.
-
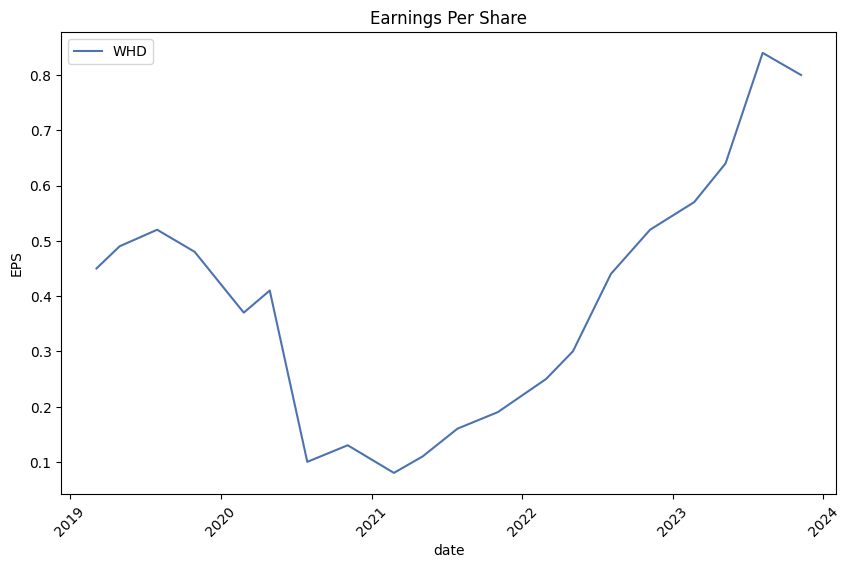
Earnings Per Share (EPS): The EPS figures indicate healthy profitability, with noticeable increases illustrating that the earnings attributable to shareholders have improved over reporting periods. This metric highlights the company's capability to generate profits over time from each stock unit held by investors.
-
Dividend Policy: The consistency in declaring dividends, as observed from Q2 2021 to Q3 2021, underscores Cactus, Inc.'s commitment to returning value to its shareholders. This also reflects the company's confidence in its cash flow generation and profit stability.
-
Asset Management: A continuous investment in property, plant, and equipment, and the management of finance lease right-of-use assets underline the company's focus on sustaining its operational capabilities and future growth prospects.
-
Liabilities Management: While liabilities have also increased, particularly the noncurrent tax receivable agreement liability, it indicates strategic financial planning by the company in managing its long-term obligations.
-
Liquidity and Stability: The balance between current assets and liabilities, in addition to the retained earnings and equity, underscores liquidity and financial stability, ensuring the company can meet short-term obligations and is positioned for sustained growth.
-
Comprehensive Income and Noncontrolling Interest: The companys comprehensive income and careful management of noncontrolling interest express a comprehensive approach towards stakeholders wealth maximization and fair, transparent financial reporting.
In summary, Cactus, Inc. delineates a picture of financial health, progressive growth, and a commitment to shareholder value, as per Benjamin Grahams principles of intelligent investing. The companys strategic management of assets, earnings, and cash flows, coupled with a consistent dividend policy, outlines a promising prospect for investors aiming for both value and growth investing.Given the provided data showcasing the dividend history of a company symbolized as 'WHD,' we notice a consistent and commendable track record of dividend payouts over the years. This historical performance aligns with Benjamin Graham's investment criteria, particularly emphasizing the importance of dividend consistency.
Here's a breakdown of the key points from the dividend history of WHD:
-
Consistent Dividend Payouts: The company has successfully maintained a regular pattern of dividend payments, showcasing its ability to return value to shareholders consistently. This is a positive sign for investors looking for stable income streams.
-
Gradual Increases in Dividend Amounts: Over the observed period, WHD has gradually increased its dividend payout, from $0.09 in 2019 to $0.12 by 2024. Such progressive increases are indicative of the company's growth and financial health, as it can distribute more profits to its shareholders.
-
Steady Declaration, Record, and Payment Dates: The information provided shows a systematic approach to dividend payouts, with scheduled declaration, record, and payment dates. This consistency further contributes to making WHD a potentially attractive choice for income-focused investors who appreciate predictability.
-
Adherence to Graham's Philosophy: Benjamin Graham, heralded as the father of value investing, advised investors to focus on companies with a solid dividend record amongst other criteria. WHD's dividend history would likely be deemed favorable by Graham's standards, as it exhibits financial stability and shareholder commitmentkey attributes for long-term investment viability.
-
Implications for Investors: For followers of Graham's investment philosophies, a company like WHD could be appealing. Its proven track record of dividend payments might be seen as a reflection of operational stability and a prudent management approach. Such companies often form the cornerstone of a value investor's portfolio, given their potential to offer both income through dividends and capital appreciation over time.
In summary, the dividend record of WHD presents a compelling case for investors who prioritize consistent income and financial stability, hallmarks of Benjamin Graham's investment criteria. It exemplifies how a company can remain aligned with the principles of value investing while navigating the complexities of financial markets.
| Statistic Name | Statistic Value |
| R-squared | 0.193 |
| Adjusted R-squared | 0.192 |
| F-statistic | 300.4 |
| Prob (F-statistic) | 1.67e-60 |
| Log-Likelihood | -3310.4 |
| No. Observations | 1258 |
| AIC | 6625. |
| BIC | 6635. |
| coef (const) | 0.0155 |
| coef | 1.2486 |
| std err (const) | 0.095 |
| P>|t| | 0.871 (const) |
| [0.025 | -0.171 (const) |
| 0.975] | 1.390 |
| Omnibus | 518.856 |
| Prob(Omnibus) | 0.000 |
| Jarque-Bera (JB) | 23170.299 |
| Skew | 1.167 |
| Prob(JB) | 0.00 |
| Kurtosis | 23.895 |
| Cond. No. | 1.32 |
| Alpha | 0.015479775415006253 |
| Beta | 1.2485749933123915 |
The linear regression model evaluating the relationship between WHD and SPY demonstrates a positive but relatively weak connection as indicated by the R-squared value of 0.193. This suggests that approximately 19.3% of the variation in WHD can be explained by its relationship with SPY. The alpha value of the regression, 0.015479775415006253, conveys the intercept term of the linear equation, representing the expected value of WHD when SPY is zero. Essentially, it reveals the average expected return of WHD that's independent of the market's (SPY's) movement.
Furthermore, the model's beta coefficient of 1.2485749933123915 highlights WHD's sensitivity relative to SPY fluctuations. A beta greater than 1 suggests that WHD is more volatile than the market. With this beta, WHD is expected to move 1.2486 times against every one-point move in SPY, depicting a greater than market volatility. The significance of this relationship is further supported by the F-statistic and its associated probability, indicating a very low chance that these results are due to random fluctuations. Despite the positive alpha and beta, the adjusted R-squared value underscores that a substantial portion of WHD's movements cannot solely be attributed to the market's performance, hinting at other factors influencing WHD's behavior.
Cactus, Inc. (WHD) conducted its third-quarter earnings call with significant participation from its leadership team, including Scott Bender, Chairman and CEO; Steve Tadlock, CFO and CEO of FlexSteel; Joel Bender, President; Steven Bender, COO; and Will Marsh, General Counsel. Alan Boyd, Director of Corporate Development and Investor Relations, opened the call, emphasizing the forward-looking nature of statements made during the discussion and the utilization of non-GAAP financial measures. The opening remarks highlighted the company's performance in the quarter, noting a decline in Pressure Control revenues due to decreased U.S. land rig count, while Spoolable Technologies revenues remained relatively stable. The company was proud to announce the repayment of bank debt acquired for the FlexSteel acquisition, ultimately leading to a debt-free status.
Steve Tadlock provided a detailed review of the financial results for the quarter. Total Q3 revenues stood at $288 million, with a noted decline in Pressure Control revenues by 8.4% sequentially, primarily due to reduced customer activity. Despite these challenges, Spoolable Technologies had an almost flat revenue, with a slight decrease of 1.2% sequentially. The adjusted EBITDA for the quarter was $103 million, marking an 11% decrease from the previous quarter, primarily due to the reduction in operating leverage. The company also highlighted the repayment of the remaining bank debt and adjustments in CapEx outlook to $35 million to $40 million, reflecting operational efficiencies and strategic financial management.
In his remarks, Scott Bender emphasized the company's resilience and strategic responses to the changing market conditions, including supply chain initiatives and the anticipation of introducing new product enhancements in the upcoming year. Despite the expected sequential decrease in Pressure Control revenues for the fourth quarter and a potential downturn in Spoolable Technologies revenues due to seasonal adjustments, Bender expressed confidence in the company's long-term strategy and its alignment with customer demand for premium equipment and services. The company's efforts to diversify and innovate within its product lines, combined with a strong financial position, underscored Cactus's commitment to maintaining its market leadership and capitalizing on future growth opportunities.
The question and answer session provided further insights into the company's operational strategies and market outlook. Discussions touched on market share, customer behavior, especially among private operators, and the impact of E&P consolidation on business opportunities. Leadership also discussed the potential for margin improvements, driven by product enhancements and efficiency initiatives. The session revealed a cautious yet optimistic view of the industry's trajectory, with Cactus poised to leverage its operational strengths and innovative capacity to navigate market challenges and support its growth narrative in the coming quarters.
Cactus, Inc. (WHD), in its 10-Q filing for the quarter ended September 30, 2023, reported key financial metrics and business activities. The filing highlighted the company's revenues, operating income, the impact of acquisitions, and future outlook amidst market risks.
During this quarter, Cactus experienced fluctuations in its business segments, namely Pressure Control and Spoolable Technologies. The Pressure Control segment, dedicated to wellhead and pressure control equipment, saw a slight decrease in revenues to $182.5 million, reflecting an 8.4% downturn from the previous quarter. This dip was attributed to lower sales of wellhead and production-related equipment coupled with diminished field services income due to reduced activity levels in the sector, although this was slightly offset by higher rental revenues.
Conversely, the Spoolable Technologies segment, which entails designing, manufacturing, and selling spoolable pipe technologies, posted revenues of $105.4 million, a minimal decrease from the preceding quarter. Notably, this segment's operating income marked a significant improvement, turning a previous loss into a $39.8 million gain. The positive shift was largely due to a reduction in expenses related to inventory step-up, intangible asset amortization, and a gain from the change in fair value of earn-out liability associated with the FlexSteel acquisition.
The filing underscored the FlexSteel acquisition's substantial influence on Cactus's financial and operating landscape. Completed on February 28, 2023, the acquisition was integrated into Cactus's operations and contributed notably to the company's revenue stream and asset base within the Spoolable Technologies segment. The financial results include approximately seven months of FlexSteel's performance.
Furthermore, the company disclosed its exposure to market risks, particularly noting the potential impact of recent conflicts in the Middle East on oil prices and global macroeconomic conditions. This factor was highlighted as a new variable that could sway Cactus's future performance, alongside traditional industry indicators such as oil and natural gas prices and drilling activity levels.
Cactus's strategic movements, including share repurchase programs authorized in June 2023, and capital expenditure plans ranging from $35 to $40 million for the fiscal year 2023, were evident. These initiatives underscored the company's efforts to bolster its market position and foster growth despite operational challenges and evolving market conditions.
Overall, the 10-Q filing revealed Cactus, Inc.'s adaptability in navigating market dynamics and integrating significant acquisitions to sustain its growth trajectory. The detailed account of financial performance, risk factors, and strategic direction provided a comprehensive overview of the company's standing and outlook as of September 30, 2023.
Cactus, Inc. (NYSE: WHD) stands as a beacon of engineering excellence and innovation in the energy sector, with its focus on designing, manufacturing, and renting highly engineered pressure control and spoolable pipe technologies. These offerings are vital for the drilling, completion, and production phases of unconventional onshore oil and gas wells, marking Cactus as a pivotal player in this niche market. This report aims to delve into recent developments at Cactus, Inc., including the declaration of dividends, financial strategies, and the forthcoming earnings report, to provide a comprehensive overview of the company's current standing and future outlook.
On January 23, 2024, the company announced a quarterly cash dividend approved by its Board of Directors, signaling a decisive move to return value to its shareholders. This dividend, amounting to $0.12 per share for Class A common stock with a payment date of March 14, 2024, not only reflects the company's solid financial health but also its confidence in its business model and future growth prospects. Holders of CC Units in Cactus Companies, LLC are also eligible for a similar distribution, underscoring the firm's inclusive approach to its financial rewards scheme.
Such financial maneuvers are critical in maintaining investor confidence and drawing future capital, which is indispensable for sustaining innovation and growth in the challenging realms of oil and gas exploration and production. The announcement was further detailed in a report by Yahoo Finance, highlighting a modest dividend yield of 1.1%. Despite not being the highest in the industry, this yield reflects a prudent financial strategy, ensuring dividends are well covered by earnings and cash flow, a crucial aspect for long-term sustainability.
The dividend coverage, underscored by a projected 79.9% growth in earnings per share (EPS) over the next year and a payout ratio of 14%, suggests a stable dividend policy. However, this optimism is tempered by the company's relatively short history of dividend payments since 2020 and a past performance showing a significant decrease in EPS over the past five years. Despite these challenges, there's an expectation of EPS growth in the next twelve months, offering a positive outlook but necessitating careful monitoring of the company's earnings trend.
Cactus, Inc.'s strategic presence through service centers across North America and Australia, coupled with its international outreach, emphasizes its commitment to providing comprehensive field services. This global footprint not only enhances the company's operational efficiency but also ensures the effective installation, maintenance, and handling of its specialized equipment.
The firm's announcement on February 1, 2024, regarding the scheduled release of its fourth quarter and full year 2023 financial results, further demonstrates its dedication to transparency and stakeholder engagement. Scheduled for after market close on February 28, 2024, with a follow-up conference call, this event is highly anticipated by the market. Stakeholders are eager to gain insights into Cactus's performance and strategic directions, hoping to gauge the company's resilience and adaptability amid the sector's dynamics.
In essence, the recent developments at Cactus, Inc. highlight a company that is not only financially sound but also strategically positioned to navigate the complexities of the energy sector. The firm's innovative product offerings, commitment to shareholder value, prudent financial strategies, and focus on transparency underscore its potential for sustained growth and stability. As the scheduled earnings report approaches, stakeholders remain watchful, hopeful for positive news that will reinforce confidence in Cactus, Inc.'s trajectory towards continued success and innovation.
Cactus, Inc. (WHD) has shown significant volatility fluctuations over the observed period from 2019-02-19 to 2024-02-16, as indicated by the ARCH model analysis. The zero mean model suggests that the asset returns fluctuate independently of their own past average levels, emphasizing pure volatility-driven movements. The ARCH model parameters, particularly omega and alpha[1], indicate a pronounced impact of recent volatility shocks on future volatility, revealing the asset's susceptibility to rapid and potentially large swings in return variability.
| Dep. Variable: | asset_returns |
| R-squared: | 0.000 |
| Mean Model: | Zero Mean |
| Adj. R-squared: | 0.001 |
| Vol Model: | ARCH |
| Log-Likelihood: | -3337.94 |
| AIC: | 6679.88 |
| BIC: | 6690.15 |
| No. Observations: | 1258 |
| Df Residuals: | 1258 |
| Df Model: | 0 |
| omega: | 9.1591 |
| alpha[1]: | 0.3168 |
To assess the financial risk associated with a $10,000 investment in Cactus, Inc. (WHD) over a one-year period, the analysis integrates both volatility modeling and machine learning predictions. This blended approach offers a multifaceted view of stock behavior, combining insights into historical volatility patterns with predictive analytics for future returns.
Volatility modeling is instrumental in quantifying the fluctuations in the stock's price over time. By analyzing the time-series data of Cactus, Inc., volatility modeling captures the dynamic, often unpredictable movement of stock prices based on historical patterns. This model identifies periods of high volatility, which are crucial for understanding the risk profile of the investment. In essence, it serves as a foundational tool for estimating the thresholds within which the stock price is likely to oscillate, offering investors a sense of potential price variability.
On the other side of the analysis, machine learning predictions employ advanced algorithms to forecast future stock returns. Specifically, the analysis leverages a machine learning approach known for its efficacy in capturing the complexities of financial time series data. This model assimilates various factors, including past performance, market conditions, and broader economic indicators, to predict the direction and magnitude of future stock movements. By doing so, it supplements the volatility assessment with a forward-looking perspective on returns, enabling a more comprehensive evaluation of investment risks and opportunities.
The core of this analysis lies in computing the Annual Value at Risk (VaR) at a 95% confidence level, which is calculated to be $404.73 for a $10,000 investment in WHD. VaR is a critical risk management tool that quantifies the maximum expected loss over a specific time frame, given normal market conditions. The 95% confidence level implies that there is a 5% chance that the investment could lose more than $404.73 over the year. This metric is pivotal for investors seeking to understand the extreme risk potential of their investment, equipping them with a tangible estimate of maximum plausible losses.
The synthesis of volatility modeling and machine learning predictions provides a robust framework for analyzing financial risk. The former delves into historical price dynamics to gauge stock volatility, while the latter forecasts future returns by deciphering complex patterns in financial data. Together, they furnish investors with a nuanced understanding of both the expected range of price fluctuations and the probabilistic outlook for stock performance.
The calculated VaR at a 95% confidence interval offers a critical risk parameter, encapsulating the essence of the investment's risk profile over the forecasted period. This innovative approach to risk assessment, combining retrospective volatility assessment with prospective return analysis, exemplifies the value of leveraging advanced statistical and computational techniques in financial decision-making.
When evaluating potential profitability for call options in Cactus, Inc. (WHD), it's essential to consider the options' Greeks, as these values provide vital insight into the risk/reward profiles of different contracts. For a target stock price 5% higher than the current price, focusing on the Delta, Gamma, Vega, Theta, and Rho, in addition to the premium, ROI (Return on Investment), and profit, will be paramount. Hence, I'll analyze multiple call options varying by strike price and expiration date.
One of the options that stands out is the one with a strike price of $40, expiring on March 15, 2024. This option has a high delta of 0.8734970748, indicating a strong sensitivity to the stock price movement; a relatively low gamma of 0.0331246409, suggesting minor changes in delta for a given move in the underlying stock; and a modest vega of 2.5468563477, pointing to limited exposure to volatility. The negative theta of -0.0276115046 implies a daily time decay in value, which is a natural characteristic of all options. With a considerable rho of 2.397493245, it suggests sensitivity to interest rate changes, though this is often of lesser concern in the short to intermediate term. Its relatively low premium of $3.08, combined with a high ROI of 1.7527597403 and a profit of 5.3985, makes it particularly attractive as an investment given our target stock price expectation.
Another intriguing option is the one with the same $40 strike price but a later expiration date of May 17, 2024. It exhibits a balanced delta of 0.7652971496, ensuring substantial participation in the stock's upside with less premium spent compared to the first option. Its gamma of 0.0263735592 shows a steady rate of change in delta, while a higher vega of 6.9513059694 indicates increased sensitivity to implied volatility a key consideration over longer periods. The theta here is -0.0219827914, signifying a slower rate of time decay, beneficial as the expiration is farther out. Notably, the rho of 6.6034801785 highlights greater exposure to interest rate fluctuations, a factor that can contribute to the option's price movement. With a premium of $4.5, ROI of 0.8841111111, and a profit of 3.9785, this option offers a balanced risk-reward profile suited for investors anticipating moderate volatility and a steady climb in WHD's stock price.
Considering these analyses, investors looking for the most profitable call options in Cactus, Inc. would do well to consider these choices. The call option expiring on March 15, 2024, with a $40 strike, provides an appealing mix of high immediate sensitivity to stock price movements and a significant ROI for those bullish on WHD's short-term prospects. Meanwhile, the May 17, 2024 expiration option, also with a $40 strike, offers a safer, albeit potentially less immediate, route to capitalize on anticipated stock appreciation, factoring in the stock's volatility and the time value. Ultimately, the choice between these options should be guided by the investor's risk tolerance, market outlook, and investment horizon.
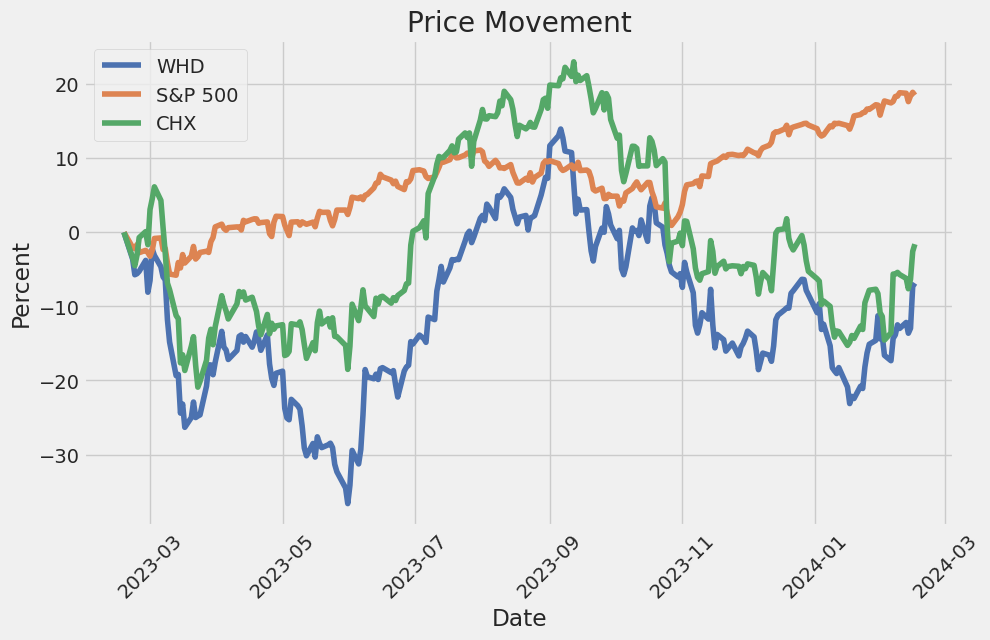
Similar Companies in Oil & Gas Equipment & Services:
ChampionX Corporation (CHX), Dril-Quip, Inc. (DRQ), Solaris Oilfield Infrastructure, Inc. (SOI), Expro Group Holdings N.V. (XPRO), Ranger Energy Services, Inc. (RNGR), MRC Global Inc. (MRC), Bristow Group Inc. (VTOL), RPC, Inc. (RES), NOV Inc. (NOV), Oceaneering International, Inc. (OII), Archrock, Inc. (AROC), Newpark Resources, Inc. (NR), Report: Schlumberger Limited (SLB), Schlumberger Limited (SLB), Halliburton Company (HAL), Report: Baker Hughes Company (BKR), Baker Hughes Company (BKR), Tenaris S.A. (TS), TechnipFMC plc (FTI)
https://finance.yahoo.com/news/cactus-announces-quarterly-cash-dividend-220000506.html
https://finance.yahoo.com/news/cactus-nyse-whd-paying-dividend-121351283.html
https://finance.yahoo.com/news/cactus-announces-timing-fourth-quarter-230000197.html
https://www.sec.gov/Archives/edgar/data/1699136/000169913623000140/whd-20230930.htm
Copyright © 2024 Tiny Computers (email@tinycomputers.io)
Report ID: aDt2NB
Cost: $0.51886
https://reports.tinycomputers.io/WHD/WHD-2024-02-17.html Home