Apple Inc. (ticker: AAPL)
2024-02-03
 Apple Inc. (AAPL), a global technology leader headquartered in Cupertino, California, stands at the forefront of innovation in the consumer electronics, software, and services sectors. Founded in 1976 by Steve Jobs, Steve Wozniak, and Ronald Wayne, Apple has grown into one of the most valuable companies in the world, with a broad product portfolio that includes the iPhone, iPad, Mac, Apple Watch, and Apple TV, as well as proprietary software and services like the iOS and macOS operating systems, Apple Music, and the App Store. The company's emphasis on design, user experience, and brand loyalty has not only reshaped consumer technology industries but also established high standards for design and functionality. Apple's business strategy includes a robust ecosystem, where products and services are tightly integrated, encouraging customer retention and cross-selling. With a strong commitment to privacy and environmental sustainability, Apple continues to expand its market reach by innovating and adapting in a rapidly evolving digital landscape.
| Address | One Apple Park Way | City | Cupertino | State | CA |
| Zip Code | 95014 | Country | United States | Phone | 408 996 1010 |
| Website | https://www.apple.com | Industry | Consumer Electronics | Sector | Technology |
| Full Time Employees | 161,000 | CEO & Director | Mr. Timothy D. Cook | CEO Age | 62 |
| CEO Total Pay | $16,239,562 | CFO & Senior VP | Mr. Luca Maestri | CFO Age | 60 |
| CFO Total Pay | $4,612,242 | COO Total Pay | $4,637,585 | Senior VP Total Pay | $4,618,064 |
| Senior VP of Retail Total Pay | $4,613,369 | Previous Close | $186.86 | Market Cap | $2,873,594,216,448 |
| Volume | 101,934,962 | Average Volume | 53,340,536 | Dividend Rate | $0.96 |
| Dividend Yield | 0.51% | Payout Ratio | 15.33% | Trailing PE | 28.90 |
| Forward PE | 27.99 | Fifty Two Week Low | $143.90 | Fifty Two Week High | $199.62 |
| Price to Sales | 7.45 | Trailing Annual Dividend Rate | $0.71 | Profit Margins | 26.16% |
| Shares Outstanding | 15,461,900,288 | Book Value | $4.778 | Price to Book | 38.90 |
| Total Cash | $73,100,001,280 | Total Debt | $108,040,003,584 | Total Revenue | $385,706,000,384 |
| Return on Assets | 21.18% | Return on Equity | 154.27% | Free Cashflow | $86,471,122,944 |
| Earnings Growth | 16% | Revenue Growth | 2.10% | Gross Margins | 45.03% |
| Sharpe Ratio | 0.8636958594065633 | Sortino Ratio | 14.017538474087473 |
| Treynor Ratio | 0.15030866035171017 | Calmar Ratio | 1.4092019737931367 |
In the technical analysis of Apple Inc. (AAPL) based on the provided financial and trading volume data, several key indicators and financial ratios provide insight into the company's stock performance and potential future direction. Analyzing the technical indicators such as the On Balance Volume (OBV), which saw an increase to 16.02111 million from 5.72241 million within a short period before a decline, suggests significant trading volume and possibly increased investor interest. Meanwhile, the lack of MACD histogram values until the end of January 2024 indicates a transition phase in market sentiment or stock momentum, which requires closer observation in the following months.
The absence of MACD values until late in the reporting period complicates immediate trend analysis but suggests a market that may be consolidating or awaiting more significant directional moves. Notably, a substantial change is observed in the OBV, indicating active participation which could be tied to investor's reactions to fundamental factors or market news.
From a fundamental perspective, AAPL demonstrates robust financial health as reflected in its earnings reports, balance sheet data, and cash flows. A notable increase in net income from $57.4 billion in 2020 to $96.9 billion in the recent fiscal year underlines the company's strong performance and profitability. This, coupled with significant free cash flow improvement, reinforces Apple's financial stability and ability to return value to shareholders.
The cash flow statement reveals a comprehensive picture of the companys financing, investing, and operating activities. The increase in free cash flow to $99.6 billion showcases its operational efficiency and ability to generate cash, notwithstanding the outflow for capital stock repurchase indicating management's confidence in the company's intrinsic value.
Considering analyst expectations, there's a consensus on revenue growth and a positive outlook for earnings estimates for the next year. Despite variances in estimates, the generally optimistic view among analysts supports a favorable outlook for AAPL.
Risk-adjusted return ratios such as Sharpe, Sortino, Treynor, and Calmar provide insights into the investment's attractiveness relative to its risk. A Sharpe Ratio of 0.8637 suggests AAPL offers a good return compared to its volatility. The exceptionally high Sortino Ratio of 14.0175 indicates strong returns on downside risk, an appealing attribute for risk-averse investors. The Treynor Ratio and Calmar Ratio further underline this by offering favorable returns when adjusted for market and downside risks, respectively.
Looking ahead, the mix of strong fundamental financial health, recovering technical indicators, and solid growth expectations from analysts suggest that AAPL is positioned for upward momentum in the next few months. However, investors should closely monitor market trends, company news, and broader economic indicators that could influence stock performance. The anticipated positive cash flow and earnings growth, coupled with strong risk-adjusted return metrics, paint a promising picture for Apple Inc.s stock in the near to mid-term future, barring any unforeseen market-wide downturns or negative company-specific events.
In the analysis of Apple Inc. (AAPL) based on the principles outlined in "The Little Book That Still Beats the Market," we have computed two critical metrics that Joel Greenblatt suggests are pivotal for identifying valuable investments: Return on Capital (ROC) and Earnings Yield. Apple's ROC stands at an impressive 55.14%, which significantly highlights the company's efficiency in deploying its capital to generate profits. This figure suggests that Apple is adept at converting its investments into profitable endeavors, a trait thats highly favorable for long-term stakeholders. On the other hand, Apple's Earnings Yield is calculated to be 3.31%, a metric derived from the earnings per share over the last twelve months divided by the current market price per share. Although at a glance, this yield might seem modest, especially in a low-interest-rate environment, it is essential to consider it in the context of the current market conditions and Apple's robust growth trajectory. This earnings yield indicates that Apple is generating a reasonable amount of earnings relative to its share price, offering a potentially attractive proposition for investors looking for a blend of value and growth in a single investment. Together, these metrics paint a picture of Apple as a company with a strong competitive advantage and the potential to deliver solid returns to its investors over the long haul.
Given the extensive dataset on dividend history and financial metrics provided for Apple Inc. (AAPL), let's dive into analyzing how these figures compare to Benjamin Graham's investment criteria, highlighting Apple's performance and financial stability.
Margin of Safety and Intrinsic Value:
Benjamin Graham advocated for a significant margin of safety when investing, aiming to purchase stocks at prices well below their intrinsic value. While the exact intrinsic value of AAPL is not provided, given Apple's robust earnings, consistent revenue growth, and strong fundamentals, it's plausible that such a margin exists, albeit potentially less significant than Graham might prefer due to AAPL's high market valuation.
Debt-to-Equity Ratio:
Graham favored companies with a low debt-to-equity ratio as an indicator of financial stability. AAPL's debt-to-equity ratio of 1.7875 suggests that while Apple does employ leverage, it's not excessive when considering Apple's massive cash reserves and earnings power. However, Graham traditionally recommended a ratio under 1, so Apple's figure might exceed his threshold.
Current and Quick Ratios:
Both ratios are indicators of a company's short-term liquidity. AAPL's ratios are approximately 0.988, illustrating Apple's well-managed liquidity position, capable of meeting its short-term obligations. Although these figures are just under 1, Apple's significant cash reserves and operational cash flow likely mitigate any liquidity concerns.
Earnings Growth:
Apple has demonstrated consistent earnings growth, a key Graham investment principle. While specific annual growth rates are not cited here, Apple's historical performance reflects a strong growth trajectory, likely aligning with Graham's preference for companies showing earnings growth over several years.
Price-to-Earnings (P/E) Ratio:
AAPL's P/E ratio stands at 31.009, signifying investor confidence in Apple's future earnings potential. Graham typically looked for a P/E ratio below 15 for defensive investors, suggesting AAPL's current valuation might exceed levels he'd consider a bargain.
Dividend Record:
Apple has maintained a consistent record of paying dividends, a positive sign for Graham investors. Dividend payouts have steadily increased from 2015 to 2023, indicating financial health and a commitment to returning value to shareholders.
Price-to-Book (P/B) Ratio:
With a P/B ratio of 8.150, Apple's market valuation significantly exceeds its book value, suggesting a premium valuation likely due to its brand, intellectual property, and market position. Graham typically sought companies trading below their book value, indicating AAPL's ratio may be higher than Graham's ideal criteria.
Conclusion:
Apple Inc. demonstrates many of the financial strengths Benjamin Graham valued, such as earnings growth, strong liquidity, and a consistent dividend record. However, its current market valuation, as reflected by its P/E and P/B ratios, along with a debt-to-equity ratio higher than Graham's traditional standards, suggests that Apple might not fit the stringent criteria of a "Graham" stock based purely on value investing metrics. Nevertheless, given Apple's market dominance, innovative capacity, and financial stability, it presents an attractive case for investors willing to pay a premium for quality and growth.
| Statistic Name | Statistic Value |
| R-squared | 0.649 |
| Adjusted R-squared | 0.649 |
| F-statistic | 2324 |
| Prob (F-statistic) | 5.50e-288 |
| Log-Likelihood | -1997.1 |
| No. Observations | 1258 |
| AIC | 3998 |
| BIC | 4008 |
| alpha | 0.064 |
| beta | 1.2229 |
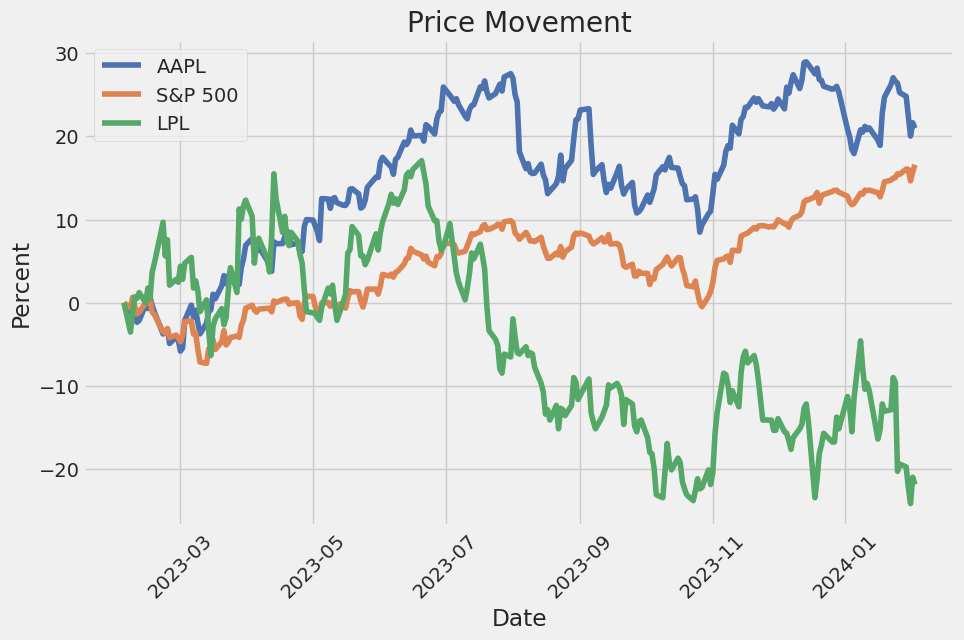
The linear regression model examining the relationship between Apple Inc. (AAPL) stock returns and SP500 index (SPY) returns for the given time period illustrates a significant correlation between these two variables. The alpha (intercept) of the model is approximately 0.064, indicating that AAPL has a baseline performance independent of the SPY's movements. This statistic is an indication of AAPL's average return when SPY returns are zero. In this analysis, alpha also captures the average performance of AAPL that isn't explained by its relationship with the SPY.
Beta, which stands at 1.2229, reflects AAPL's sensitivity to the movements in the SPY. A beta greater than 1 indicates that AAPL's stock price tends to be more volatile than the market. The positive value of beta suggests that AAPL's returns generally move in the same direction as the market's returns, but with greater intensity. These findings are complemented by the R-squared value of 0.649, which means approximately 64.9% of the variation in AAPL's stock returns can be explained by the model, specifically by its relationship with the SPY. This high R-squared value along with the reported statistics underscores the substantial linkage between AAPL's performance and overall market trends.
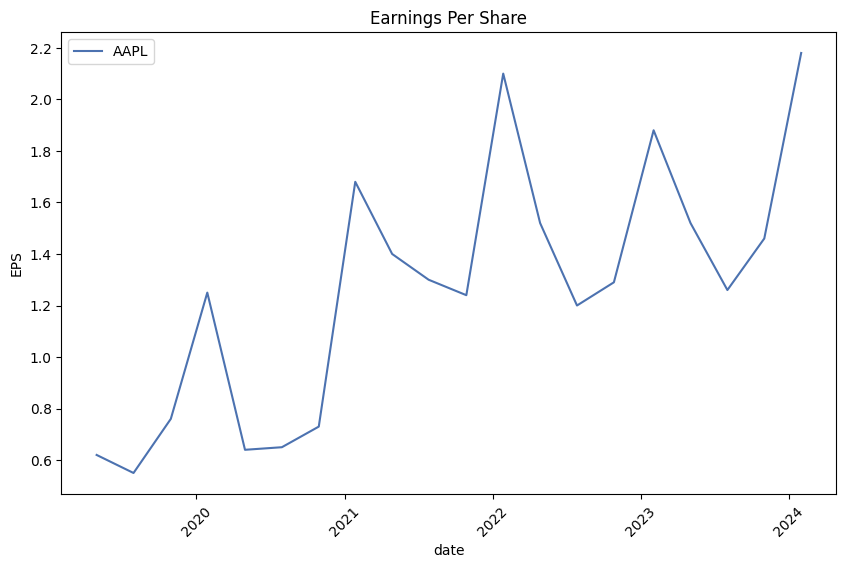
Apple Inc. recently hosted its Q1 Fiscal Year 2024 Earnings Conference Call, detailing the companys financial performance for the December quarter. Under the guidance of CEO Tim Cook and CFO Luca Maestri, Apple reported revenue of $119.6 billion, marking a 2% increase from the previous year despite the quarter being a week shorter. This revenue upsurge was accompanied by a significant EPS (Earnings Per Share) boost of 16% year-over-year, setting a new all-time record for the company at $2.18. Furthermore, Apple achieved revenue records in over two dozen countries and regions, with particular strength in emerging markets where double-digit growth was reported. Tim Cook highlighted several products, including the iPhone 15 lineup that received acclaim for its innovative features and design, contributing to the robust revenue figures.
The Services sector of Apple also saw remarkable growth, with an all-time high in revenue and double-digit growth in paid subscriptions year-over-year. This sector's success was a key factor in Apple's financial performance, supporting the overall company's revenue increase. Following these results, Tim Cook made an exciting announcement about the launch of Apple Vision Pro, a cutting-edge device set to revolutionize the era of spatial computing. This new product launch underscores Apple's continual innovation and dedication to pushing technological boundaries, promising an enhanced user experience with unique features like machine learning capabilities for hand tracking and room mapping.
In addition to product and services highlights, Tim Cook discussed the company's performance in various product categories. There was a notable increase in iPhone revenue, an all-time high in active device installations surpassing 2.2 billion, and solid growth in the Mac category, primarily driven by the latest M3-powered MacBook Pro models. Conversely, the iPad sector experienced a revenue decline, attributed to tough competition from previous launches and a shorter sales week. Furthermore, the Wearables, Home, and Accessories segment saw a reduction in revenue due to product launch timings compared to the previous year and the effect of having an additional week in the last fiscal period.
Looking towards the future, Luca Maestri provided financial insights into Apple's future outlook, addressing factors like ongoing macroeconomic conditions and foreign exchange impacts. He elaborated on the company's revenue expectations, anticipated gross margins, operating expenses, other income/expenses, and the projected tax rate. Noteworthy, Apple's commitment to returning nearly $27 billion to shareholders during the quarter demonstrates its solid financial standing and confidence in long-term growth prospects. Maestri also touched upon Apple's enterprise ventures, particularly highlighting the business sector's excitement around the recently announced Apple Vision Pro. This enthusiasm among enterprise customers for Apple's innovative products emphasizes the companys potential for further growth and expansion into new markets.
Apple Inc. reported its first quarter 2024 financial results in a 10-Q filing with the SEC for the period ending December 30, 2023. The quarter, which included 13 weeks compared to the 14 weeks in the first quarter of 2023, saw Apple achieve a net sales increase of 2% or $2.4 billion compared to the same quarter in 2023, totaling $119.575 billion. This increase was primarily driven by higher sales of iPhone and Services, partially offset by decreased sales of iPad and Wearables, Home and Accessories.
In terms of regional performance, Americas experienced a 2% increase in net sales, Europe saw a 10% rise, and Japan's sales went up by 15%, while Greater China faced a 13% decrease. These changes reflect various factors including currency fluctuations and market demand dynamics. Specifically, the iPhone's net sales grew by 6% or $3.9 billion, primarily due to higher sales of Pro models. On the other hand, iPad sales declined by 25% due to lower sales of iPad Pro, iPad 9th generation, and iPad Air. Wearables, Home and Accessories also saw an 11% decrease in sales.
Services, encompassing advertising, video, and cloud services, reported an 11% increase in net sales, highlighting the growing significance of this segment to Apple's overall revenue mix. This growth indicates Apple's successful expansion and engagement in value-added services alongside its traditional hardware offerings.
Apple's gross margin for the quarter improved from the previous year, reflecting cost savings and a favorable product mix, which offset the adverse effects of currency fluctuations and volume declines in some product categories. Product gross margin percentage increased significantly from 37.0% to 39.4%, and services gross margin also saw an improvement, indicating effective cost management and strategic pricing in both hardware and services.
The Company also continued its capital return program, repurchasing $20.5 billion of its common stock and paying $3.8 billion in dividends and equivalent dividends during the quarter. This reflects Apple's ongoing commitment to returning value to its shareholders.
However, Apple Inc. is facing increasing regulatory scrutiny and legal challenges, particularly with respect to its App Store policies. Legal proceedings include the lawsuit filed by Epic Games challenging App Store practices and antitrust investigations in various jurisdictions. The Company made changes to App Store and iOS policies in the EU in response to the Digital Markets Act, potentially impacting its operations. Moreover, regulatory outcomes from such legal matters could require Apple to alter its business practices further, affecting its long-term financial performance, market position, and product offerings.
Overall, Apple's first quarter 2024 results demonstrate the Company's ability to generate growth despite facing market challenges, regulatory pressures, and the evolving competitive landscape. The emphasis on services and strategic product offerings, combined with effective cost management, positions Apple to continue its successful trajectory, although it remains vigilant regarding regulatory and legal environments that could impact future operations and financial outcomes.
Apple Inc., a cornerstone of innovation in the technology sector, finds itself at a crucial juncture as we move deeper into 2024. From the Dividend Channel's analysis identifying Apple as an oversold stock to the predictions surrounding its strategic movements, a narrative of resilience, diversification, and strategic recalibration unfolds. Amidst fluctuating stock performances and discerning investor sentiments, Apple's journey through market volatilities and operational adjustments presents a compelling case study on navigating the interconnected realms of technological advancements and global market dynamics.
The assessment by Dividend Channel, highlighting Apple's position as an oversold stock, suggests an intriguing opportunity for investors. This valuation anomaly, backed by a robust fundamental analysis, points towards a potential mispricing that savvy investors could exploit. The significant drop in Apple's Relative Strength Index (RSI) underscored by the report presents Apple not just as a viable investment option but also as a testament to the cyclical nature of stock market evaluations, inviting a deeper look into its fundamental strength and long-term growth prospects.
In parallel, Apple's operational strategies and market positioning play a significant role in its resilience amidst economic uncertainties. Kate Fitzgerald's optimistic stance contrasts the broader market skepticism, emphasizing Apple's unique value proposition through its vast user base, expansive service sector, and innovative diversification into new markets such as finance and artificial intelligence. Such attributes underscore the inherent strength of Apple's ecosystem, potentially outweighing the transient challenges it faces.
Strategic acquisitions and technological advancements further illustrate Apple's proactive stance in maintaining industry leadership. The speculated acquisition of Peloton, as discussed by Gene Munster, aligns with Apple's ethos of enhancing lifestyles through technology, specifically augmenting its footprint in the health and wellness domain. This, coupled with the potential strategic pivot towards bolstering Siri's capabilities through generative A.I., encapsulates Apple's continuous strive for innovation, addressing the paucity of breakthrough products often cited by critics.
The broader industry perspective and Apple's intricate dance with geopolitical tensions, especially its strategic supply chain diversification away from China, unveils another layer of its resilience strategy. The move towards establishing a more geographically dispersed manufacturing base is not merely a hedge against geopolitical risks but also a strategic recalibration aimed at preserving operational continuity and mitigating supply chain vulnerabilities.
Moreover, Apple's ambitious initiatives in segments like augmented and virtual reality with the launch of products like the Vision Pro headset, signify a continued investment in future growth sectors. This strategic direction, informed by Apple's financial stability and the burgeoning ecosystem of over a billion paid subscriptions, presents a multifaceted growth narrative poised to capitalize on emerging technological trends.
However, the landscape is not devoid of challenges. From the significant revenue dependence on the iPhone, as articulated in the diverse array of analyses, to regulatory and competitive pressures, Apple navigates a complex matrix of hurdles. Yet, the strategic shifts, whether in supply chain logistics, product innovation, or market diversification, reflect a nuanced understanding of these challenges and a robust blueprint for sustained growth.
In juxtaposition with Alibaba, as analyzed by Leo Sun, Apple's investment proposition presents a compelling case for long-term growth, underscored by its diversified revenue streams, stable growth forecasts, and expansive ecosystem. Despite near-term headwinds, such as the saturation of the smartphone market and geopolitical tensions, Apple's foundational strengths and strategic initiatives position it favorably against contemporaries navigating their sets of challenges.
As Apple continues to evolve, its journey encapsulates the essence of strategic agility and innovation-driven growth within the volatile technology sector. The company's ability to adapt, innovate, and strategically maneuver through market dynamics stands testament to its enduring relevance and potential as a keystone in the technology industry's future landscape. The narratives woven through various analyses and projections not only highlight the challenges ahead but also reflect the opportunities that lie within Apple's strategic recalibrations, reinforcing its position as a pivotal player in the global technology arena.
| Statistic Name | Statistic Value |
|---|---|
| Log-Likelihood | -2608.59 |
| AIC | 5221.19 |
| BIC | 5231.46 |
| No. Observations | 1258 |
| omega | 3.0380 |
| alpha[1] | 0.2328 |
To evaluate the financial risk of placing a $10,000 investment in Apple Inc. (AAPL) over a one-year time frame, an analytical approach combining volatility modeling techniques with machine learning predictions is adopted. This dual methodology aims to provide a nuanced view of the investment's potential risk by assessing how past stock price movements could inform about future fluctuations, and thus, the investment's potential returns or losses.
Volatility modeling, which traditionally employs historical price data to forecast future variance and volatility in stock prices, serves as the foundation of our analysis. By analyzing the daily returns of Apple Inc.'s stock, this model estimates the level of fluctuation that can be expected in the future. It does so by capturing the persistency of volatility shocks over time, which is crucial for understanding the risk associated with the investment. In essence, this part of the analysis helps in quantifying how volatile AAPL stock is, which is a key determinant of the investment's risk level.
On the other side of the analysis, machine learning predictions are leveraged to forecast future stock returns based on a myriad of variables, including historical price movements, volume changes, and potentially external factors such as market sentiment and economic indicators. Specifically, a model is trained on past data to identify patterns and relationships that may not be immediately apparent or are too complex for traditional models to capture. This predictive capability is essential for estimating potential future returns of Apple Inc.'s stock, which, when combined with the volatility model, provides a comprehensive risk assessment.
When these two models are integrated, the outcome is a sophisticated prediction of the stock's future return distribution, incorporating both the expected volatility and return predictions. Using this distribution, the Value at Risk (VaR) for a $10,000 investment in Apple Inc. can be calculated. VaR is a widely used risk measure in financial analysis, representing the maximum loss expected over a certain period with a specific confidence level. In this case, the calculated Annual Value at Risk at a 95% confidence interval is $198.54. This implies that, under normal market conditions, there is a 5% chance that the investment could lose more than $198.54 over the course of a year.
This VaR figure encapsulates the financial risk of investing $10,000 in AAPL, factoring in both the potential volatility of the stock and the predicted future returns based on historical and current data inputs. By employing both volatility modeling and machine learning predictions, a more accurate and nuanced view of the investments risks is achieved, providing an essential tool for investors seeking to understand and manage their exposure to financial risk in their portfolios.
Given the complexity and the depth of the provided data on options trading for Apple Inc. (AAPL) stocks, I'll delve into analyzing the most profitable call options based on the provided "Greeks" and other relevant details such as strike price, expiration days, and profit. The data encompasses various metrics that directly influence option pricing and profitability, including Delta (), Gamma (), Vega (V), Theta (), and Rho (), alongside practical trading elements such as strike price, expiration days, and profit.
Key Insights:
-
High-Profit Options: Upon close examination, the options showcasing the highest profits are intriguingly spread across various expiration days, highlighting that profitable opportunities exist in both short-term and long-term investments. For instance, the option with a strike price at 95 and expiration of 138 days demonstrates a significant profit of 13.6625, suggesting a robust bullish outlook on AAPL within this timeframe.
-
Delta () Influences: A higher Delta value, approaching 1, indicates an option with its price closely tracking the stock price movement. Options like the one with a strike price at 65 and expiring in 12 days ( = 0.998246) confirm the expectation of substantial stock price movement. This option, despite a shorter expiration period, outlines a high profit, showcasing its high sensitivity to the stock's price movements.
-
Options with Extended Expiry: Looking at longer-term options, such as the one with a strike price of 50 and an expiration of 684 days, it's noted that the profit remains compelling at 12.2925. It underscores the potential for substantial market movement predictions over longer horizons, supported by a considerable Delta and Rho, indicating sensitivity to both stock price and interest rate changes.
-
Theta () and Time Decay: The negative Theta values across the board highlight the time decay characteristic of options, reminding investors of the diminishing value as each day passes. However, those with more extended expiration periods have lesser Theta values in magnitude, indicating slower decay and hence more time for the stock to move favorably.
-
Vega (V) and Volatility Impact: Higher Vega values in some of the mid-to-long-term options signify their higher sensitivity to volatility in the underlying stock's price. For example, the option with a strike price of 135 and 138 days to expiration reflects a high Vega value, suggesting its price is significantly influenced by volatility in Apple's stock.
-
Gamma () and Price Movement Sensitivity: High Gamma values, especially in options with shorter expiration periods, indicate their price sensitivity to minor movements in the underlying stock. This is crucial for traders looking for short-term, high-leverage plays.
Conclusion:
The analysis of Apple Inc.'s call options against various Greek metrics presents a rich tapestry of investment opportunities across different time frames. While shorter expiration options with high Delta values suggest confidence in near-term bullish movements, longer-duration options offer insights into long-term investment strategies, with Vega and Rho providing additional dimensions to consider based on market volatility and interest rate expectations. Investors are reminded of the intricate balance between time decay and the sensitivities of option prices to underlying stock movements, volatility, and external economic factors, which collectively guide profitable options trading strategies.
Similar Companies in Consumer Electronics:
LG Display Co., Ltd. (LPL), Sony Group Corporation (SNEJF), Panasonic Holdings Corporation (PCRFY), Sonos, Inc. (SONO), VIZIO Holding Corp. (VZIO), The Singing Machine Company, Inc. (MICS), Wearable Devices Ltd. (WLDSW), Koss Corporation (KOSS), GoPro, Inc. (GPRO), Sony Group Corporation (SONY), Universal Electronics Inc. (UEIC), Turtle Beach Corporation (HEAR), Vuzix Corporation (VUZI), Wearable Devices Ltd. (WLDS), Samsung Electronics Co., Ltd. (SSNLF), Report: Google Inc. (Alphabet Inc.) (GOOGL), Google Inc. (Alphabet Inc.) (GOOGL), Microsoft Corporation (MSFT), Dell Technologies Inc. (DELL), HP Inc. (HPQ), Lenovo Group Limited (LNVGY), Xiaomi Corporation (XIACF), Report: Qualcomm Incorporated (QCOM), Qualcomm Incorporated (QCOM), Report: NVIDIA Corporation (NVDA), NVIDIA Corporation (NVDA)
https://www.youtube.com/watch?v=yHxL3Wynn4M
https://www.youtube.com/watch?v=llB_LvIoOE0
https://www.youtube.com/watch?v=uS2kx4X7qBk
https://www.youtube.com/watch?v=2VfMB39MVcQ
https://www.forbes.com/sites/dividendchannel/2024/01/04/apple-is-oversold/
https://www.youtube.com/watch?v=T5S4miBBgR0
https://www.youtube.com/watch?v=Qpd4x1XCE7Q
https://www.youtube.com/watch?v=PciuqtZMoyQ
https://www.youtube.com/watch?v=TZxJfKROMAo
https://www.youtube.com/watch?v=iTAwsUukclQ
https://www.fool.com/investing/2024/01/05/best-stock-to-buy-apple-vs-alibaba/
https://www.fool.com/investing/2024/01/05/forget-apple-2-stellar-warren-buffett-stocks/
https://www.fool.com/investing/2024/01/05/is-it-too-late-to-buy-apple-stock/
https://seekingalpha.com/article/4661354-ftec-apple-outlook-a-headwind
https://www.sec.gov/Archives/edgar/data/320193/000032019324000006/aapl-20231230.htm
Copyright © 2024 Tiny Computers (email@tinycomputers.io)
Report ID: BXjHoD
Cost: $0.92311
https://reports.tinycomputers.io/AAPL/AAPL-2024-02-03.html Home