QUALCOMM Incorporated (ticker: QCOM)
2024-01-27
 QUALCOMM Incorporated, with its ticker symbol QCOM, is a multinational corporation headquartered in San Diego, California. It is a pivotal player in the semiconductor and telecommunications equipment industry, renowned for its contributions to the development and commercialization of wireless products and services. The company specializes in the design and manufacturing of digital communication products, particularly those related to the 3G, 4G, and emerging 5G mobile technologies. QUALCOMM's portfolio includes a series of system-on-chip (SoC) solutions, branded as Snapdragon, which power a wide range of mobile devices. In addition to hardware, QUALCOMM is a major provider of intellectual property, holding a significant number of patents critical to wireless standards. This has established a lucrative licensing segment complementing its direct product sales. The company's influence in the semiconductor space, as well as its strategic importance in the rollout of next-generation wireless infrastructure, positions it as a key barometer for the health of the global mobile technology sector.
| Full Time Employees | 50,000 | CEO Name | Mr. Cristiano Renno Amon | CEO Age | 53 |
| CEO Total Pay | $2,380,094 | General Counsel Name | Ms. Ann N. Cathcart Chaplin | General Counsel Age | 50 |
| General Counsel Total Pay | $1,047,970 | CTO Name | Dr. James H. Thompson | CTO Age | 59 |
| CTO Total Pay | $1,293,602 | Last Fiscal Year End | 2022-09-25 | Market Cap | $168,331,640,832 |
| Previous Close | $154.47 | Day Low | $150.38 | Day High | $152.98 |
| Dividend Rate | $3.20 | Dividend Yield | 2.07% | Payout Ratio | 47.55% |
| Five Year Avg Dividend Yield | 2.5% | Beta | 1.322 | Trailing PE | 23.12 |
| Forward PE | 14.27 | Volume | 7,680,906 | Average Volume (10 days) | 9,016,980 |
| Market Cap | $168,331,640,832 | Fifty Two Week Low | $101.47 | Fifty Two Week High | $157.98 |
| Price To Sales (TTM) | 4.699 | Enterprise Value | $176,668,114,944 | Profit Margins | 20.19% |
| Net Income to Common | $7,338,999,808 | Trailing EPS | $6.52 | Forward EPS | $10.56 |
| Total Cash | $11,324,000,256 | Total Debt | $16,067,000,320 | Total Revenue | $35,819,999,232 |
| Debt To Equity | 74.45 | Revenue Per Share | $32.068 | Return on Assets | 10.81% |
| Return on Equity | 37.07% | Operating Cash Flow | $11,299,000,320 | Free Cash Flow | $9,816,500,224 |
| Gross Margins | 55.698% | EBITDA Margins | 29.199% | Operating Margins | 23.022% |
| Sharpe Ratio | -13.195850336122597 | Sortino Ratio | -202.68733223008098 |
| Treynor Ratio | 0.1276082555279975 | Calmar Ratio | 0.6390207069096009 |
Analysis of Qualcomm Incorporated (symbol: QCOM) reveals potential stock price movement over the next few months through the lens of technical analysis, fundamental analysis, and balance sheet review.
Technical Analysis: The technical indicators show a positive upward trend leading to the last trading day, with the On Balance Volume (OBV) in millions significantly increasing from 0.48686 to 30.47112 over the timeframe presented. This suggests a strong buying pressure behind the stock. Moreover, the Moving Average Convergence Divergence (MACD) histogram has been positive and in a growing trend, further substantiating the bullish momentum of QCOM stock.
Fundamental Analysis: On the fundamental side, QCOM displays robust financial metrics, characterized by a solid gross margin of 55.698% and an operating margin of 23.022%. These high margin figures indicate efficient operations and strong pricing power. Additionally, the EBITDA of $9.946 billion and net income from continuing operations of $7.339 billion suggest a healthy cash flow and profitability. Such strong fundamentals may positively influence investor sentiment and, subsequently, the stock price.
Balance Sheet: The latest balance sheet figures unveil a strong financial position for QCOM, with a significant increase in cash, cash equivalents, and short-term investments totaling $11.324 billion. Moreover, with the retained earnings standing at $20.733 billion and a working capital of $12.836 billion, the company has a commendable solvency and liquidity posture, typically viewed as bullish by investors who value financial stability.
Analyst Expectations: The analysts' outlook provides additional promising signs. The average earnings estimate for the next year (2025) is $10.56 per share, representing an expectation of continued business growth. Sales estimates for the next year suggest an 8% growth, raising bullish prospects for the stock. The EPS revisions in recent days have also been upward, reflecting optimism in the company's future performance.
Risk-Adjusted Performance Ratios: All risk-adjusted return ratios indicate challenging times, with a substantial negative Sharpe and Sortino ratio, but a positive Treynor and Calmar suggests that the stock has the potential to outweigh systematic risk over time. Investors may interpret these mixed signals with caution, balancing risk and return expectations accordingly.
Score Summary: The Altman Z-Score of 5.601 suggests that QCOM is not in the distress zone, while a Piotroski Score of 6 out of 9 indicates an average-to-strong financial position.
Taking into account the combined insights of technical, fundamental, and analytical perspectives, QCOM is poised for potential continued upward momentum in the stock price over the next few months. The established trend, supported by strong market volume, favorable analyst expectations, robust financials, and an adequately capitalized balance sheet, all contribute to this positive outlook. However, it's always advisable to monitor market dynamics and company performance as conditions evolve.
| Alpha | 0.0460 |
| Beta | 1.3461 |
| R-squared | 0.453 |
| Adj. R-squared | 0.453 |
| F-statistic | 1,041 |
| Prob (F-statistic) | 7.33e-167 |
| Log-Likelihood | -2,622.3 |
| AIC | 5,249 |
| BIC | 5,259 |
| No. Observations | 1,258 |
| Df Residuals | 1,256 |
| Df Model | 1 |
In the linear regression model conducted on QCOM (Qualcomm Incorporated) with SPY (a representative of the S&P 500 index) as the explanatory variable, the alpha value is identified as approximately 0.046. This alpha, which is also known as the intercept of the regression, represents the expected return on QCOM when the return on SPY is zero. In this context, a positive alpha of 0.046 suggests that QCOM has a slight performance advantage over the baseline market return as represented by SPY, when market movements are not taken into account. However, it should be noted that the statistical significance of this alpha is relatively weak given the associated p-value of 0.402, which is much higher than the conventional 0.05 threshold for significance.
The beta value for QCOM in relation to SPY stands at around 1.346, indicating that for every 1% change in the market's return, QCOM is expected to change by approximately 1.346% in the same direction. This implies that QCOM is more volatile than the market. Additionally, the coefficient determination (R-squared) of 0.453 suggests that around 45.3% of the variation in QCOM's returns can be explained by the returns of the market index SPY. The adjusted R-squared also confirms this explanatory power, maintaining the same value of 0.453, signifying that the number of predictors in the model is appropriately taken into account.
QUALCOMM Incorporated Q4 and Fiscal Year 2023 Earnings Call Summary
The earnings call for Qualcomm in Q4 and the fiscal year of 2023 began with an introduction by Mauricio Lopez-Hodoyan, Vice President of Investor Relations. During the call, Qualcomm's President and CEO, Cristiano Amon, reported that Qualcomm exceeded expectations with non-GAAP revenues of $8.7 billion and earnings of $2.02 per share. Their chipset business reported revenues of $7.4 billion, reflecting stability in the Android handset environment, with licensing business revenues at $1.3 billion. Stability and progress have also been seen in Qualcomm's technological advancements and operational efficiency. Amon highlighted Qualcomm's significant role in the rapidly evolving on-device generative AI, which is anticipated to transform user experiences across various platforms, including smartphones, laptops, XR, and automotive technology.
The Snapdragon platform has significantly improved AI processing performance and power efficiency, leading to expansion into the PC market with the Snapdragon X Elite platform. This new platform boasts the foundry Oryon CPU and an impressive integrated Adreno GPU, offering industry-leading performance. Qualcomm is also at the forefront of networking with design wins for Wi-Fi 7 solutions and collaborative relationships with major telecommunications firms. The automotive sector continues to evolve digitally, and Qualcomm's Digital Chassis solutions are central to this transformation, with several high-profile partnerships such as Cadillac and BMW.
In the Q&A session, there were queries about the growing significance of on-device generative AI and its potential impact on Qualcomm's revenue streams. Questions also addressed Qualcomm's competitive positioning in light of new developments, both from traditional competitors and new market entrants like Huawei ramping up its chipset production. Additionally, Cristiano Amon discussed the new Snapdragon products' superior performance metrics and their potential influence on Qualcomm's market share and average selling prices (ASPs) in the coming year.
Akash Palkhiwala, Chief Financial Officer at Qualcomm, reviewed the financial results, with Q4 non-GAAP revenues higher than expected. He summarized the fiscal year 2023 results, stressing the focus on technology leadership, revenue diversification, and operating efficiency. Automotive delivered record revenues with significant growth, and significant cost reductions were achieved. Going forward, indications of stabilization in handset demand were noted, and the company provided guidance for the first fiscal quarter of 2024, expecting revenues between $9.1 billion and $9.9 billion with EPS ranging from $2.25 to $2.45. Qualcomm remains optimistic about the future trends in heterogeneous mobile computing and on-device generative AI, considering those as solid drivers for content growth and expansion into new device categories.
The call concluded with no further statements from Cristiano Amon, thanking all participants and expressing gratitude to Qualcomm employees, suppliers, and partners.
The third quarter of fiscal 2023 for QUALCOMM Incorporated (QCOM) highlighted several financial challenges and strategic actions. QCOM's total revenues for the quarter were $8.5 billion, marking a decrease of 23% compared to the preceding year. Specifically, equipment and services revenue experienced a $2.2 billion decline, while licensing revenue decreased by $327 million. The macroeconomic environment, notably weakened consumer demand for smartphones and elevated customer inventory levels, significantly impacted QCOM's revenue streams.
The Qualcomm CDMA Technologies (QCT) segment, QCOMs semiconductor business, saw a 24% decrease in revenues, primarily due to lower handset and IoT revenues. Within QCT, the handset revenue stream contracted by $1.8 billion, predominantly due to decreased chipset shipments despite higher per chipset revenues from a favorable mix and increased average selling prices. Automotive revenues increased, driven by higher demand for digital cockpit products, while IoT revenues fell due to decreased demand across consumer and edge networking products.
The Qualcomm Technology Licensing (QTL) segment posted a decrease of 19% in revenue for the third quarter, largely due to decreased volume of estimated sales of 3G/4G/5G-based multimode products and the completion of the recognition of certain upfront license fee considerations from their agreement with Nokia.
Despite these difficulties, QCOM generated substantial operating income and sustained profitability, though it evidently was affected by the global economic conditions and inventory dynamics. The cost of revenues decreased by $1.0 billion, leading to a gross margin of 55%, a 1% decrease year-over-year.
Additional financial pressures included increased product costs, which negatively influenced the QCT gross margin. Operating expenses also saw variations, with research and development expenses increasing by $170 million in the quarter, driven by higher share-based compensation expense and revaluation of the company's deferred compensation plan obligation. Selling, general, and administrative expenses saw a reduction due to lower acquisition-related expenses and employee-related costs.
QCOM's income tax expense for the quarter was notably lower at $22 million compared to the previous year's $509 million. This was largely due to benefits from foreign-derived intangible income deductions, the research and development tax credit, as well as adjustments related to a change in sourcing of research and development expenditures.
Discontinued operations yielded a net income tax benefit of $68 million for the quarter, mainly attributable to a gain recognized on the sale of the Active Safety business.
On the liquidity front, QCOM reported cash, cash equivalents, and marketable securities totaling $8.6 billion, a boost from the previous figure of $6.4 billion. The companys capital return program involved repurchasing $2.6 billion worth of shares and paying out similar amounts in dividends. Regarding debt, QCOM reported issuing $1.9 billion in unsecured fixed-rate notes with expirations in 2033 and 2053, using the proceeds partly to repay debts maturing in January 2023.
QCOM operates a fabless production model, relying on third-party suppliers for manufacturing, assembly, and testing, subjecting them to supply assurance and technology leadership risks. The company's future growth pivots on the development and commercialization of 5G technologies and expansion into automotive and IoT industries.
Overall, the SEC 10-Q filing for QCOM for Q3 of fiscal 2023, dated July 31, 2023, reflects the challenges posed by the global economic environment and reliance on a concentrated customer base while also highlighting the company's strategic investment in growth areas beyond mobile handsets and the continued importance of 5G technologies.
Analyzing the performance of Qualcomm Incorporated (QCOM) provides a rich narrative of the company's position in a competitive and evolving market. Excelling in both financial health and product innovation, Qualcomm continues to be a focal point for investors and industry players alike in the wireless communication and semiconductor industries.
Zacks Equity Research keenly monitors Qualcomm's financial metrics, outlining the company's ability to deliver a robust performance that often exceeds market expectations. On December 14, 2023, Qualcomm's stock price experienced a noteworthy increase, reaching $141.54 and surpassing gains recorded by major market indices. The company's positive trajectory over the preceding month, along with expectations of an earnings per share (EPS) of $2.34 and a slight revenue growth for the upcoming quarterly release, reflect a cautiously optimistic outlook.
Further insight into Qualcomm's financial health is the increase of its dividend payout to $0.80 per share quarterly as of December 21, 2023. This strong financial gesture is backed by an impressive cash flow from operations reported for the fiscal fourth quarter, coupled with a strategy to capitalize on the 5G technology wave. By diversifying its product offerings and expanding its footprint in emergent tech categories, Qualcomm is set to bolster its long-term revenue stability.
However, the company also faces market challenges, as a dip in consumer spending led to subdued device sales. Responding to these changing market conditions, Qualcomm is pivoting away from a sole focus on smartphone chipsets to embrace the Internet of Things (IoT) and automotive markets.
Analysts remain attuned to Qualcomm's potential to outperform earnings predictions, with the company's Zacks Rank currently at #3 (Hold) and a positive Earnings ESP signal suggesting another likely earnings surprise. This data guides investor expectations for the earnings release on February 1, 2024.
Innovations in product offerings are at the core of Qualcomm's strategy. The Snapdragon XR2+ Gen 2 chip, announced on January 4, 2024, as reported by CNBC, showcases the company's dedication to cutting-edge technology. The chip, which will power the next generation of AR headsets, has the potential to set new benchmarks in the mixed reality market. Collaborations with Samsung and Google solidify Qualcomm's position as a competitor to Apple's highly priced Vision Pro headset, with the new Snapdragon chip expected to offer high-resolution experiences at presumably lower price points.
Despite the high-stakes competitive dynamics within the semiconductor industry, Qualcomm illustrated its commitment through a continued focus on high-end automotive chips. With a consumer shift toward mid-range vehicles, adjustments may be necessary to align chip production with automotive manufacturers' demand. Moreover, potential challenges stemming from Apple's foray into the VR market are met with Qualcomm's strategic advancement of VR chipsets that can enable Android and Windows-based competitors.
The overall financial outlook for Qualcomm, based on Zacks Equity Research, presents the company as an investment option of significant potential. With a current average brokerage recommendation (ABR) of 1.75, the stock exudes a favorable sentiment from brokerage firms. Still, dependencies on brokerage recommendations remain cautioned, and investors are better served by considering quantitative models like the Zacks Rank, which emphasize earnings estimate revisions. As of the latest analysis, Qualcomm's expected earnings for the current year have climbed slightly, accompanied by a Zacks Rank of #2 (Buy).
Despite experiencing a larger market fall on January 4, 2024, as per the report on Zacks.com, Qualcomm continues to maintain a positive growth forecast with its shares advancing notably over the past month. The company's anticipated earnings results and the strategic importance of its Wireless Equipment industry ranking, despite being in the lower 35% of the 250+ industries reviewed by Zacks, indicate that Qualcomm is placed to navigate future market scenarios adeptly.
To keep up with Qualcomm's performance and industry analysis, Zacks.com offers a plethora of research and updates. Detailed reports and models are available to investors to facilitate informed decision-making in this dynamic sector. To follow Qualcomm's trajectory and access the latest updates on earnings, dividends, and technological advancements, visit the various reports and announcements referenced in this comprehensive narrative.
Over the period from January 28, 2019, to January 26, 2024, Qualcomm Incorporated (QCOM) experienced some degree of share price volatility. The volatility can be understood through an ARCH model, which identifies how much the stock's returns deviate from a mean level over time. Key features of Qualcomm's volatility in this period include a baseline volatility level (omega) measured at 5.3307 with statistical significance, indicating how much variability there is in the stock returns, and a measure of how much past volatility impacts current volatility (alpha[1]) estimated at 0.2300, again significant and suggesting a moderate influence of past volatility on current volatility patterns.
Here's the requested HTML table displaying these statistics:
| Dep. Variable: | asset_returns |
| Mean Model: | Zero Mean |
| Vol Model: | ARCH |
| Log-Likelihood: | -2,955.18 |
| AIC: | 5,914.36 |
| BIC: | 5,924.64 |
| No. Observations: | 1,258 |
| Df Residuals: | 1,258 |
| Df Model: | 0 |
| omega: | 5.3307 |
| alpha[1]: | 0.2300 |
To analyze the financial risk of a $10,000 investment in QUALCOMM Incorporated (QCOM) over a one-year period, a combination of volatility modeling and machine learning predictions can be applied. These models serve to capture different aspects of the risk profile associated with the QCOM investment: the former focuses on the stock's historical volatility, while the latter projects future performance based on various input features.
Volatility modeling is particularly adept at providing insights into the variability of a stock's returns over time, which is crucial for understanding investment risks. The model is calibrated on historical price data and recognizes patterns in the variance of returns, allowing for the estimation of future volatility periods. By applying this model to QCOM's stock, we capture the dynamic nature of its risk profile, noting periods where the stock may exhibit higher or lower volatility than the market average.
On the other hand, machine learning predictions involve a sophisticated algorithm that learns from past data to forecast future stock returns. In this context, a machine learning model, such as the one mimicking a forest of decision trees used for regression tasks, can be employed to identify complex, non-linear relationships between various market features and QCOM's performanceprojections that are valuable when evaluating future return scenarios.
The synergy of these two approaches offers a more robust assessment of risk for the QCOM investment. By associating the volatility measurements with the predictive power of machine learning, it's possible to simulate a range of future return outcomes and evaluate the probability of experiencing significant losses.
From this integrated analysis, Value at Risk (VaR) can be computed, which represents a statistical measure of the maximum potential loss over a specified timeframe given a certain level of confidence. For a $10,000 investment in QCOM, the calculated VaR at a 95% confidence interval is $307.27. This means that there is a 95% chance that the investment will not lose more than $307.27 in value over the course of one year.
Understanding this VaR figure is essential, as it quantifies the potential downside risk of the investment in QCOM and is indicative of the maximum expected loss under normal market conditions. Prospective and current investors can use this information to gauge the risk level and assess whether it aligns with their individual risk tolerance and investment strategy. Given that this number encapsulates both volatility analysis and future return prediction, it serves as a comprehensive risk metric derived from state-of-the-art financial modeling techniques.
Similar Companies in Semiconductors:
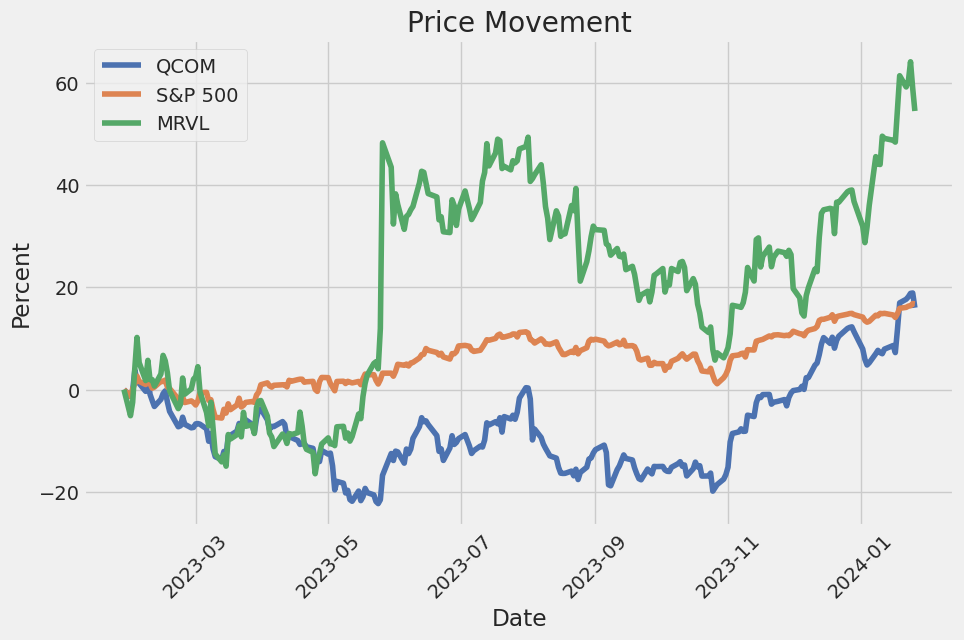
Report: Marvell Technology, Inc. (MRVL), Marvell Technology, Inc. (MRVL), Report: Micron Technology, Inc. (MU), Micron Technology, Inc. (MU), Report: Advanced Micro Devices, Inc. (AMD), Advanced Micro Devices, Inc. (AMD), Report: Intel Corporation (INTC), Intel Corporation (INTC), Report: Taiwan Semiconductor Manufacturing Company Limited (TSM), Taiwan Semiconductor Manufacturing Company Limited (TSM), Broadcom Inc. (AVGO), Report: NVIDIA Corporation (NVDA), NVIDIA Corporation (NVDA), Report: Texas Instruments Incorporated (TXN), Texas Instruments Incorporated (TXN), Skyworks Solutions, Inc. (SWKS), Report: Analog Devices, Inc. (ADI), Analog Devices, Inc. (ADI), Xilinx, Inc. (XLNX)
https://www.zacks.com/stock/news/2198289/qualcomm-qcom-exceeds-market-returns-some-facts-to-consider
https://www.fool.com/investing/2023/12/18/3-cheap-tech-stocks-to-buy-right-now/
https://www.zacks.com/stock/news/2200965/5-technology-stocks-that-hiked-dividends-to-watch-in-2024
https://seekingalpha.com/article/4659127-qualcomm-under-appreciated-garp-re-iterating-buy
https://www.youtube.com/watch?v=-8fbplsSPS8
https://www.zacks.com/stock/news/2204578/why-qualcomm-qcom-could-beat-earnings-estimates-again
https://www.cnbc.com/2024/01/04/qualcomm-announces-snapdragon-xr2-gen-2-chip-for-ar-headsets.html
https://seekingalpha.com/article/4661141-semiconductors-winners-losers-start-of-2024
https://www.proactiveinvestors.com/companies/news/1037560?SNAPI
https://www.youtube.com/watch?v=_FHut4BJE88
https://www.youtube.com/watch?v=Qpd4x1XCE7Q
https://www.sec.gov/Archives/edgar/data/804328/000080432823000043/qcom-20230625.htm
Copyright © 2024 Tiny Computers (email@tinycomputers.io)
Report ID: GDUUYci
Cost: $0.90327
https://reports.tinycomputers.io/QCOM/QCOM-2024-01-27.html Home