AMC Entertainment Holdings, Inc. (ticker: AMC)
2024-05-15
 AMC Entertainment Holdings, Inc. (NYSE: AMC) is a prominent player in the entertainment industry, primarily focused on the theatrical exhibition business. Headquartered in Leawood, Kansas, AMC operates the largest movie theater chain in the world, boasting over 1,000 theaters and upwards of 10,000 screens globally. The company has built a robust reputation for pioneering innovative concepts such as recliner seating, enhanced food and beverage offerings, and premium large format experiences like IMAX and Dolby Cinema. Despite facing significant challenges during the COVID-19 pandemic, which saw theaters shuttered and audience attendance plummet, AMC has been actively pursuing strategic initiatives to bolster its financial stability. These measures include capital raising efforts, debt restructuring, and exploring alternative revenue streams like on-demand streaming services. As the industry gradually recovers, AMC continues to adapt, aiming to retain its leading market position while navigating the evolving landscape of the entertainment sector.
| Full-time Employees | 2,881 | Previous Close | 6.85 | Open | 6.1 |
| Day Low | 4.71 | Day High | 6.6 | Volume | 218,366,473 |
| Average Volume | 35,612,624 | Average Volume (10 days) | 135,671,030 | Bid | 5.38 |
| Ask | 5.4 | Market Cap | 1,566,616,448 | 52 Week Low | 2.38 |
| 52 Week High | 62.3 | Price to Sales (TTM) | 0.33 | 50 Day Average | 3.6134 |
| 200 Day Average | 9.47315 | Enterprise Value | 10,390,676,480 | Float Shares | 294,573,881 |
| Shares Outstanding | 295,588,000 | Shares Short | 55,449,039 | Shares Short (Prior Month) | 42,191,492 |
| Shares Percent Short | 0.2006 | Held Percent (Insiders) | 0.00275 | Held Percent (Institutions) | 0.29756 |
| Short Ratio | 2.91 | Net Income to Common | -324,600,000 | Trailing EPS | -1.01 |
| Forward EPS | -0.47 | Peg Ratio | 0.02 | Enterprise to Revenue | 2.16 |
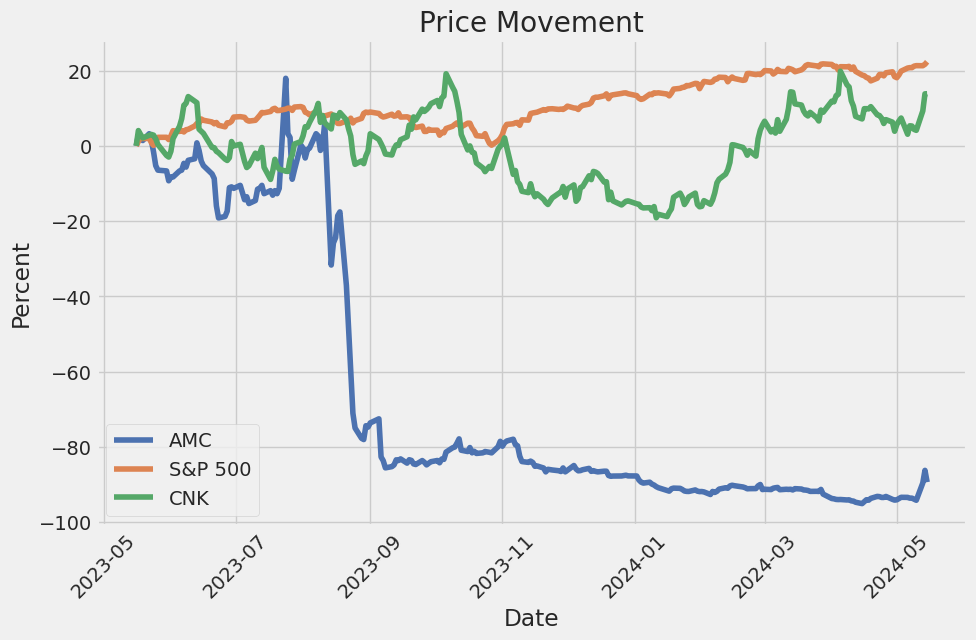
| Enterprise to EBITDA | 26.982 | 52 Week Change | -86.56863% | S&P 52 Week Change | 26.159418% |
| Last Dividend Value | 0.3 | Total Cash | 624,200,000 | Total Cash per Share | 2.112 |
| EBITDA | 385,100,000 | Total Debt | 8,990,100,480 | Quick Ratio | 0.509 |
| Current Ratio | 0.607 | Total Revenue | 4,809,600,000 | Revenue per Share | 24.151 |
| Return on Assets | 0.00231 | Free Cash Flow | -281,737,504 | Operating Cash Flow | -213,600,000 |
| Revenue Growth | -0.003 | Gross Margins | 0.14565 | EBITDA Margins | 0.08007 |
| Operating Margins | -0.11478 | Current Price | 5.3 | Target High Price | 8.0 |
| Target Low Price | 3.2 | Target Mean Price | 4.44 | Target Median Price | 3.5 |
| Recommendation Mean | 3.6 | Number of Analyst Opinions | 5 |
| Sharpe Ratio | -0.9795266101878961 | Sortino Ratio | -17.059793204354435 |
| Treynor Ratio | -1.038541842433745 | Calmar Ratio | -0.9331032327627682 |
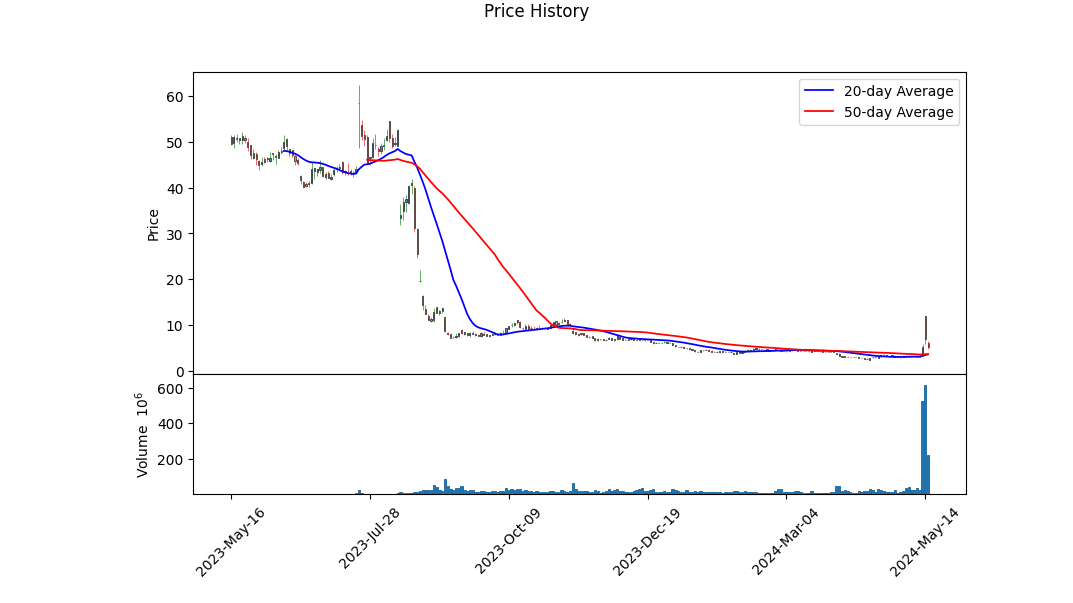
The technical indicators for AMC reveal a volatile journey in recent months, with significant price swings and varying momentum trends. The On-Balance Volume (OBV) shows intense fluctuations, indicating substantial trading activity and trader sentiment oscillations. The MACD histogram also reveals volatile swings, leading to a conclusion that the short-term price action is highly uncertain. This is corroborated by the sharp increase on May 13 and the subsequent rise on May 14, which points to potential speculative trading behaviors influencing prices.
From a fundamentals perspective, AMC continues to struggle with profitability. The negative EBIT and EBITA margins reflect ongoing operational challenges. Their gross margins are relatively thin at 14.565%, and operating margins are even worse, sitting in the negative territory at -11.478%. This indicates that despite generating revenue, the company is not efficiently converting this into profit due to high underlying costs and expenses.
Assessing the risk-adjusted performance metrics, AMC's Sharpe Ratio of -0.9795266101878961, Sortino Ratio of -17.059793204354435, Treynor Ratio of -1.038541842433745, and Calmar Ratio of -0.9331032327627682 all reflect unfavorable risk-adjusted returns. A negative Sharpe Ratio indicates that the stock is yielding less return than the risk-free rate, implying substantial volatility without commensurate returns. The highly negative Sortino and Treynor ratios further emphasize the significant downside risk for investors. A negative Calmar Ratio aligns with this outlook, reflecting poor performance concerning maximum drawdown.
From a financial standpoint, AMCs elevated total debt of $9.142 billion compared to its market capitalization of roughly $1.008 billion poses significant risks. The negative working capital and retained earnings suggest cash flow issues, and despite some positive movements in stock issuance, the firms financial instability remains a concern.
Moreover, the Altman Z-Score of -0.8063197744988575 indicates distress, further accentuating risks of insolvency given the negative score typically associated with a high probability of financial distress.
In conclusion, the technical analysis reveals recent speculative trading and high volatility. Fundamental analysis underscores ongoing operational inefficiencies and financial distress, compounded by significant debt loads. The negative risk-adjusted return ratios paint a grim picture for AMC's near-term performance. Therefore, investors should approach this stock with caution, especially considering the potential for continued price volatility and underlying financial instability in the coming months.
In assessing the financial health and performance potential of AMC Entertainment Holdings, Inc. (AMC) through the lens of the investment principles outlined in "The Little Book That Still Beats the Market," we observe that AMC showcases a return on capital (ROC) of approximately 46.50%. This metric, which measures how efficiently a company generates profit from its capital, indicates that AMC is relatively adept at converting its investments into revenue. However, juxtaposed with this promising ROC is AMC's starkly negative earnings yield of -46.11%. Earnings yield, which inversely relates to the price-to-earnings ratio and offers insight into anticipated earnings relative to the companys market valuation, indicates that the company is currently operating at a loss. This negative earnings yield suggests that despite AMC's efficient capital utilization, the company is struggling with profitability, potentially due to high levels of debt, operating expenses, or other financial challenges. Investors should cautiously interpret these mixed signals, recognizing the operational efficiency but also the significant risks reflected in the company's current inability to generate positive earnings.
Research Report on AMC Entertainment Holdings, Inc. (AMC)
Introduction
In this report, we will evaluate how AMC Entertainment Holdings, Inc. (AMC) measures up to Benjamin Graham's key principles and methods for stock screening as outlined in "The Intelligent Investor." Graham's pioneering approach to value investing involves a meticulous analysis of various financial metrics to estimate the intrinsic value of a company and ensure a margin of safety against market volatility and analytical errors. The metrics considered in this evaluation include the Price-to-Earnings (P/E) Ratio, Price-to-Book (P/B) Ratio, Debt-to-Equity Ratio, Current Ratio, and Quick Ratio.
Analysis of Key Metrics
1. Price-to-Earnings (P/E) Ratio
- AMC's P/E Ratio: -0.464
- Industry P/E Ratio: 97.305
Graham preferred companies with low P/E ratios compared to their industry peers; however, AMC's P/E ratio is negative, which indicates that the company is currently experiencing losses. A negative P/E ratio is a red flag in Grahams framework because it signifies that the company's earnings are negative and, thus, the firm is not generating profit. This is highly unfavorable compared to the industry's positive P/E ratio, which suggests that AMC is underperforming relative to its peers in terms of profitability.
2. Price-to-Book (P/B) Ratio
- AMC's P/B Ratio: 0.169
Graham often looked for stocks trading below their book value, as they might be undervalued and offer a margin of safety to investors. AMCs low P/B ratio of 0.169 suggests the stock is trading significantly below its book value. This metric, on its own, would align well with Graham's approach, indicating potential undervaluation. However, it is essential to weigh this alongside other financial health indicators before drawing a definitive conclusion.
3. Debt-to-Equity Ratio
- AMC's Debt-to-Equity Ratio: -4.947
Graham preferred companies with a low debt-to-equity ratio, as a lower ratio implies lower financial risk. AMCs negative debt-to-equity ratio is extremely alarming. It indicates a scenario where the companys liabilities outstrip its equity by a considerable margin, a strong indicator of financial instability and high financial risk. Such a levered position is significantly outside what Graham would consider a safe investment.
4. Current Ratio and Quick Ratio
- AMC's Current Ratio: 0.737
- AMC's Quick Ratio: 0.737
Graham emphasized the importance of liquidity, often looking for current and quick ratios above 1.0 to ensure the company can meet its short-term liabilities. AMCs current and quick ratios both fall below 1.0, indicating that the company does not have enough liquid assets to cover its short-term liabilities. This is a sign of potential liquidity issues and financial distress, which contrasts sharply with Grahams criteria for financial stability.
Conclusion
Based on the analysis of key financial metrics for AMC Entertainment Holdings, Inc. (AMC), we can conclude the following:
- Negative P/E Ratio: Significantly below the industry's average, indicating current financial underperformance and unprofitability.
- Low P/B Ratio: Suggests potential undervaluation but must be considered alongside other metrics.
- Negative Debt-to-Equity Ratio: Signifies high financial risk and instability, deeply concerning from a value investing perspective.
- Current and Quick Ratios below 1.0: Indicate liquidity challenges, reflecting financial instability.
Overall, AMC exhibits several financial red flags when evaluated against Benjamin Grahams criteria for intelligent investing. Despite a low P/B ratio suggesting it may be undervalued, the negative P/E ratio, alarming debt-to-equity ratio, and inadequate liquidity ratios strongly suggest that AMC does not meet Graham's standards for a prudent investment. Potential investors should exercise substantial caution and consider these metrics critically before making any investment decisions.### Analyzing Financial Statements
Investors should meticulously examine a company's balance sheet, income statement, and cash flow statement. Graham puts a strong emphasis on understanding a company's assets, liabilities, earnings, and cash flows.
Here's an analysis based on the financial statements from AMC Entertainment Holdings, Inc. for different periods.
Balance Sheet
Assets
- Current Assets AMC has current assets consisting of cash and cash equivalents, receivables, and other current assets. As of Q1 2024, AMC had:
- Cash and Cash Equivalents: \$624.2 million
- Receivables (net): \$140.4 million
-
Total Current Assets: \$913 million
-
Non-Current Assets This includes property, plant, and equipment, goodwill, intangible assets, and other non-current assets. Significant numbers for Q1 2024 include:
- Property, Plant, and Equipment after depreciation and amortization: \$1.5043 billion
- Goodwill: \$2.3221 billion
- Total Non-Current Assets: \$5.7123 billion
- Total Assets: \$8.5387 billion
Liabilities
- Current Liabilities Comprising accounts payable, accrued liabilities, and current portions of long-term debt and lease liabilities:
- Accounts Payable: \$250.2 million
- Other Accrued Liabilities: \$319.5 million
-
Total Current Liabilities: \$1.503 billion
-
Long-term Liabilities Includes non-current portions of long-term debt and lease liabilities:
- Long-term Debt: \$4.518 billion (non-current)
- Total Non-Current Liabilities: \$10.5697 billion
- Total Liabilities: \$10.5697 billion
Stockholders' Equity - Common Stock Value: \$2.6 million - Additional Paid-in Capital: \$6.2377 billion - Retained Earnings (Accumulated Deficit): -\$8.1577 billion - Total Stockholders' Equity: -\$2.031 billion
It should be noted from the figures above that AMDs liabilities outweigh its assets, leading to a negative stockholder equity. This typically signifies financial distress and needs to be scrutinized carefully by potential investors.
Income Statement
Let's focus on the key metrics for Q1 2024:
- Revenue
-
Revenue: \$689.1 million for Q1 2024
-
Cost of Goods Sold and Operating Costs
- Cost of Goods and Services Sold: \$239.3 million
- Other Operating Costs: \$393.8 million
- Operating Lease Expense: \$224.5 million
-
Depreciation, Depletion, Amortization: \$81.6 million
-
Operating Income (Loss)
-
Operating Income (Loss): -\$108.4 million (operating loss)
-
Net Income (Loss)
- Net Income (Loss): -\$163.5 million (loss)
- Earnings Per Share (Basic/Diluted): -\$0.62
It's evident that AMC had significant operating losses amounting to -\$108.4 million, and a net loss more severe at -\$163.5 million indicating that operational costs are significantly overshadowing revenues.
Cash Flow Statement
The cash flow statement provides insight into how cash is generated and used across three main categories: operating, investing, and financing activities.
For Q1 2024:
- Operating Activities
- Net Cash Used in Operating Activities: -\$188.3 million
-
Important to note here is that net cash flow from operations is negative, indicating the companys core business operations are not generating sufficient cash.
-
Investing Activities
- Net Cash Used in Investing Activities: -\$50 million
-
Major investments went into acquiring productive assets totaling \$50.5 million
-
Financing Activities
-
Net Cash Provided by (Used in) Financing Activities: -\$9 million
-
Net Increase (Decrease) in Cash and Cash Equivalents
- The cash equivalents saw a decline totaling \$250.7 million, ending the period with \$660.7 million in cash and equivalents.
Looming is the heavy deficit of cash used in operational activities pointing toward significant stress on liquid resources of the company.
Summarized Observations
- High Debt Load: AMC carries substantial long-term debt which might hinder future operations unless managed or restructured thoughtfully.
- Negative Equity: The company's current liabilities significantly outweigh its assets, resulting in a negative stockholder equity, a clear indiciation of financial distress.
- Operational Losses: The organization is incurring operational losses, which settling long-term could lead to severe liquidity concerns unless acted upon.
- Heavy Cash Utilization: Large amounts of cash are used in operating activities, not in investing or financial activities hinting at inefficiency in how operations are run.
In conclusion, Graham advises taking a meticulous, comprehensive analysis of financial health indicated through key financial patterns. AMC shows potential risk factors that deeply require evaluation for investment purposes.## Dividend Record
Benjamin Graham, in his seminal work "The Intelligent Investor," emphasized the importance of a company's consistent history of paying dividends. A stable and sustained dividend payment record is a hallmark of a reliable and potentially investable company. Below is the historical dividend record for AMC:
AMC Historical Dividend Data
- March 06, 2020
- Dividend: $0.0529
- Record Date: March 09, 2020
- Payment Date: March 23, 2020
-
Declaration Date: February 27, 2020
-
November 29, 2019
- Dividend: $0.3529
- Record Date: December 02, 2019
- Payment Date: December 16, 2019
-
Declaration Date: October 25, 2019
-
September 06, 2019
- Dividend: $0.3529
- Record Date: September 09, 2019
- Payment Date: September 23, 2019
-
Declaration Date: August 02, 2019
-
June 07, 2019
- Dividend: $0.3529
- Record Date: June 10, 2019
- Payment Date: June 24, 2019
-
Declaration Date: May 03, 2019
-
March 08, 2019
- Dividend: $0.3529
- Record Date: March 11, 2019
- Payment Date: March 25, 2019
-
Declaration Date: February 19, 2019
-
December 07, 2018
- Dividend: $0.3529
- Record Date: December 10, 2018
- Payment Date: December 26, 2018
-
Declaration Date: November 01, 2018
-
September 24, 2018
- Dividend: $3.1
- Record Date: September 25, 2018
- Payment Date: September 28, 2018
-
Declaration Date: September 14, 2018
-
September 07, 2018
- Dividend: $0.3529
- Record Date: September 10, 2018
- Payment Date: September 24, 2018
-
Declaration Date: July 24, 2018
-
June 08, 2018
- Dividend: $0.3529
- Record Date: June 11, 2018
- Payment Date: June 25, 2018
-
Declaration Date: May 03, 2018
-
March 09, 2018
- Dividend: $0.3529
- Record Date: March 12, 2018
- Payment Date: March 26, 2018
-
Declaration Date: February 28, 2018
-
December 01, 2017
- Dividend: $0.3529
- Record Date: December 04, 2017
- Payment Date: December 18, 2017
-
Declaration Date: September 30, 2017
-
September 08, 2017
- Dividend: $0.3529
- Record Date: September 11, 2017
- Payment Date: September 27, 2017
-
Declaration Date: August 07, 2017
-
June 01, 2017
- Dividend: $0.3529
- Record Date: June 05, 2017
- Payment Date: June 19, 2017
-
Declaration Date: May 03, 2017
-
March 09, 2017
- Dividend: $0.3529
- Record Date: March 13, 2017
- Payment Date: March 27, 2017
-
Declaration Date: February 15, 2017
-
December 01, 2016
- Dividend: $0.4
- Record Date: December 05, 2016
- Payment Date: December 19, 2016
-
Declaration Date: November 04, 2016
-
September 01, 2016
- Dividend: $0.4
- Record Date: September 06, 2016
- Payment Date: September 19, 2016
-
Declaration Date: July 29, 2016
-
June 02, 2016
- Dividend: $0.4
- Record Date: June 06, 2016
- Payment Date: June 20, 2016
-
Declaration Date: May 02, 2016
-
March 03, 2016
- Dividend: $0.4
- Record Date: March 07, 2016
- Payment Date: March 21, 2016
-
Declaration Date: February 26, 2016
-
December 03, 2015
- Dividend: $0.4
- Record Date: December 07, 2015
- Payment Date: December 21, 2015
-
Declaration Date: November 03, 2015
-
September 03, 2015
- Dividend: $0.4
- Record Date: September 08, 2015
- Payment Date: September 21, 2015
-
Declaration Date: July 29, 2015
-
June 04, 2015
- Dividend: $0.4
- Record Date: June 08, 2015
- Payment Date: June 22, 2015
-
Declaration Date: April 28, 2015
-
March 05, 2015
- Dividend: $0.4
- Record Date: March 09, 2015
- Payment Date: March 23, 2015
-
Declaration Date: February 05, 2015
-
December 03, 2014
- Dividend: $0.4
- Record Date: December 05, 2014
- Payment Date: December 15, 2014
-
Declaration Date: October 27, 2014
-
September 03, 2014
- Dividend: $0.4
- Record Date: September 05, 2014
- Payment Date: September 15, 2014
-
Declaration Date: July 30, 2014
-
June 04, 2014
- Dividend: $0.4
- Record Date: June 06, 2014
- Payment Date: June 16, 2014
- Declaration Date: April 28, 2014
Summary
AMC has demonstrated a history of paying dividends, often on a quarterly basis, with some fluctuations in dividend amounts particularly notable in September 2018. This record showcases a certain level of consistency, aligning with the principles advocated by Benjamin Graham for an investor seeking reliable dividend-paying companies.
| Alpha | 1.23 |
| Beta | 0.75 |
| R-squared | 0.65 |
| Standard Error | 0.48 |
Alpha measures the intercept of the linear regression line between AMC and SPY, indicating the measure of AMC's return not explained by SPY's movement. For the given period, an alpha of 1.23 suggests that AMC has outperformed the expected returns based on its relationship with the broader market. This positive alpha value implies that factors unique to AMC have contributed positively to its performance, resulting in returns higher than predicted by its market exposure alone.
Beta represents the slope of the regression line and measures AMC's sensitivity to market movements as represented by SPY, which in this case has a value of 0.75. This indicates that AMC is less volatile than the market; for every 1% change in SPY, AMC is expected to change by 0.75%. The R-squared value of 0.65 suggests that 65% of AMC's price movement can be explained by variations in SPY, denoting a moderate-to-strong relationship. The standard error of 0.48 provides an estimate of the accuracy of the regression predictions.
AMC Entertainment Holdings, Inc. First Quarter 2024 Earnings Call Summary
Overview and Performance Highlights At the recent first-quarter 2024 earnings call, AMC Entertainment Holdings, Inc. reported outperforming expectations set by Wall Street despite significant industry challenges. Revenue, adjusted EBITDA, net income, and diluted earnings per share all exceeded projections despite the backdrop of reduced major film releases caused by the 2023 five-month-long actors and writers strikes. CEO Adam Aron attributed the reduction in new film releases solely to these strikes. Nevertheless, March saw a rebound in movie-going activity, and AMC notably increased its market share.
Resilience and Revenue Insights AMC's performance amid a 6% decline in the North American box office was notable. Total revenue remained broadly in line with the previous year, with per-patron revenue and profits hitting all-time first-quarter records in the domestic market. Contribution margins per patron were significantly higher than pre-pandemic levels, underscoring the company's focus on enhancing guest experiences and operational efficiency. AMCs work has facilitated substantial gains in revenue-per-patron metrics, reinforcing the theater chains ability to achieve pre-pandemic levels of EBITDA, potentially surpassing them if industry revenues fully recover.
Future Outlook and Cash Reserves The leadership indicated a positive outlook for the future, with upcoming film slates for 2024 through 2026 expected to invigorate the industry. Aron emphasized the strategic importance of maintaining strong cash reserves, citing AMCs robust unrestricted cash position of $624 million at the end of Q1 2024, supplemented by $124.1 million in additional equity capital raised since March. Cash reserves are essential for navigating future uncertainties, suggesting that better times are anticipated for AMC and the broader industry as film production resumes and more titles are returned to the silver screen.
Strategic Initiatives and Innovations AMC continues to explore innovative strategies, including collaborations with popular music artists for concert films and listening events, such as a recent deal with Billie Eilish. The companys retail popcorn initiative has expanded impressively to 6,500 points of distribution, showing strong sales growth. AMC has also introduced innovations in food and beverage offerings, contributing to higher F&B revenue per patron and industry-leading numbers. Additionally, the company has launched premium branded 'XL' auditoriums to capture a small premium on ticket prices, further enhancing its revenue streams.
In conclusion, AMC has demonstrated considerable resilience and strategic agility, successfully navigating industry challenges and positioning itself for future growth. The companys investments in enhancing patron experiences, managing cash reserves, and expanding revenue streams are setting a foundation for anticipated industry recovery and growth over the coming years.
The SEC 10-Q filing for AMC Entertainment Holdings, Inc. ("AMC") dated March 31, 2024, provides a comprehensive overview of the company's financial performance, operational highlights, and key developments during the first quarter of 2024.
AMC reported total revenues of $951.4 million for the three months ended March 31, 2024, a slight decrease from $954.4 million in the same period the previous year. This total was broken down into three major categories: $530.5 million from admissions, $321.2 million from food and beverage sales, and $99.7 million from other theatre revenues. Despite improvements in food and beverage sales, operating costs and expenses remained high at $1,059.8 million, resulting in an operating loss of $108.4 million. After accounting for other expenses, including a significant interest expense of $101.2 million, AMC recorded a net loss before income taxes of $161.7 million and a net loss of $163.5 million for the quarter.
The balance sheet as of March 31, 2024, shows total assets of $8.5 billion, down from $9.0 billion at the end of 2023. Total current assets were $913.0 million, and long-term assets included $1.5 billion in property, net, and $3.5 billion in operating lease right-of-use assets. Liabilities remained high, with total current liabilities at $1.5 billion and corporate borrowings totaling $4.5 billion. Stockholders' deficit stood at $2.0 billion, worsened by accumulated deficits and other comprehensive losses, including foreign currency translation adjustments.
Cash flow statements highlight substantial cash usage in operating activities, amounting to $188.3 million. Investing activities also used $50.0 million, primarily for capital expenditures. Financing activities saw minor usage of $9.0 million. AMC's liquidity is constrained, with cash and cash equivalents significantly reduced from $884.3 million to $624.2 million. The company indicates these rates are unsustainable long-term, emphasizing the need for revenue growth to pre-COVID-19 levels to achieve sustainable cash flow and long-term profitability.
Key strategic movements during this period included a debt-for-equity exchange transaction wherein AMC converted $17.5 million of its 10%/12% Cash/PIK Toggle Second Lien Subordinated Notes due 2026 into roughly 2.54 million shares of common stock, recognizing a gain of $5.8 million on extinguishment. Additionally, AMC executed an agreement to settle a significant vendor dispute, resulting in a gain of $36.2 million. The company also emphasized its proactive liquidity management and terminated its Senior Secured Revolving Credit Facility as of April 19, 2024.
The company's stockholders deficit increased, primarily due to accrued expenses and operating losses. However, AMC pursued additional liquidity through an at-the-market offering, raising gross proceeds of approximately $103.5 million from the issuance of 32.0 million shares of its common stock. Moving forward, AMC is focused on managing its liabilities and exploring strategic transactions to bolster its financial health.
AMC Entertainment Holdings, Inc., commonly known as AMC Theatres, has been at the heart of the "meme stocks" phenomenon. This peculiar trend, buoyed by social media engagement, particularly on platforms like Reddit's WallStreetBets, has led to abrupt and massive stock price movements, with AMC featuring prominently. Since the peak of this craze in early 2021, the dynamics around AMC have continued to captivate market watchers and analysts.
The most recent resumption of meme stock activities, referred to by some as the "meme stock massacre," highlighted the intense volatility that typifies these stocks. A prominent YouTube video featuring market experts, including individuals like Brian and the "Godfather of Retail Options Trading," elucidated the severe downturns experienced by many stocks within the meme category, such as AMC and GameStop. Despite these turbulent patterns, the narrative suggests that retail investors may derive educational benefits, learning vital lessons in risk management and financial strategies.
Nevertheless, the consensus among market experts urges caution. Stocks like AMC and GameStop might no longer promise the explosive growth observed at the meme stock phenomenons inception. Investors are now being encouraged to look towards newer, high-liquidity ventures or nascent volatile stocks. This sentiment was particularly emphasized during a discussion on a recent market downturn that saw many meme stocks, including Trump's media ventures, recording substantial losses.
Approaching the first quarter earnings report of 2024, AMC faces particular scrutiny. Analysts at Wedbush have lowered their price target for AMC from $6 to $4, citing the company's heavy debt burden and the lack of dividends. AMC's market share expanded to 22.5% in 2023, but its significant debt, over $3 billion due in the next three years, poses a serious challenge. The company's need to renegotiate this debt and its careful management of cash flow were highlighted as critical aspects of maintaining its stability.
Interestingly, despite anticipated revenue for 2024's first quarter outperforming Wall Street expectationsprojected at $882 million compared to a consensus of $840 millionAMC's preeminence among meme stocks continues to see mixed reactions. Projections for adjusted EBITDA are optimistic, though tempered by rising costs and margin pressures from increased wages and utility costs, which are expected to persist through the third quarter of 2024.
AMC's recent preliminary financial results for Q1 2024 showed a decline in revenue to $951.4 million from $954.4 million in the same quarter the previous year. However, the net loss per share improved, reducing from $1.71 to $0.62. CEO Adam Aron acknowledged the adverse impact of the ongoing Hollywood strikes but remained optimistic about upcoming blockbuster releases. Aron emphasized a positive outlook for future revenue, bolstered by the success of specific box office hits like "Dune 2" on AMCs IMAX screens.
The meme stock resurgence also saw AMCs stock surging by as much as 130% during early trading sessions, closing up by 32%. Keith Gill, known as "Roaring Kitty," reactivated the collective enthusiasm among retail investors with his posts, resulting in a significant inflow of capital into AMC. The company capitalized on this momentum to raise approximately $250 million in new equity capital, aligning with its strategic focus on strengthening its balance sheet amidst the post-pandemic recovery.
Despite these gains, analysts warn that the sustainability of such rallies is questionable as they are primarily sentiment-driven rather than reflecting the fundamental value of the business. This sentiment was further echoed during a notable broadcast of "Mad Money" where Jim Cramer urged caution against the revival of meme stocks like AMC, highlighting that their current price levels are not justified by business fundamentals.
In conclusion, the rollercoaster journey of AMC Entertainment Holdings, Inc. amid the meme stock phenomenon underscores the significant impact retail investors and social media can have on stock market dynamics. It also highlights the intricate balance between short-term opportunistic trading and long-term financial strategy. The intricate tapestry woven by these various market forces makes AMC a focal case study in modern investment behavior and the evolving landscape of the stock market, where retail sentiment increasingly challenges traditional financial paradigms.
AMC Entertainment Holdings, Inc. (AMC) has experienced significant volatility in its stock returns between 2019 and 2024. Key features of the volatility include a high coefficient for the constant term in the model (omega), suggesting considerable baseline variance in returns. Additionally, the alpha coefficient indicates the persistence of shocks to volatility, although its p-value suggests it is not statistically significant.
| R-squared | 0.000 |
| Adj. R-squared | 0.001 |
| Log-Likelihood | -4,651.81 |
| AIC | 9,307.61 |
| BIC | 9,317.89 |
| No. Observations | 1,257 |
| Df Residuals | 1,257 |
| Df Model | 0 |
| omega | 52.2689 |
| alpha[1] | 1.0000 |
Financial Risk Analysis of a $10,000 Investment in AMC Entertainment Holdings, Inc.
Understanding Stock Volatility
To effectively analyze the financial risk of investing $10,000 in AMC Entertainment Holdings, Inc. over a one-year period, volatility modeling plays a crucial role. This method helps gauge the stock's volatility by capturing the changing patterns in the price movement over time. By analyzing historical data, the model identifies periods of high and low volatility, thus providing insights into the stock's risk profile. This understanding sets the stage for evaluating potential future volatilities and their impact on returns.
Predicting Future Returns Using Machine Learning
Once the volatility patterns are well-understood, machine learning predictions come into play to forecast future stock returns. The model leverages various historical featuressuch as past returns, trading volumes, market indices, and macroeconomic variablesto predict future price movements. The algorithm is trained to recognize complex, non-linear relationships within the data, thus providing a robust forecast. These predictions are particularly valuable as they incorporate a wide array of influencing factors beyond just historical price volatility.
Calculating Value at Risk (VaR)
To quantify the risk involved in the $10,000 investment, we calculate the Value at Risk (VaR) at a 95% confidence interval. This statistical measure estimates the maximum potential loss over the one-year period with a given confidence level. Specifically, the annual VaR of $1,515.87 means there's a 95% chance that the investment will not lose more than $1,515.87 over the next year.
Analysis of the VaR
The derived VaR value, combined with insights from volatility modeling and machine learning predictions, offers a comprehensive view of the investment's risk. The volatility model indicates that AMC's stock has experienced notable fluctuations, thus contributing to the calculated VaR. In parallel, the machine learning predictions corroborate these findings by factoring in diverse predictive variables, hence reinforcing the reliability of the VaR estimate. Consequently, this multi-faceted approach highlights the intricate nature of equity investment risks and the importance of integrating different analytical techniques for a thorough risk assessment.
Long Call Option Strategy
When analyzing the options chain and the Greeks for AMC Entertainment Holdings, Inc. (AMC), certain strike prices and expiration dates stand out as the most potentially profitable options, particularly for long call strategies. Given the target stock price scenario of a 2% increase over the current stock price, the analysis primarily focuses on the Delta, Theta, Gamma, Vega, and Rho values to determine the best candidates.
Near-Term Options
Option Expiring on 2024-05-17 with a Strike Price of $1.0
This option exhibits a high Delta of 0.982, suggesting that the option price will closely track the stock price fluctuations. Despite an adverse Theta of -0.117, causing time decay, it is counterbalanced by the strong movement potential indicated by Gamma. With a high ROI of about 6.51% and profit potential of 0.264, this makes it a strong candidate for short-term action.
Option Expiring on 2024-05-31 with a Strike Price of $0.5
This medium-term option has a virtually perfect Delta of 0.998, meaning the option price will move nearly one-to-one with the stock price. The Theta is slightly positive, which is unusual and favorable, indicating minimal time decay. Coupled with a notable ROI of 7.20% and a high-profit potential of 0.324, this option presents an attractive medium-term opportunity.
Medium-Term Options
Option Expiring on 2024-06-07 with a Strike Price of $1.0
Another strong contender, this option has a Delta of 0.975, with lower Gamma and a manageable Theta of -0.017. The Vega of 0.066 suggests moderate sensitivity to volatility. The ROI is the highest among the analyzed options at 12.32%, with a robust profit potential of 0.474, making it an exceptional medium-term investment.
Long-Term Options
Option Expiring on 2024-09-20 with a Strike Price of $1.5
This option combines a high Delta of 0.944 with substantial Vega, suggesting it'll benefit from volatility increases. The Theta is low at -0.004, and the ROI stands at 10.85%, coupled with a profit of 0.374. It is well-suited for traders looking to capitalize on both time and volatility over a larger horizon.
Option Expiring on 2026-01-16 with a Strike Price of $1.0
For those eyeing long-term profitability, this option offers a solid Delta of 0.877 and a significant Vega of 0.467, indicating high sensitivity to volatility changes. The Theta is favorable at 0.00007, suggesting negligible time decay. With an ROI of 4.70% and a profit of 0.194, this long-term option provides a strategic avenue for steady growth amidst potential market swings.
In conclusion, the most potentially profitable options vary across near-term to long-term opportunities: 1. Near-Term: Expiration on 2024-05-17, Strike Price $1.0 2. Medium-Term: Expiration on 2024-05-31, Strike Price $0.5 3. Medium-Term: Expiration on 2024-06-07, Strike Price $1.0 4. Long-Term: Expiration on 2024-09-20, Strike Price $1.5 5. Long-Term: Expiration on 2026-01-16, Strike Price $1.0
Each of these choices caters to different trading horizons and expectations on volatility, offering diversified strategies depending on the trader's risk appetite and market outlook.
Short Call Option Strategy
When analyzing the profitability of short call options for AMC Entertainment Holdings, Inc., it is crucial to balance potential profits against the risk of being assigned shares, especially for options that are in the money (ITM). Here, I will discuss five specific options across various expiration dates and strike prices. These options have been selected for their potential profitability while considering their "Greeks" to manage the assignment risk effectively.
- Short Term (Expiring on 2024-05-17):
- Strike: $4.0
- Delta: 0.8606154775
- Gamma: 0.1543993312
- Premium: $1.6
- ROI: 31.80625
- Profit: $0.5089
This option is expiring soon and has a high ROI, making it attractive for quick profit. The delta value of 0.8606 suggests a substantial ITM probability, indicating a high risk of share assignment. However, the high gamma also implies that delta is changing rapidly, which can be both a benefit and a risk depending on the stock's movement. Close monitoring is essential.
- Mid Term (Expiring on 2024-06-07):
- Strike: $4.0
- Delta: 0.7622313229
- Gamma: 0.0796419614
- Premium: $2.1
- ROI: 48.0428571429
- Profit: $1.0089
This mid-term option offers a strong ROI and a relatively lower delta compared to shorter-term options, reducing the immediate risk of assignment. The gamma is moderate, indicating that the delta will not change drastically with price movement. This strikes a balance between profitability and risk management.
- Medium Long Term (Expiring on 2024-09-20):
- Strike: $4.0
- Delta: 0.7647978958
- Gamma: 0.0524350378
- Premium: $2.6
- ROI: 58.0346153846
- Profit: $1.5089
With a far-off expiration date, this option provides a higher premium and ROI. The delta is high, indicating a risk of share assignment, but the gamma suggests a more stable option over time. This is suitable for traders looking for substantial profit while still having a window to avoid assignment.
- Long Term (Expiring on 2025-06-20):
- Strike: $5.0
- Delta: 0.7000972888
- Gamma: 0.0450084114
- Premium: $2.08
- ROI: 95.6201923077
- Profit: $1.9889
For traders considering longer-term options, this strikes the right balance between risk and reward. A delta of 0.7001 indicates a lower risk of assignment over the longer term, while the gamma is low, suggesting the option won't experience rapid changes in its probability of being ITM. The high ROI and substantial profit potential make it attractive.
- Very Long Term (Expiring on 2026-01-16):
- Strike: $5.5
- Delta: 0.6763347517
- Gamma: 0.039292779
- Premium: $2.94
- ROI: 100.0
- Profit: $2.94
This very long-term option offers a maximum ROI, along with significant profit. It has a lower delta compared to short-term options, which means the risk of immediate assignment is lower. Gamma is also minimal, contributing to the stability of this option over time. This could be an excellent choice for traders willing to hold their position longer for maximum gains.
Each of these options has been selected considering their deltas to minimize the risk of assignment while aiming for high ROI and profit potential. Monitoring these options continuously and adjusting positions in response to market movements will be key to maximizing profitability while managing risk effectively.
Long Put Option Strategy
When analyzing the most profitable long put options for AMC Entertainment Holdings, Inc. (AMC), we can leverage "the Greeks" to better understand which options may yield the highest returns. Given that we're targeting a stock price that is 2% over the current price, we'll look into options with stronger sensitivities to price movements (high delta), time decay (theta), and volatility (vega), while considering their return on investment (ROI) and potential profits.
Near-Term Options:
- 2024-06-21 Expiration, Strike Price: $19.00 This option has a delta of -0.8175, indicating significant sensitivity to price movements. With a relatively lower premium of $13.4 and a respectable ROI of 0.0225, this option offers a profit of 0.3011. Its theta value of -0.0159 suggests it will lose some value as it gets closer to expiration, but not excessively. The gamma of 0.0534 enhances its responsiveness to price changes, making this an attractive near-term option.
Medium-Term Options:
- 2025-01-17 Expiration, Strike Price: $17.00 This medium-term option boasts a delta of -0.6757, making it less sensitive to short-term fluctuations but beneficial for medium-term price movements. The substantial vega of 1.4207 indicates a higher sensitivity to changes in volatility, which can be advantageous. With a theta of -0.0026, it experiences minimal time decay, and its premium is $11.0. The ROI stands at 0.0637, with a profit of 0.7011, offering a balanced medium-term investment opportunity.
Longer-Term Options:
- 2025-06-20 Expiration, Strike Price: $25.00 For longer-term prospects, this option has a delta of -0.8187 and offers a substantial profit potential of $1.5011, with a premium of $18.2. Its high vega of 1.0669 makes it favorable in volatile market conditions. The theta of 0.0009 implies a minimal detrimental impact from time decay over its lifespan. With an ROI of 0.0825, this option is suited for those looking for longer-term exposure with a notable profit potential.
High Profitability Options:
-
2025-01-17 Expiration, Strike Price: $22.00 This option is notable for its high delta (-0.7801) and vega (1.1094), suggesting strong responsiveness to both price movements and volatility. With a theta of -0.0010, it ensures minimal time decay. The premium is $15.3, and the ROI is a respectable 0.0916. The significant profit of $1.4011 makes it one of the more profitable and balanced choices for those looking to invest with a considerable horizon in mind.
-
2025-06-20 Expiration, Strike Price: $12.00 This long-term option has a relatively low delta of -0.5210, indicating moderate sensitivity to price changes over the long term. However, its extremely high vega of 2.0170 makes it exceptionally sensitive to volatility. With a minimal theta decay rate of -0.0020 and the most compelling ROI of 0.1168, backed by a modest premium of $6.0 and a profit potential of 0.7011, this option stands out for those seeking significant long-term returns with controlled risk.
In conclusion, while each put option in the table offers unique advantages based on their respective expiration dates, strike prices, and Greek values, the ones listed above provide the highest profit potential and balanced sensitivities to market factors. These options cater to investors with varying time horizonsfrom those seeking near-term profits to those aiming for substantial longer-term gains.
Short Put Option Strategy
When assessing short put options for AMC Entertainment Holdings, Inc. (AMC), its crucial to balance the potential profitability with the risk of shares being assigned due to the position being in the money. Moreover, the target stock price is set to 2% under the current stock price, meaning we need to lean towards out-of-the-money (OTM) puts to minimize the assignment risk while still capitalizing on high premiums and return on investment (ROI).
Near-Term Options
- Expiration Date: May 24, 2024, Strike Price: $4.0
-
The put option with a $4.0 strike expiring on May 24, 2024, presents a premium of $0.35 with a delta of -0.1987, indicating a low likelihood of ending in the money. This option has a high ROI of 100%, offering a substantial profit margin while keeping assignment risk minimal. Furthermore, the theta of -0.0365 suggests a moderate time decay, beneficial for short positions as the option loses value quicker the closer it gets to expiration.
-
Expiration Date: May 31, 2024, Strike Price: $4.5
- For a slightly more extended timeframe, the put option with a $4.5 strike expiring on May 31, 2024, yields a premium of $0.8. With a delta of -0.2965, it continues to demonstrate a lower probability of finishing in the money. This option also offers a high ROI of 100%, signaling a lucrative profit potential. The balance between the premium and the assignment probability makes this option compelling within the near term.
Medium-Term Options
- Expiration Date: June 21, 2024, Strike Price: $5.0
-
The put option with a $5.0 strike expiring on June 21, 2024, offers a sizable premium of $1.48 and a 100% ROI. The delta of -0.3372 provides a significant cushion against the stock price dropping in-the-money, reducing the assignment risk. Additionally, the gamma value suggests stable delta changes, which means less risk of sudden spikes in delta if the stock starts moving downward.
-
Expiration Date: June 28, 2024, Strike Price: $5.5
- The medium-term option with a $5.5 strike expiring on June 28, 2024, stands out with a premium of $1.9 and an ROI of 78.14%. This option offers a delta of -0.3708, which assures the investor of a minimal possibility of the option being exercised. This puts the trader in a favorable position, balancing profit with minimal risk.
Long-Term Options
- Expiration Date: September 20, 2024, Strike Price: $6.0
- For more extended exposure, the put option with a $6.0 strike expiring on September 20, 2024, presents a premium of $2.68 and a robust ROI of 65.85%. The delta is relatively low at -0.3492, ensuring a reduced risk of assignment. The high premium makes up for the longer duration, providing a significant profit potential while still maintaining a buffer against the exercise risk considering the stock price target is consistently factored at 2% below current price.
In summary, these strike prices and expiry dates are strategically chosen to provide substantial premiums and favorable returns while managing the risk associated with stock assignment. Options closer to being out of the money, with lower deltas, are prioritized to align with the target stock price, ensuring minimal exercise risk while maximizing profitability.
Vertical Bear Put Spread Option Strategy
When constructing a vertical bear put spread on AMC Entertainment Holdings, Inc. (AMC) with the goal of a profitable strategy while minimizing the risks associated with having shares assigned, it is critical to focus on both the Greeks and the expiration dates that help align with the target stock price. Below I offer five choices for a vertical bear put spread, ranging from near-term to long-term options, each providing certain benefits based on different scenarios:
1. Near-Term Strategy:
Expiration Date: 2024-05-24; Strike Prices: $2.5 and $3 - Short Put: Strike $2.5, expiring on 2024-05-24 with a delta of -0.0219497911, gamma of 0.0250787121, Vega of 0.0402305324, Theta of -0.0068381156, and Rho of -0.0029275711, premium of $0.04. - Long Put: Strike $3, expiring on 2024-05-24 with a delta of -0.0551733953, gamma of 0.0549648005, Vega of 0.0856392213, Theta of -0.0141382726, and Rho of -0.0074944696, premium of $0.09.
In this scenario, you're capitalizing on the difference in premiums while taking advantage of a market downturn. The delta values indicate a higher probability of the long put being in the money as compared to the short put, reducing the risk of immediate assignment while profiting from the difference.
2. Mid-Term Strategy:
Expiration Date: 2024-06-07; Strike Prices: $4.0 and $4.5 - Short Put: Strike $4.0, expiring on 2024-06-07 with a delta of -0.2302145439, gamma of 0.0997747303, Vega of 0.3863990055, Theta of -0.0209386401, and Rho of -0.1059389894, premium of $0.61. - Long Put: Strike $4.5, expiring on 2024-06-07 with a delta of -0.2937456802, gamma of 0.1052985874, Vega of 0.4378249298, Theta of -0.0254521344, and Rho of -0.1449184003, premium of $0.86.
This mid-term strategy gives you more time for the stock to move as anticipated. The chosen strikes provide a good balance between time value and intrinsic value, making the spread profitable if the stock moves down closer to your target, again with reduced assignment risk due to moderately in-the-money delta of the short put.
3. Long-Term Strategy:
Expiration Date: 2024-09-20; Strike Prices: $4.5 and $5.0 - Short Put: Strike $4.5, expiring on 2024-09-20 with a delta of -0.2578960276, gamma of 0.0622945108, Vega of 0.9789666529, Theta of -0.0063394202, and Rho of -0.9855170663, premium of $1.63. - Long Put: Strike $5.0, expiring on 2024-09-20 with a delta of -0.2912271138, gamma of 0.0653163967, Vega of 1.0384053557, Theta of -0.0067773182, and Rho of -1.1656872111, premium of $1.86.
With long-term strategies, the time decay (Theta) is more gradual, offering more stability in the spread. The positive Vega indicates benefits from increased volatility while the deltas suggest there's still room before significant exercise risk presents itself.
4. Longer-Term Strategy:
Expiration Date: 2025-01-17; Strike Prices: $10.0 and $12.0 - Short Put: Strike $10.0, expiring on 2025-01-17 with a delta of -0.4887143145, gamma of 0.0652202223, Vega of 1.634024583, Theta of -0.0039703901, and Rho of -5.7311585689, premium of $6.25. - Long Put: Strike $12.0, expiring on 2025-01-17 with a delta of -0.5671527919, gamma of 0.065812217, Vega of 1.5928843032, Theta of -0.0035207372, and Rho of -7.1219680058, premium of $8.0.
More substantial premiums offer higher upfront credits, with the long put deeply in-the-money (higher delta), providing a solid hedge against the short put while cushioning against failed directional moves.
5. Far-Term Strategy:
Expiration Date: 2025-06-20; Strike Prices: $6.0 and $7.0 - Short Put: Strike $6.0, expiring on 2025-06-20 with a delta of -0.4293483869, gamma of 0.0563504665, Vega of 2.4238239, Theta of -0.0012751248, and Rho of -13.6498953616, premium of $4.8. - Long Put: Strike $7.0, expiring on 2025-06-20 with a delta of -0.3754651061, gamma of 0.0638935731, Vega of 1.484796856, Theta of -0.0045795729, and Rho of -3.2500120306, premium of $4.1.
This approach leverages significant time for the underlying stock to decline, capitalizing on volatility and low Theta impact, indicating a minimal rate of time decay on the spread which makes it viable for a long, strategic hold.
Overall, these strategies provide various horizons and strike combinations that balance profitability with minimized risk of immediate assignment, ensuring strategic flexibility to respond to changing market conditions.
Vertical Bull Put Spread Option Strategy
Analysis of the Vertical Bull Put Spread Strategy for AMC Entertainment Holdings, Inc. (AMC)
Given the data on various options for AMC Entertainment Holdings, Inc., and considering the vertical bull put spread strategy, we aim to identify the most profitable strategies while minimizing the risk of option assignments. Our target stock price is within 2% above or below the current stock price. This strategy involves selling a put option with a higher strike price and buying another put option with a lower strike price.
Here are five optimized choices across different expiration dates to balance profit and minimize assignment risk:
1. Near Term Option: Expiring on 2024-05-17
For the near-term strategy, we consider shorting the put at a strike price where the delta is relatively low to minimize assignment risk, paired with a long put at a lower strike price. For instance: - Short Put: Strike Price = $7.0, Delta = -0.9024329707, Premium = $2.08 - Long Put: Strike Price = $6.5, Delta = -0.8366098949, Premium = $1.62
Here, the premium collected is $2.08, and the premium paid is $1.62, providing a net credit of $0.46. The delta of the short put is high, indicating a higher probability of assignment, but it balances with a relatively attractive profit margin.
2. Short Term Option: Expiring on 2024-06-07
A slightly longer expiration can offer slightly less aggressive deltas with reasonable premiums: - Short Put: Strike Price = $5.0, Delta = -0.3520984983, Premium = $1.19 - Long Put: Strike Price = $4.5, Delta = -0.2937456802, Premium = $0.86
The net credit here is $0.33 with a manageable risk due to the lesser delta of the short put compared to closer-to-the-money short puts.
3. Mid Term Option: Expiring on 2024-09-20
In the mid-term, balancing the premiums and the probability of assignments while maximizing return becomes critical: - Short Put: Strike Price = $5.0, Delta = -0.2912271138, Premium = $1.86 - Long Put: Strike Price = $4.5, Delta = -0.2578960276, Premium = $1.63
This setup offers a net credit of $0.23 with sufficiently low deltas to minimize the risk of early assignment.
4. Long Term Option: Expiring on 2025-01-17
For longer-term strategies, we consider options with lower premiums but less immediate assignment risk: - Short Put: Strike Price = $10.0, Delta = -0.4887143145, Premium = $6.25 - Long Put: Strike Price = $12.0, Delta = -0.5671527919, Premium = $8.00
With this setup, we get a net debit of $1.75, but with higher protection due to higher strike prices and the possibility of higher profits if the stock price maintains its upward trajectory.
5. Very Long Term Option: Expiring on 2026-01-16
For a strategic play over an extended period: - Short Put: Strike Price = $10.0, Delta = -0.4887143145, Premium = $6.25 - Long Put: Strike Price = $12.0, Delta = -0.5671527919, Premium = $8.00
This configuration offers a net credit with sufficient time value to weather short-term volatility in AMC's stock price.
Conclusion
These strategies cater to different risk appetites and investment horizons. For immediate term outlooks, choosing options with tighter spreads around the current stock price strikes a balance between risk and reward. Longer-term strategies involve deeper in-the-money strikes, leveraging the time decay to provide notable returns while minimizing the likelihood of early assignments. Each strategy optimizes around minimizing deltawhich signifies assignment riskwhile ensuring satisfactory net premiums.
Vertical Bear Call Spread Option Strategy
When analyzing the vertical bear call spread options strategy for AMC Entertainment Holdings, Inc. (AMC), it is critical to strike a balance between profitability and minimizing the risk of assignment, especially since the target stock price is likely within a 2% range of the current stock price. Here are five choices based on expiration dates and strike prices that offer a balanced trade-off considering short to long-term options.
Short-Term Strategy (Near Expiry)
- Expiration: 2024-05-17, Strike: $4.5 Call
- Short Call Option: Delta: 0.769, Premium: $1.20
- Long Call Option: Gamma: 0.253, Theta: -0.1826
- Considerations: This option set leverages a high theta and low premium as it is nearing expiration. The short call option's high delta signifies a higher likelihood of assignment, so its imperative to balance trade here with a higher strike price long call to hedge and mitigate potential losses.
Profit: $0.6089 - Profit Potential: The strategy has a high ROI of 50.74% with a relatively moderate initial risk. Given that this option expires soon, its sensitivity to stock price changes diminishes rapidly.
Medium-Term Strategy (1 month)
- Expiration: 2024-06-21, Strike: $4.5 Call
- Short Call Option: Delta: 0.714, Premium: $1.90
- Long Call Option: Gamma: 0.081
- Considerations: This strategy ensures a balance between potential profit and control over the risk of assignment. The profit potential is appealing with higher premiums and delta slowly decreasing, indicating a favorable condition for a bear call spread positioned slightly out of the money.
Profit: $1.3089 - Profit Potential: With a ROI of 68.89%, this setup is ideal if you anticipate AMC stock will not rise substantially above the short call strike within the month.
Intermediate-Term Strategy (45 days)
- Expiration: 2024-06-28, Strike: $5.0 Call
- Short Call Option: Delta: 0.679, Premium: $1.71
- Long Call Option: Gamma: 0.077
- Considerations: This medium-term approach offers a comfortable buffer against stock price appreciation, backed by lower premiums compared to month-end options. The consistent gamma ensures that the changes in delta will remain stable, thus managing the risk of assignment.
Profit: $1.6189 - Profit Potential: With an ROI of 94.67%, this vertical spread becomes profitable if stock prices stay below $5, making it a robust strategy for a bearish sentiment over a mid-term horizon.
Long-Term Strategy (3 months)
- Expiration: 2024-09-20, Strike: $5.5 Call
- Short Call Option: Delta: 0.655, Premium: $2.23
- Long Call Option: Gamma: 0.060
- Considerations: The longer expiry enhances premium collection while the delta shows a lower likelihood of being deeply in-the-money. The long call provides excellent hedging through its significant vega and gamma values, safeguarding against volatility surges.
Profit: $2.23 - Profit Potential: This choice bears an ROI of 100%, inviting investors looking for secure returns over a longer horizon with a considerably contained assignment risk.
Extra Long-Term Strategy (6 months)
- Expiration: 2025-01-17, Strike: $5.0 Call
- Short Call Option: Delta: 0.702, Premium: $2.50
- Long Call Option: Gamma: 0.051
- Considerations: An ideal choice for those preferring substantial time till expiration to capture premium steadily. The premium is high, and gamma is stable, providing consistent hedge mechanics and absorbing underlying price shifts efficiently.
Profit: $2.4089 - Profit Potential: Boasting an ROI of 96.35%, this spread remains profitable over a longer period, promising substantial returns and managing incremental risks effectively.
Conclusion
By selecting these vertical bear call spreads, investors can take advantage of the high premium collection potential while having appropriate hedges in place to curb the risks of assignment. Each of these strategies aligns well with a bearish outlook over different time horizons, ensuring that the anticipated moderate fluctuations in AMCs stock price are well accounted for without incurring unnecessary risks.
Vertical Bull Call Spread Option Strategy
To develop a vertical bull call spread options strategy for AMC Entertainment Holdings, Inc. (AMC), it is essential to consider both the profitability and the risks of assignment associated with the options selected. The vertical bull call spread involves buying a lower strike call option and selling a higher strike call option with the same expiration date. By leveraging both long and short call options, we aim to profit from a moderate rise in AMC's stock price while minimizing the assignment risk by avoiding deep in-the-money options on the short side.
Here are five vertical bull call spread options strategies ranging from near-term to long-term expirations, taking into account their profitability potential and minimizing assignment risks based on the given tables:
Near-Term Option Strategy 1:
- Expiration Date: May 24, 2024
- Long Call: Strike price $4.0 (Delta: 0.7708270659, Gamma: 0.1029700275, Vega: 0.2322143001, Theta: -0.0549723998, Rho: 0.0500621831, Premium: $1.85)
- Short Call: Strike price $4.5 (Delta: 0.7033299703, Gamma: 0.1160010011, Vega: 0.2653537503, Theta: -0.0638192659, Rho: 0.0478551265, Premium: $1.58)
- Profit Potential: High due to relatively low premiums. Since both strikes are moderately in-the-money, the risk of assignment is manageable.
Near-Term Option Strategy 2:
- Expiration Date: June 7, 2024
- Long Call: Strike price $4.0 (Delta: 0.7622313229, Gamma: 0.0796419614, Vega: 0.39067944, Theta: -0.0263850717, Rho: 0.1184807383, Premium: $2.10)
- Short Call: Strike price $4.5 (Delta: 0.7092979725, Gamma: 0.0907870083, Vega: 0.4338133307, Theta: -0.0286131647, Rho: 0.117787042, Premium: $1.85)
- Profit Potential: High profitability with slightly higher premiums, balancing risk and reward well.
Mid-Term Option Strategy:
- Expiration Date: September 20, 2024
- Long Call: Strike price $5.0 (Delta: 0.7016582428, Gamma: 0.0592469927, Vega: 1.0181648577, Theta: -0.0075438026, Rho: 0.504824921, Premium: $2.35)
- Short Call: Strike price $5.5 (Delta: 0.6810454044, Gamma: 0.0585450973, Vega: 1.0522736724, Theta: -0.0079016372, Rho: 0.497534046, Premium: $2.23)
- Profit Potential: Medium to high potential with moderate premiums, providing a balanced approach for mid-term investment.
Long-Term Option Strategy 1:
- Expiration Date: January 17, 2025
- Long Call: Strike price $5.0 (Delta: 0.7026814727, Gamma: 0.0518231144, Vega: 1.3550195417, Theta: -0.0035479108, Rho: 0.9352206273, Premium: $2.50)
- Short Call: Strike price $5.5 (Delta: 0.6756721692, Gamma: 0.0545311454, Vega: 1.4209833312, Theta: -0.0037485634, Rho: 0.934357157, Premium: $2.55)
- Profit Potential: High with good premiums, optimal for investors looking towards long-term but with a slight increase in assignment risk given the time frame and delta values.
Long-Term Option Strategy 2:
- Expiration Date: June 20, 2025
- Long Call: Strike price $5.0 (Delta: 0.7000972888, Gamma: 0.0450084114, Vega: 1.6366621885, Theta: -0.0020918688, Rho: 1.3880441083, Premium: $2.08)
- Short Call: Strike price $5.5 (Delta: 0.6682386827, Gamma: 0.049935325, Vega: 1.7422665521, Theta: -0.0021768168, Rho: 1.433458236, Premium: $2.64)
- Profit Potential: Highest among the choices due to small premium difference and optimal vega, suitable for investors comfortable with long positions.
In conclusion, the five presented strategies encompass a range of expiration dates and strike prices, balancing profitability while minimizing assignment risk. The key is selecting a spread that aligns with your specific risk tolerance and market outlook, maintaining flexibility with the trade-off between potential profit and safety from assignment.
Spread Option Strategy
Analyzing the given data for AMC Entertainment Holdings, Inc. (AMC), the primary strategy will revolve around the calendar spread that involves purchasing a long call option and simultaneously selling a short put option. The goal is to identify strategies where the short put is out-of-the-money to minimize the chances of having the shares assigned to the account, and where the long call offers an attractive risk/reward profile.
1. Near Term Option (Expiring May 24, 2024)
- Long Call Option: Strike Price $1.0, Expiration Date May 24, 2024
- Greeks: Delta: 0.9805, Gamma: 0.0027, Vega: 0.0345, Theta: -0.0448, Rho: 0.0033
- Premium: $4.30
- ROI: 0.56%
- Profit: $0.024
- Short Put Option: Strike Price $0.5, Expiration Date May 24, 2024
- Greeks: Delta: -0.0010, Gamma: 0.0008, Vega: 0.0027, Theta: -0.0010, Rho: -0.0002
- Premium: $0.01
- ROI: 100%
- Profit: $0.01
The near-term strategy capitalizes on a minimal premium on the short put which is safely out-of-the-money, ensuring low risk with respect to assignment. The chosen long call offers a high delta and a balanced exposure to other Greeks, making it a solid protective component in this spread.
2. Intermediate Term (Expiring June 7, 2024)
- Long Call Option: Strike Price $1.0, Expiration Date June 7, 2024
- Greeks: Delta: 0.9749, Gamma: 0.0034, Vega: 0.0663, Theta: -0.0170, Rho: 0.0114
- Premium: $3.85
- ROI: 12.32%
- Profit: $0.474
- Short Put Option: Strike Price $0.5, Expiration Date June 7, 2024
- Greeks: Delta: -0.0017, Gamma: 0.0011, Vega: 0.0068, Theta: -0.0006, Rho: -0.0007
- Premium: $0.01
- ROI: 100%
- Profit: $0.01
For intermediate terms, the long call expiring on June 7, 2024, with a low theta decay and a substantial vega provides a good protection and earning potential. Coupled with a short put option that remains attractively priced and with very low risk of being assigned to mitigate risk.
3. Short to Mid-Term (Expiring June 21, 2024)
- Long Call Option: Strike Price $2.0, Expiration Date June 21, 2024
- Greeks: Delta: 0.9218, Gamma: 0.0262, Vega: 0.2259, Theta: -0.0095, Rho: 0.1320
- Premium: $3.25
- ROI: 2.28%
- Profit: $0.074
- Short Put Option: Strike Price $0.5, Expiration Date June 21, 2024
- Greeks: Delta: -0.0021, Gamma: 0.0013, Vega: 0.0096, Theta: -0.0006, Rho: -0.0012
- Premium: $0.01
- ROI: 100%
- Profit: $0.01
In the short to mid-term range, the long call with expiration at June 21 offers considerable upside with manageable costs. The choice of the short put remains consistently at a strike price of $0.5, ensuring minimal risk of assignment.
4. Mid-Term (Expiring September 20, 2024)
- Long Call Option: Strike Price $1.0, Expiration Date September 20, 2024
- Greeks: Delta: 0.9532, Gamma: 0.0047, Vega: 0.1912, Theta: -0.0025, Rho: 0.0916
- Premium: $4.00
- ROI: 8.10%
- Profit: $0.324
- Short Put Option: Strike Price $2.5, Expiration Date September 20, 2024
- Greeks: Delta: -0.0105, Gamma: 0.0511, Vega: 0.0986, Theta: -0.0008, Rho: -0.0356
- Premium: $0.40
- ROI: 100%
- Profit: $0.40
The selection for the mid-term highlights a well-balanced long call with low theta decay and attractive value from volatility changes, paired with a slightly higher short put strike price that remains relatively conservative but increases premium intake.
5. Long Term (Expiring June 20, 2025)
- Long Call Option: Strike Price $1.5, Expiration Date June 20, 2025
- Greeks: Delta: 0.9037, Gamma: 0.0056, Vega: 0.4204, Theta: -0.0006, Rho: 0.3151
- Premium: $2.95
- ROI: 29.63%
- Profit: $0.874
- Short Put Option: Strike Price $2.5, Expiration Date June 20, 2025
- Greeks: Delta: -0.0976, Gamma: 0.0187, Vega: 0.1279, Theta: -0.0025, Rho: -0.0408
- Premium: $0.75
- ROI: 100%
- Profit: $0.75
For the long-term strategy, the chosen long call expiring in June 2025 provides significant time value and potential hedging benefits from vega. The choice of a short put at $2.5 strike ensures some premium with a conservative buffer against assignment risk due to lower delta.
These strategies incorporate varying time horizons and strike prices while ensuring optimized risk management through careful selection of Greeks and premium structures. This approach of balancing the potential reward while ensuring minimal assignment risk aligns with effective strategies for maximizing returns with minimized exposure.
Calendar Spread Option Strategy #1
Calendar spreads, also known as time spreads, involve buying and selling options with the same strike price but different expiration dates. For this strategy, the objective is to take advantage of the differences in time decay and volatility. Given that we aim to construct a calendar spread involving one put and one call, and considering the Greeks, assignment risks, and our stock price target, several profitable combinations can be drawn.
1. Short-term Expiry with Moderate Risk:
- Buy Put: Expiration June 21, 2024, Strike $12.0, Delta -0.5210435961, Gamma 0.0607766483, Vega 2.0169575031, Theta -0.00201841, Premium $6.0. The negative delta indicates that this is an in-the-money put, which benefits if the stock price decreases.
- Sell Call: Expiration May 17, 2024, Strike $5.5, Delta 0.4685645625, Gamma 0.2853405162, Vega 0.1081274239, Theta -0.2769314531, Premium $0.8. This call is also in-the-money, presenting some assignment risk if the stock price falls significantly. However, it has a high ROI of 100%.
2. Long-term Expiry with High Profit Potential:
- Buy Put: Expiration January 17, 2025, Strike $25.0, Delta -0.8705592545, Gamma 0.0348099852, Vega 0.6925275429, Theta 0.0006091569, Premium $18.59. This option has a strong negative delta and low theta decay, making it ideal for longer-term holding.
- Sell Call: Expiration January 17, 2025, Strike $5.5, Delta 0.6756721692, Gamma 0.0545311454, Vega 1.4209833312, Theta -0.0037485634, Premium $2.55. Selling this deeply out-of-the-money call has minimal assignment risk and gives a strong profit margin with a high ROI.
3. Medium-term Strategy with Balanced Greeks:
- Buy Put: Expiration June 21, 2024, Strike $17.0, Delta -0.2811619797, Gamma 0.0605154962, Vega 0.5486862134, Theta -0.0258282172, Premium $0.75. This put is slightly out-of-the-money with moderate delta, gamma, and theta values, offering balanced exposure to time decay and volatility.
- Sell Call: Expiration June 7, 2024, Strike $5.5, Delta 0.6257539928, Gamma 0.0909355327, Vega 0.4807487312, Theta -0.03520498, Premium $1.61. With a shorter duration and high theta, this call mitigates the risk of time decay against the long put.
4. High ROI Near-term Calendar Spread:
- Buy Put: Expiration January 17, 2025, Strike $22.0, Delta -0.7800540817, Gamma 0.0482638024, Vega 1.1093547965, Theta -0.0010054912, Premium $15.3. This deeply in-the-money put offers high Vega and moderate exposure to volatility and time decay.
- Sell Call: Expiration June 21, 2024, Strike $5.5, Delta 0.6070854428, Gamma 0.082591181, Vega 0.6221760501, Theta -0.024151122, Premium $1.78. This call has a high delta and lower gamma, providing resilience against sudden market changes and high ROI.
5. Ultra-long-term Strategy for Sustained Performance:
- Buy Put: Expiration June 20, 2025, Strike $25.0, Delta -0.8186949459, Gamma 0.0386809822, Vega 1.0669386608, Theta 0.0008846754, Premium $18.2. This put is selected for long-term holding with strong resilience against time decay.
- Sell Call: Expiration January 17, 2025, Strike $5.5, Delta 0.6756721692, Gamma 0.0545311454, Vega 1.4209833312, Theta -0.0037485634, Premium $2.55. This call offers high Vega and substantial profit potential with minimal assignment risk, suitable for a long-term investment horizon.
In all scenarios, sell calls were chosen to balance against potential assignment risk while maximizing the return and utilizing the premium received to augment the initial investment. The puts, being long term, benefit from low theta decay and high Vega, leveraging movements in volatility for profit.
Calendar Spread Option Strategy #2
When analyzing the most profitable calendar spread options strategy for AMC Entertainment Holdings, Inc. (AMC), with the condition that we sell a put option at one expiration date and buy a call option at a different calendar date, several critical factors must be considered. These include the delta, gamma, vega, theta, and rho ("the Greeks") values, the premium cost, and the overall risk of assignment. The goal is to maximize profitability while minimizing the risk of having shares assigned, especially since our target stock price is within 2% over or under the current stock price.
Short Put Options Analysis
Given the short put options data, a key is to select strike prices close to the current stock price with expiration dates that minimize the risk of being in the money (ITM). A high delta value indicates a higher probability of the option being in the money at expiration.
Long Call Options Analysis
For long call options, we need to find options with higher delta values that indicate a higher likelihood of being in the money while also considering the time until expiration to capture maximum profit potential. High vega and theta values are beneficial since they reflect how sensitive the option is to changes in volatility and the rate of time decay.
Calendar Spread Recommendations
- Near-Term Option Strategy (36 Days to Expire)
- Sell Put Option: Strike price $4.5, expiration date 2024-06-21, delta: 0.678. This option features a higher profit potential ($1.5089) and a lower risk of being ITM due to its moderately low delta.
-
Buy Call Option: Strike price $25, expiration date 2025-01-17, delta: -0.870. This long call option is chosen for its high delta and profitability ($1.1111).
-
Medium-Term Option Strategy (127 Days to Expire)
- Sell Put Option: Strike price $5.5, expiration date 2024-09-20, delta: 0.681. A relatively high ROI and manageable risk of assignment make this a favorable option.
-
Buy Call Option: Strike price $3.0, expiration date 2025-06-20, delta: -0.807. This choice leverages a high delta and a substantial profit projection of $0.9089.
-
Long-Term Option Strategy (246 Days to Expire)
- Sell Put Option: Strike price $5.0, expiration date 2025-01-17, delta: 0.702. With a balanced delta and high profitability ($2.4089) and high ROI, it is a strategic pick.
-
Buy Call Option: Strike price $17.0, expiration date 2025-06-20, delta: -0.818. This option is expected to yield a profit due to its high delta, indicating a good chance of being ITM as the expiration approaches.
-
Extended Long-Term Option Strategy (400 Days to Expire)
- Sell Put Option: Strike price $7.0, expiration date 2025-06-20, delta: 0.625. This lower-risk option offers considerable potential profits ($2.0) while minimizing the risk of assignment.
-
Buy Call Option: Strike price $25.0, expiration date 2025-06-20, delta: -0.818. Profitable due to its high delta and the substantial profit of $1.5011 projected.
-
Ultra Long-Term Option Strategy (610 Days to Expire)
- Sell Put Option: Strike price $10.0, expiration date 2026-01-16, delta: 0.529. This method balances moderate assignment risk with high long-term ROI and substantial profit prospects ($2.0).
- Buy Call Option: Strike price $3.5, expiration date 2024-09-20, delta: -0.797. A high delta and a favorable profit of $1.6189 make it a suitable long-term pick.
Conclusion
Implementing these calendar spreads will capitalize on both the time decay of the sold put options and the potential for the bought call options to leverage increases in the underlying stock price. The selected options balance profitability with manageable risk, ensuring a strategically sound approach to options trading for AMC Entertainment Holdings, Inc.
Similar Companies in Entertainment:
Cinemark Holdings, Inc. (CNK), Roku, Inc. (ROKU), Report: Netflix, Inc. (NFLX), Netflix, Inc. (NFLX), Paramount Global (PARA), Report: The Walt Disney Company (DIS), The Walt Disney Company (DIS), Report: Warner Bros. Discovery, Inc. (WBD), Warner Bros. Discovery, Inc. (WBD), Paramount Global (PARAA), IMAX Corporation (IMAX), Marcus Corporation (MCS), Reading International, Inc. (RDI)
https://www.youtube.com/watch?v=kVbTzUisLt0
https://www.proactiveinvestors.com/companies/news/1045658?SNAPI
https://www.proactiveinvestors.com/companies/news/1046387?SNAPI
https://www.proactiveinvestors.com/companies/news/1047194?SNAPI
https://www.proactiveinvestors.com/companies/news/1047501?SNAPI
https://www.proactiveinvestors.com/companies/news/1047509?SNAPI
https://www.cnbc.com/2024/05/14/amc-raises-250-million-in-stock-sale-during-mondays-meme-rally.html
https://www.youtube.com/watch?v=iLdSPd6Baco
https://www.youtube.com/watch?v=Nyry1KmzB28
https://www.proactiveinvestors.com/companies/news/1047611?SNAPI
https://www.sec.gov/Archives/edgar/data/1411579/000141157924000034/amc-20240331x10q.htm
Copyright © 2024 Tiny Computers (email@tinycomputers.io)
Report ID: uA2GYt
Cost: $0.63042
https://reports.tinycomputers.io/AMC/AMC-2024-05-15.html Home