NetFlix Inc (ticker: NFLX)
2024-01-06
 Netflix, Inc. (ticker: NFLX) is a globally recognized streaming entertainment service offering a wide variety of award-winning TV shows, movies, anime, documentaries, and more. As of my knowledge cutoff date in 2023, subscribers can watch Netflix content anytime, anywhere, on nearly any internet-connected screen without the inconvenience of commercials or commitments. Founded on August 29, 1997, by Reed Hastings and Marc Randolph in Scotts Valley, California, Netflix initially operated as a DVD rental service by mail before transitioning to become the streaming giant it is known today. The company has continuously adapted its business model from adding streaming services in 2007 to introducing original content production in 2013, now recognized under the Netflix Original banner. This evolution has positioned Netflix as a key player in the content streaming and production industry, with the company leveraging its large subscriber base and data analytics to tailor its offerings. Its influence on the entertainment industry has been profound, disrupting traditional broadcasting and cable television, and it has prolifically invested in international content to capture and retain a global audience. Netflix's business strategy focuses heavily on the creation and distribution of original content, which has earned critical acclaim and enhanced subscriber loyalty. However, as competition within the streaming space intensifies, Netflix faces challenges maintaining its growth rate and subscriber base amidst increasing content costs and market saturation.
| Address | 121 Albright Way | City | Los Gatos | State | CA |
| ZIP Code | 95032 | Country | United States | Phone | 408 540 3700 |
| Website | https://www.netflix.com | Industry | Entertainment | Sector | Communication Services |
| Full Time Employees | 12,800 | Previous Close | 474.67 | Open | 476.5 |
| Day Low | 471.804 | Day High | 479.49 | Payout Ratio | 0.0 |
| Beta | 1.283 | Trailing PE | 47.406 | Forward PE | 29.815094 |
| Volume | 2,611,433 | Average Volume (10 days) | 2,924,520 | Market Cap | 207,486,582,784 |
| 52 Week Low | 285.33 | 52 Week High | 500.89 | Price to Sales (TTM) | 6.3369145 |
| 50 Day Average | 459.4628 | 200 Day Average | 407.70667 | Trailing Annual Dividend Rate | 0.0 |
| Trailing Annual Dividend Yield | 0.0 | Enterprise Value | 216,383,225,856 | Profit Margins | 0.13821 |
| Float Shares | 431,779,747 | Shares Outstanding | 437,680,000 | Shares Short | 9,654,446 |
| Held Percent Insiders | 1.363% | Held Percent Institutions | 83.508% | Short Ratio | 2.44 |
| Book Value | 50.511 | Price to Book | 9.3852825 | Earnings Quarterly Growth | 20.0% |
| Net Income to Common | 4,525,435,904 | Trailing EPS | 10.0 | Forward EPS | 15.9 |
| PEG Ratio | 1.6 | Last Split Factor | 7:1 | Last Split Date | 07/15/2015 |
| Enterprise To Revenue | 6.609 | Enterprise To EBITDA | 33.961 | 52 Week Change | 50.41406% |
| S&P 52 Week Change | 20.686829% | Current Price | 474.06 | Target High Price | 600.0 |
| Target Low Price | 335.0 | Target Mean Price | 472.22 | Target Median Price | 500.0 |
| Recommendation Mean | 2.2 | Number of Analyst Opinions | 37 | Total Cash | 7,867,445,760 |
| Total Cash Per Share | 17.975 | EBITDA | 6,371,565,056 | Total Debt | 16,764,248,064 |
| Quick Ratio | 1.08 | Current Ratio | 1.293 | Total Revenue | 32,742,524,928 |
| Debt to Equity | 75.83 | Revenue Per Share | 73.752 | Return on Assets | 7.737% |
| Return on Equity | 21.228% | Gross Profits | 12,447,265,000 | Free Cash Flow | 18,025,701,376 |
| Operating Cash Flow | 6,055,144,960 | Earnings Growth | 20.3% | Revenue Growth | 7.8% |
| Gross Margins | 39.491% | EBITDA Margins | 19.459999% | Operating Margins | 22.436% |
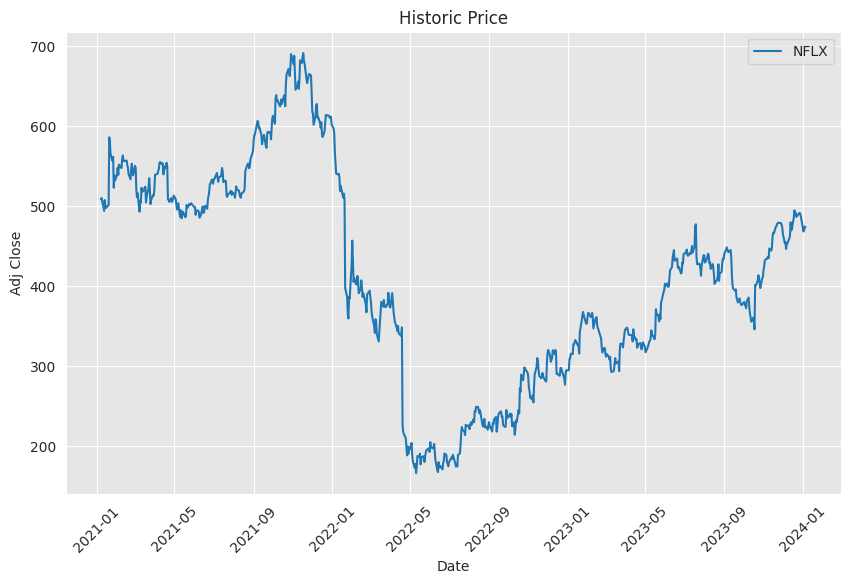 Based on the provided data, we have a comprehensive view of Netflix's recent technical performance, fundamental health, and balance sheet strength. Analyzing the overall trend in light of these factors will allow us to project potential price movements in the following months.
The Technical Indicators from the provided pandas_ta output suggest a few critical patterns to consider:
- The decreasing OBV (On-Balance Volume) indicates that selling pressure has been dominating, which could imply a bearish outlook if the trend persists.
- The MACD histogram values being negative suggest that the stock is currently experiencing a bearish momentum. The fact that the MACD histogram is descending further below the signal line could indicate that the bearish momentum is increasing.
From the Summary of Fundamentals, we note:
- A solid gross margin of approximately 39.5%, indicative of strong profitability relative to revenue.
- EBITDA and operating margins are positive, showing operational efficiency.
- A somewhat high trailing PEG ratio of 1.8996, which could suggest the stock's growth rate may not justify its current price-to-earnings ratio.
In examining the financials and balance sheet data:
- Year-over-year, there is a significant increase in net income, which shows improved profitability.
- A substantial level of debt is noted, with net debt standing at $9.2 billion. However, the company also has a considerable amount of cash and cash equivalents.
- Free Cash Flow is positive, which is an indicator of the company's ability to generate cash after accounting for capital expenditures.
- The repayment of debt in the cash flow statement is a positive sign, showing that the company is managing its debt levels.
Considering the blend of technical, fundamental, and financial balance sheet data, we continue with our analysis. The negative trajectory in OBV suggests investors are currently selling off their positions, possibly in response to achieving price levels viewed as overvalued, or perhaps due to market-wide sentiment shifts.
However, strong fundamentals with consistent revenue growth, solid margins, and a healthy net income suggest intrinsic value in the company's operations. The debt levels, although significant, are being actively managed, as evidenced by the positive free cash flow and debt repayments.
Projection:
- In the short term, technical indicators suggest that the bearish momentum could continue, potentially leading to lower stock prices.
- The strong fundamental base may limit the downside potential, with investors finding value at lower price levels due to the company's solid financial performance.
- If the market corrects its bearish outlook and focuses on the company's strong fundamentals, we might witness a consolidation phase before any new uptrend.
- Over the medium to longer term, provided the company maintains its earnings growth and continues effective debt management, a recovery of prices is plausible, leading to a bullish trend reversal.
Investors should therefore monitor both the market sentiment and the company's ongoing financial performance closely. Upcoming quarterly reports, management commentary, and market trends will be crucial in determining whether Netflix can harness its strong fundamental base to overcome the current technical downtrend.
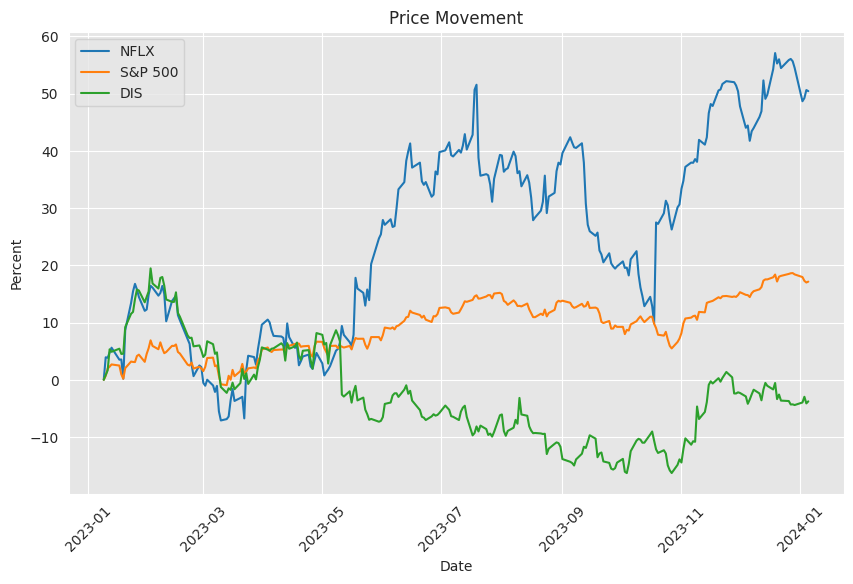
In the ordinary linear regression model analyzing the relationship between Netflix (NFLX) and the S&P 500 Index (SPY), the alpha value is approximately 0.0083. The alpha, or the intercept of the regression equation, represents the expected return of NFLX when the SPY has a zero return, theoretically capturing the performance of NFLX independent of the market. In this case, the positive alpha suggests that NFLX is expected to have a slight positive performance even if the market (SPY) shows no gains. However, the statistical significance of the alpha is questionable, as indicated by the high p-value of 0.907, which implies that the alpha is not significantly different from zero at conventional significance levels. This suggests that NFLX's performance is not reliably predicted to outperform the market when the latter has neutral performance.
The beta coefficient of the model is approximately 1.0554, indicating the relative volatility or systematic risk of NFLX in comparison to the SPY. A beta value greater than one suggests that NFLX is more volatile than the market. Therefore, for every percentage point change in the SPY, NFLX is expected to change by about 1.0554 percentage points in the same direction. The R-squared of the model is 0.231, which means that roughly 23.1% of the variability in NFLX's returns is explained by movements in the SPY. While this indicates some level of correlation between NFLX's performance and the market, a substantial portion of NFLX's return variability remains unexplained by the model, reflecting the influence of other factors specific to NFLX or its industry.
The third quarter (Q3) 10-Q SEC filing for Netflix Inc. (NFLX) for the period ended September 30, 2023, revealed several operational and financial highlights showcasing the company's performance. Netflix reported an 8% year-over-year increase in consolidated revenues, totaling $8.54 billion compared to $7.93 billion in the same quarter of the previous year. A significant portion of this revenue, $8.52 billion, came from streaming services, marking an increase of 8% from the prior year's $7.89 billion. The rise in streaming revenues was primarily driven by an 11% increase in global memberships, with 247 million paid subscriptions as of September 2023 compared to 223 million in the previous year.
Operating income for the quarter reached $1.92 billion, a 25% improvement from $1.53 billion for the same period last year. The operating margin expanded by three percentage points to 22%, largely due to revenues growing at a faster pace than cost of revenues alongside decreases in marketing and technology development expenses. Meanwhile, general and administrative expenses saw a 28% rise, mainly due to increased personnel-related costs and third-party expenses.
The company also highlighted a shift in focusing on content offerings, particularly original content, which affects liquidity due to more significant upfront cash requirements. Netflix's cash flow from operations soared by 255% to $5.61 billion for the nine-month period ending September 2023, with free cash flow amounting to $5.34 billion.
In terms of capital management, Netflix reported using its cash for various purposes including content acquisition and production, marketing, technology development, personnel costs, strategic investments and acquisitions. Additionally, during the third quarter of 2023, they repurchased almost 6 million shares for $2.5 billion. The company's outstanding debt as of the end of September 2023 was $14.3 billion, having paid down $52.7 million over the nine-month period.
The report also highlights future contractual obligations, such as $19.65 billion related to content obligations and $17.78 billion in debt obligations. Netflix's effective tax rate for the quarter was 12%, slightly lower than the previous year's 14%. The company maintains hedges to manage foreign currency risk and reported a $41 million foreign exchange loss due to the remeasurement of cash and content liability positions in non-functional currencies.
Overall, Netflix exhibits strong revenue growth, rising operating income, and significant generation of free cash flow, with global membership as a key driver of performance. However, there are also increased spending on general and administrative expenses and a substantial amount of content and debt obligations to meet. The document details the use of derivative financial instruments, tax issues, and the adoption of stock trading plans under Rule 10b5-1 for certain executive officers, including Co-Chief Executive Officers and the Chief Legal Officer.
Netflix Inc.'s role in the investment landscape, particularly within the realm of retirement planning, budgeting, and credit management strategies, serves as a compelling case study for individual investors seeking growth. As a pioneering entertainment company, Netflix's evolution from a DVD rental service to a leading streaming platform has drawn the attention of investors looking to capitalize on the company's growth trajectory. The company's ability to innovate and adapt has been a cornerstone of its success, making it a focal point for discussions on investment strategies that emphasize long-term potential over the traditionally safer, but often lower-yielding, bonds.
The investment strategies relevant to individual investors often include discussions on the allocation between equities and bonds for retirement planning. A stock like Netflix, known for its robust growth profile, might allure investors open to assuming more risk in anticipation of higher rewards. Such investors would have benefited historically from a market tendency that has seen equities outperform bond investments over extended time horizons. Netflix's strength as a high-growth stock might advocate for an equity-heavy investment approach, particularly suited for those with a long investment timeline and faith in the entertainment industry's expansion.
In the domain of personal financial management, the pending shutdown of the Mint budgeting app has prompted its users to explore alternatives. Those seeking similar functionality may gravitate towards Monarch, with its user-friendly transition for former Mint enthusiasts. On the other hand, Empower's retirement planning features address the intertwining of budgeting and retirement strategy. Personal finance applications like YNAB, with its robust user community, and Tiller, catering to spreadsheet enthusiasts, provide additional diversity for managing finances.
Credit management strategies are also crucial for investors, particularly regarding credit card consolidation. This approach simplifies finances but must be handled with care to avoid inadvertently damaging credit scores. Closing older accounts can shorten credit history, while losing significant credit limits may negatively affect credit utilization ratios. Strategies that focus on closing newer accounts with lower limits may help mitigate such impacts and ensure a healthier credit profile.
For Netflix, the investment discourse now includes discussions of various strategic partnerships and industry shifts. The company's recent content licensing deal with Disney, where Netflix has secured rights to stream a selection of popular shows, indicates a strategic acquisition that maintains its competitive stance in the sector. This collaboration recognizes that even within a competitive landscape, there's a place for deals amongst rivals that help solidify Netflix's stronghold in the streaming war.
Additionally, within the broad trends shaping various market sectors, one can note strategic maneuvers such as Occidental Petroleum's significant acquisition of CrownRock, indicating industry consolidation. Similarly, Alphabet's legal setback against Epic Games could reshape the mobile app marketplace dynamics. These developments underscore the interconnected nature of different sectors and their potential impact on streaming services such as Netflix.
Entering 2024, mutual funds have shown a strategic inclination towards technology stocks, with Microsoft and Broadcom being particular favorites. This pattern reflects confidence in the growth prospects of these companies and the technology sector at large. Investors in Netflix can take cues from these moves, realizing that institutional investors are doubling down on tech as a pivotal part of future-oriented portfolios.
The investment narrative around Netflix becomes more intriguing when juxtaposed against the performance of other entities in the tech and entertainment domains. Roku, for example, which has seen a surge in stock value, evokes comparison to Netflix's earlier growth phases. As the conversation around potential investments continues, the analysis of companies like Roku in relation to giants like Netflix helps in understanding market sentiments and identifying growth opportunities.
Describing investment approaches, it's also important to factor in broader market activities, such as the recent movements in Netflix's stock price. The company's stock performance, even in the face of market dips, suggests that it exhibits characteristics of a momentum stock. This aligns with the momentum investing strategy that capitalizes on trending market movements.
In a broader sense, Netflix's resilience and innovative nature make it a unique case for investors. From its strategic policy changes like the crackdown on password sharing to introducing cheaper, ad-supported subscription models, Netflix continues to find new ways to drive growth and profitability. These strategic moves aim to further penetrate global markets and reach new subscriber bases.
Reflecting upon the exceptional growth trajectory of Netflix since its initial public offering, one can't help but recognize the magnitude of wealth that has been created for early investors. With key future earnings projections and strategic market positioning in place, the company appears positioned for continued long-term capital appreciation even if replicating historic growth rates at the company's current size is less likely.
In light of the foregoing analysis, investors should monitor the evolution of the streaming landscape, regulatory changes, and technological advancements. The broader entertainment and technology sectors offer various opportunities, and a company-like Netflix, with its dynamic history and market influence, stands as a relevant component of the investment discussion for individuals focused on creating a strategic and prosperous financial future.
Similar Companies in Entertainment & Media:
Report: The Walt Disney Company (DIS), The Walt Disney Company (DIS), Warner Bros. Discovery, Inc. (WBD), Report: Amazon.com, Inc. (AMZN), Amazon.com, Inc. (AMZN), Report: Apple Inc. (AAPL), Apple Inc. (AAPL), Paramount Global (PARA), Roku, Inc. (ROKU), Report: Comcast Corporation (CMCSA), Comcast Corporation (CMCSA), Alphabet Inc. (GOOGL)
News Links:
https://www.fool.com/investing/2023/12/30/24-spectacular-stocks-to-buy-hand-over-fist-for-20/
https://www.fool.com/investing/2023/12/30/oil-gas-consolidation-netflix-disney-partnership-f/
https://finance.yahoo.com/m/54fce32c-86e2-3141-9edb-f101058ff0c5/top-funds-kick-off-2024-with.html
https://www.fool.com/retirement/2023/12/31/investing-for-retirement-finding-a-mint-replacemen/
https://finance.yahoo.com/news/why-market-dipped-netflix-nflx-224518836.html
https://www.fool.com/investing/2024/01/06/what-that-famous-quote-about-bulls-bears-and-pigs/
https://www.fool.com/investing/2023/12/31/is-it-too-late-to-buy-roku-stock/
https://www.fool.com/investing/2024/01/06/got-3000-these-stocks-could-double-your-money-by-2/
https://finance.yahoo.com/news/netflix-nflx-great-momentum-stock-170006197.html
https://www.fool.com/investing/2023/12/28/1-stock-split-stock-many-millionaires-make-more/
Copyright © 2024 Tiny Computers (email@tinycomputers.io)
Report ID: oCler1
https://reports.tinycomputers.io/NFLX/NFLX-2024-01-06.html Home