American Express Company (ticker: AXP)
2024-02-11
 American Express Company, known by its ticker symbol AXP, is a premier global services company that offers customers access to products, insights, and experiences that enrich lives and build business success. With its headquarters in New York City, the company has built a robust presence in the financial services sector, specializing in charge and credit card products, travel-related services, and network services. Established in 1850, American Express has evolved from a freight forwarding company to a broad-based provider of financial and travel services. It is recognized for its commitment to customer service and its high-spending cardmembers, which has allowed AXP to maintain a prominent position in the competitive financial services market. The company operates through a variety of segments, including U.S. Card Services, International Card Services, Global Commercial Services, and Global Merchant and Network Services, offering a diversified range of products to its personal, small business, and corporate customers worldwide. By focusing on premium card products and leveraging its extensive global network, American Express aims to maintain its status as a trusted partner for millions of customers globally.
| Address | 200 Vesey Street | City | New York | State | NY |
| Zip Code | 10285 | Country | United States | Phone | 212 640 2000 |
| Website | https://www.americanexpress.com | Industry | Credit Services | Sector | Financial Services |
| Full Time Employees | 74,600 | Market Cap | 153,615,810,560 | Volume | 4,785,063 |
| Total Cash | 46,105,001,984 | Total Debt | 60,795,998,208 | Total Revenue | 55,592,001,536 |
| Profit Margins | 15.06% | Current Price | 212.47 | Shares Outstanding | 723,000,000 |
| Last Fiscal Year End | 170,398,0800 | Net Income To Common | 8,252,000,256 | Total Revenue | 55,592,001,536 |
| Gross Margins | 55.04% | Operating Margins | 17.36% | Return On Assets | 3.42% |
| Return On Equity | 31.74% | Operating Cash Flow | 18,559,000,576 | Earnings Growth | 26.3% |
| Revenue Growth | 9.2% | Debt To Equity | 216.687 | Current Ratio | 1.433 |
 0.6678144647552506 | Sharpe Ratio | 10.644244682448917 | Sortino Ratio
0.13022225803208057 | Treynor Ratio | 0.9080806694661041 | Calmar Ratio
0.6678144647552506 | Sharpe Ratio | 10.644244682448917 | Sortino Ratio
0.13022225803208057 | Treynor Ratio | 0.9080806694661041 | Calmar Ratio
Analyzing the provided data for American Express (AXP), we draw upon a comprehensive review melding technical indicators, fundamentals, balance sheets, and specialized financial ratios. Our goal is to prognosticate the future movements of AXP's stock price over the coming months.
Technical Indicators Analysis: The journey of AXP's stock price, as illustrated by the technical indicators from the last trading session, foretells a trajectory of potential growth. The progression from an opening price of $152.369995 to a closing zenith of nearly $214.25 betokens a robust uptrend. Notably, the On-Balance Volume (OBV) metric escalated from 0.25863 million to 6.72462 million, signifying accruing investor volume supporting this uptrend. Furthermore, the Moving Average Convergence Divergence (MACD) histogram's pivot from undefined to 1.239061 suggests burgeoning bullish momentum as the trading period elapsed.
Fundamentals & Balance Sheet Insight: Delving into AXP's fundamentals reveals a solid financial bastion. The company's operating margins and gross margins stand at 0.17358 and 0.55044, respectively, painting a picture of effective management and considerable profitability. A trailblazing revenue growth of 9.2%, coupled with an ambitious earnings projection for the next year, buttresses the optimism surrounding AXP. Such fundamentals, when juxtaposed against a capable balance sheet boasting of tangible book value progression and astute capital management, anchor the thesis of sustained financial health.
Ratios & Analyst Expectations: The ensemble of Sharpe, Sortino, Treynor, and Calmar ratios elucidates a compelling narrative of risk-adjusted returns that favor investment in American Express. The Sortino ratio, standing at an impressive 10.644244682448917, underscores the minimal downside volatility against the backdrop of the expected returns. Concurrently, analyst anticipations, captured through estimates like a 15% growth prediction for next year, echo the sentiment of enduring growth. This prognostication is underpinned by a unanimous uptrend in earnings estimates, showcasing confidence in AXP's trajectory.
Forecast: Considering the amalgamation of robust technical strength, cogent fundamentals, and a balance sheet that evidences strategic financial stewardship, the outlook for AXP is decidedly bullish. The alignment of rising technical indicators with strong fundamentals and optimistic analyst expectations forms a solid foundation for anticipating continued appreciation in AXP's stock price. However, it is imperative to note that market conditions, regulatory changes, and global economic factors could influence this trajectory. Investors should consider these dynamics in their decision-making process.
In synthesis, the meld of quantitative strength and qualitative assurance places American Express (AXP) in a favorable position for the subsequent months. Its stock price is poised to mirror the optimism encapsulated by its financial health, technical indicators, and the confidence bestowed by the analyst community. Diligent monitoring of upcoming financial reports and market conditions will be paramount in navigating the ebbs and flows of its stock price journey.
In our analysis of American Express Company (AXP), we have meticulously calculated two pivotal financial ratios: the return on capital (ROC) and the earnings yield, which provide profound insights into the company's operational efficiency and profitability from an investor's perspective. The return on capital for American Express stands at 10.503393953828619%, a metric that showcases the company's capability to generate returns from its capital investments. This indicates a healthy utilization of capital in generating profits, reflecting positively on the company's operational performance and strategic investment decisions. Additionally, the earnings yield for American Express is calculated to be 4.640655151315479%. This ratio, derived from the inverse of the P/E ratio, represents the proportion of a company's earnings relative to its share price, offering investors a measure of the bang-for-the-buck or the earnings generated for each dollar invested in the company's stock. A higher earnings yield is generally perceived as an indication of undervaluation. While AXPs earnings yield suggests a moderate return compared to other investment alternatives, it provides investors with a key metric to compare against industry peers or other investment opportunities, aligning with the investment philosophy discussed in "The Little Book That Still Beats the Market" of identifying companies that efficiently generate returns at a reasonable price.
| Statistic Name | Statistic Value |
| R-squared | 0.540 |
| Adj. R-squared | 0.540 |
| F-statistic | 1475 |
| Prob (F-statistic) | 5.25e-214 |
| Log-Likelihood | -2388.5 |
| No. Observations | 1257 |
| AIC | 4781 |
| BIC | 4791 |
| coef (const) | 0.0050 |
| coef (0) | 1.3321 |
| std err (const) | 0.046 |
| std err (0) | 0.035 |
| t (const) | 0.110 |
| t (0) | 38.402 |
| P>|t| (const) | 0.912 |
| P>|t| (0) | 0.000 |
| [0.025 (const)] | -0.085 |
| [0.975 (const)] | 0.095 |
| [0.025 (0)] | 1.264 |
| [0.975 (0)] | 1.400 |
| Omnibus | 707.046 |
| Prob(Omnibus) | 0.000 |
| Jarque-Bera (JB) | 28247.915 |
| Skew | 1.946 |
| Kurtosis | 25.895 |
| Cond. No. | 1.32 |
| Alpha | 0.0050353993805566264 |
| Beta | 1.3321161100763912 |
The linear regression model between AXP (American Express Company) and SPY (SPDR S&P 500 ETF Trust) illustrates the relationship between a specific financial security and the broader market as represented by SPY. Through this model, we identify a beta of 1.3321, revealing that AXP has a tendency to move 1.3321 times in the same direction as the market for every point movement in SPY. This suggests a more volatile behavior of AXP relative to the market, meaning it potentially offers higher returns, albeit with a higher risk. The alpha of 0.0050353993805566264, although seemingly small, indicates that AXP has a slight edge in generating returns independent of the market's movements, revealing its potential to offer excess returns above those predicted by its market risk alone.
Considering the statistical significance of the model's coefficients, the p-value for the beta coefficient is significantly low (0.000), affirming the reliability of the beta value in predicting AXP's performance relative to the market. However, the alpha's statistical significance, as indicated by its p-value of 0.912, is notably high, suggesting that the observed excess returns might not be statistically significant and could be attributed to randomness. Hence, while the beta coefficient underscores a stronger, consistent relationship between AXP stock movements and the overall market trends, the alpha hints at a less reliable measure of performance above market averages, emphasizing the importance of considering market volatility and risk factors in investment decision-making.
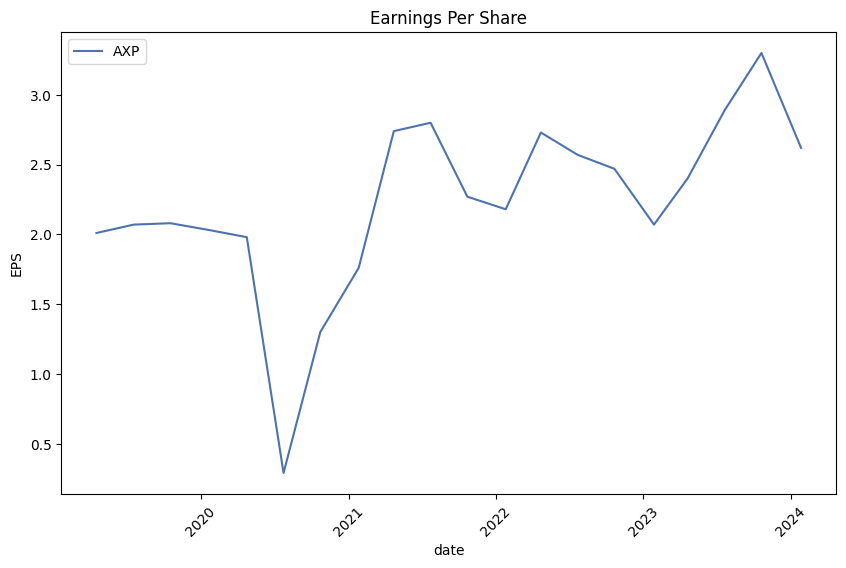
American Express Company (AXP) held its Q4 2023 earnings call, spotlighting significant achievements and financial performance for the year. The company announced record revenues of $61 billion, up 15% on an FX adjusted basis, and a record net income of over $8 billion, with earnings per share (EPS) reaching $11.21. The fourth quarter continued to demonstrate robust customer engagement and demand for its premium products, contributing to another quarterly record with revenues nearing $16 billion and EPS at $2.62.
Steve Squeri, Chairman and CEO, underscored the company's accomplishments over the last two years, particularly noting the successful execution of its growth plan set out at the beginning of 2022. The plan aimed to position American Express for long-term, elevated growth levels beyond pre-pandemic achievements. Squeri highlighted that the company expanded its business scale by over 40%, increasing annual revenues from $42 billion to $61 billion and growing annual card spending by 37% to a record $1.5 trillion. The addition of approximately 25 million new proprietary card accounts, with a significant portion coming from fee-based products, was also noted.
Christophe Le Caillec, Chief Financial Officer, detailed the company's financial performance, emphasizing the continued strong engagement and loyalty of card members globally despite a softer spend environment. He outlined the assumption for 2024, expecting spending trends to align with recent quarters. Moreover, he affirmed the company's approach to capital management, including plans to increase the quarterly dividend on common shares to $0.70, indicating a strategic focus on maintaining robust capital returns to shareholders.
Looking forward, American Express remains optimistic about its future prospects, driven by its differentiated business model, diversified revenue sources, focus on premium customers, and a growing partnership ecosystem. The company expects to deliver annual revenue growth between 9% and 11% and full-year EPS of $12.65 to $13.15 for 2024. This guidance reflects the company's confidence in its strategy and its ability to manage a range of potential outcomes. American Express underscores its commitment to delivering value to its customers and investors by focusing on innovative, unique value propositions and exceptional service, setting the stage for continued growth and success.
hting based on credit risk and operational risk, among other factors. It also proposes the introduction of a leverage ratio buffer for large banking organizations, which would be determined based on an organizations size and business model complexity. The proposal aims to better align U.S. capital rules with international Basel III standards, enhancing the ability of banks to withstand financial and operational shocks. While the specifics of how these changes would impact American Express Company and AENB depend on the final form of the regulations and their implementation timeline, adjustments to capital planning, risk management practices, and regulatory reporting processes would likely be necessary.
Economic Conditions and Operating Environment
American Express Company operates in a financial landscape that is continuously shaped by economic conditions and interest rate environments. The Federal Reserve and other central banks internationally have been navigating through periods of economic uncertainty, which includes managing interest rates to curb inflation while fostering economic growth. Such activities have implications on consumer spending patterns, credit risk profiles, and the company's cost of funds. As economies move through cycles of expansion and contraction, American Express must adapt its credit and risk management practices to maintain portfolio quality and ensure sustainable growth. Additionally, variances in foreign exchange rates influence the company's reported results, requiring effective management of currency exposure to safeguard profits.
Credit Quality and Consumer Spending
The credit quality of American Express cardholder base and the corresponding spending patterns are crucial factors driving the company's performance. With a premium customer base that exhibits high creditworthiness, American Express benefits from strong spending volumes, particularly in the Travel & Entertainment (T&E) segment which has shown resilience and growth as global travel recovers. However, the company remains vigilant on credit risk management, adjusting credit and fraud policies as necessary to navigate through uncertain economic conditions. The monitoring of net write-off rates and delinquency rates is pivotal for anticipating and mitigating potential credit losses, ensuring the company's portfolio remains healthy and profitable.
Regulatory and Compliance Landscape
The regulatory landscape for financial services companies like American Express is complex and evolving. Compliance with existing and new regulations incurs substantial costs and necessitates continuous investment in legal, compliance, and risk management capabilities. Regulatory actions, such as those relating to sales practices or consumer protection laws, can lead to significant financial penalties, operational changes, and reputational damage. The proposal to revise U.S. regulatory capital requirements underscores the need for ongoing agility in capital planning and risk management practices to meet both current and future regulatory expectations.
Overall, American Express Company continues to navigate through a challenging and dynamic operating environment marked by regulatory scrutiny, economic volatility, and competitive pressures. By focusing on premium customer segments, maintaining strong credit quality, and investing in growth and efficiency initiatives, American Express aims to sustain its strong performance and capitalize on market opportunities.
American Express Company, a distinguished entity within the financial services sector, continues to manifest its prowess through robust financial performance, strategic initiatives, and a favorable market perception that collectively augur well for its investment appeal. The companys operational strategy, emphasizing premium credit card services and an integrated payments system, underscores its unique market positioning and competitive edge.
The acknowledgment of American Express by industry analysts and financial experts, as showcased in various segments and reports, reflects a collective optimism regarding the companys trajectory. Notable is the emphasis on American Expresss characteristic resilience, evident from endorsements on CNBC and insights from The Motley Fool, which posit the company as a compelling investment amid broader economic uncertainties. Such endorsements are premised on its operational efficiency, market positioning, and strategic focus on catering to an affluent consumer base that boasts high spending capacity and lower delinquency rates.
American Express's strategic directions, underscored by CEO Stephen Squeri's emphasis on fostering a base of affluent customers, including Generations Z and X, signify a deliberate effort to secure and grow its market share in a high-value customer segment. This approach, supplemented by the company's adept navigation of economic downturns and its ability to leverage various growth levers, including membership fees and net interest income, positions it advantageously for sustained growth.
The financial narrative surrounding American Express is further enriched by its historical performance and future prospects. Analysts predict a continuation of record revenue growth, bolstered by strategic customer acquisition and retention strategies. Amid economic pressures such as inflation and interest rate hikes, American Express has demonstrated an unparalleled ability to not only weather adverse conditions but also to capitalize on the evolving spending patterns of its clientele.
Furthermore, American Expresss valuation metrics, juxtaposed with its peers within the credit card space, reveal a company that, despite its strong financials and strategic market positioning, may be undervalued. This presents an investment opportunity, particularly in a market environment increasingly skeptical of overvalued tech stocks and looking towards companies with solid fundamentals and clear growth trajectories.
The synthesis of American Expresss operational resilience, strategic market positioning, and the optimistic outlook shared by financial analysts and industry experts underscores the companys attractiveness as an investment option. Amid shifts in market preferences and economic challenges, American Expresss commitment to innovation, customer satisfaction, and strategic growth initiatives stand out, offering a compelling narrative for potential investors seeking a blend of stability and growth in the financial services sector.
The volatility of American Express Company (AXP) between February 12, 2019, and February 9, 2024, showcases noteworthy fluctuations as characterized by statistical analysis using the ARCH model. The analysis emphasizes considerable variability in asset returns, evident through a significant omega value and a notable alpha, indicating the presence of large changes in volatility over time. These metrics suggest that the value of AXP was subject to rapid and significant changes, underlining a high level of uncertainty and risk associated with its investment during this period.
| Statistic Name | Statistic Value |
|---|---|
| Log-Likelihood | -2719.99 |
| AIC | 5443.97 |
| BIC | 5454.24 |
| No. Observations | 1,257 |
| omega | 2.9488 |
| alpha[1] | 0.5601 |
Analyzing the financial risk of a $10,000 investment in American Express Company (AXP) over a one-year period involves an intricate study of the company's stock volatility and potential future returns. This approach combines advanced volatility modeling techniques with sophisticated machine learning predictions to offer a granular view of the investment's risk profile.
The volatility modeling technique employed in this analysis serves as a robust framework for understanding and quantifying the fluctuation in American Express Company's stock price. By leveraging historical price data, this model adeptly captures the persistence of volatility over time, allowing for a dynamic and predictive assessment of risk. This not only aids in recognizing patterns in the securities' price movements but also in foreseeing potential volatility clustering, a common phenomenon in financial markets where high volatility periods tend to be followed by high volatility and vice versa.
On the other hand, the machine learning predictions approach, specifically the utilization of a predictive algorithm based on decision trees, plays a critical role in forecasting future returns of American Express Company's stock. By analyzing past performance and various market indicators, this model learns the underlying relationships and patterns, enabling it to predict future stock price movements with a considerable degree of accuracy. This predictive capability is pivotal in assessing the potential upside or downside, hence contributing significantly to the overall risk assessment.
Focusing on the results, particularly the Value at Risk (VaR) calculated at a 95% confidence interval, provides a quantifiable measure of the risk involved in the investment. The VaR of $244.33 for a $10,000 investment in American Express Company implies that, with 95% confidence, the maximum expected loss over a one-year period would not exceed this amount. This assessment is critical for investors seeking to gauge the potential loss they might incur from their investment, thereby facilitating informed decision-making.
Through the integration of volatility modeling to capture and understand stock price fluctuations and employing machine learning predictions to forecast future returns, the analysis illuminates the potential financial risks associated with investing in American Express Company. By quantifying the potential maximum loss using the VaR metric, investors are equipped with a comprehensive view of the investment's risk profile, essentially bridging the gap between quantitative risk assessment and predictive financial modeling.
Analyzing the provided options chain for American Express Company (AXP) focusing on call options, we find a diverse range of Greeks across different strike prices and expiration dates. The "Greeks" provide crucial insights into the risk and potential profitability of each option, guiding traders in their investment decisions. In our analysis, we'll consider the Delta, which indicates the option's price sensitivity to stock price changes; Theta, showing the option's time decay; and Vega, which represents sensitivity to volatility. Additionally, we'll evaluate the Return on Investment (ROI) to identify the most profitable options.
For longer-term profitability, focusing on options with a higher ROI and favorable Greek values is beneficial. One standout option is the call option with a strike price of $75 and an expiration date of January 17, 2026. This option has a Delta of 0.949 and a high Vega, suggesting it's highly responsive to both stock price changes and shifts in market volatility. Additionally, its ROI stands out, indicating a potentially higher return compared to its counterparts.
Another lucrative option might be the call option with a strike price of $135 and an expiration date of January 17, 2025. This option presents a compelling Delta value close to 1, indicating it moves almost dollar for dollar with the stock, a desirable trait in bullish scenarios. Its Theta suggests a relatively slow time decay, and its Vega, although not the highest, provides sufficient responsiveness to volatility. The ROI for this option is moderately high, marking it as a potentially profitable trade.
For those looking for shorter-term investments, the call option with a strike price of $130 and a very high ROI, expiring on June 21, 2025, stands out. Its Delta is substantial, providing great sensitivity to price movements, while its Theta indicates it's less affected by time decay in the short term. It also possesses a non-zero Vega, adding an extra layer of profitability in volatile markets.
In summary, for long-term profitability, the option expiring on January 17, 2026, with a strike price of $75, and for a shorter-term but significant ROI, the option with a strike price of $130 expiring on June 21, 2025, appear to be the most promising. These options balance responsiveness to the stock's price movement, resilience to time decay, and the ability to capitalize on market volatility effectively. As always, it's crucial to consider the broader market context and individual risk tolerance when trading options.
Similar Companies in Credit Services:
Report: Visa Inc. (V), Visa Inc. (V), Report: PayPal Holdings, Inc. (PYPL), PayPal Holdings, Inc. (PYPL), Capital One Financial Corporation (COF), Upstart Holdings, Inc. (UPST), Mastercard Incorporated (MA), Report: Ally Financial Inc. (ALLY), Ally Financial Inc. (ALLY), SoFi Technologies, Inc. (SOFI), Synchrony Financial (SYF), Discover Financial Services (DFS), Square, Inc. (SQ)
https://www.youtube.com/watch?v=DBTJ2KdacbE
https://www.fool.com/investing/2024/01/02/a-dow-jones-bull-market-2-bargain-dividend-stocks/
https://www.fool.com/investing/2024/01/02/1-top-stock-to-buy-for-2024-and-beyond/
https://www.youtube.com/watch?v=UA4vZKR5scI
https://www.youtube.com/watch?v=l_E9nQH9w2w
https://www.youtube.com/watch?v=SmSjJXlbat0
https://www.fool.com/investing/2024/01/12/visa-mastercard-or-american-express-buy-this-warre/
https://seekingalpha.com/article/4663214-american-express-a-potential-forever-hold
https://www.fool.com/investing/2024/01/17/61-of-warren-buffett-led-berkshire-hathaways-360/
https://www.proactiveinvestors.com/companies/news/1038705?SNAPI
https://www.fool.com/investing/2024/01/21/warren-buffett-2-billion-dividend-income-2024/
https://www.fool.com/investing/2024/01/22/3-underrated-warren-buffett-stocks-that-are-smart/
https://www.fool.com/investing/2024/01/23/3-things-need-to-know-before-buy-top-buffett-stock/
https://www.sec.gov/Archives/edgar/data/4962/000000496223000038/axp-20230930.htm
Copyright © 2024 Tiny Computers (email@tinycomputers.io)
Report ID: PeN1MW
Cost: $0.96808
https://reports.tinycomputers.io/AXP/AXP-2024-02-11.html Home