General Dynamics Corporation (ticker: GD)
2024-02-03
 General Dynamics Corporation (ticker: GD) stands out as a key player in the aerospace and defense industry, primarily serving government clients around the globe. With its headquarters in Reston, Virginia, the company operates through four main segments: Aerospace, Combat Systems, Information Technology, Marine Systems, and Mission Systems. Notably, its Aerospace segment is renowned for manufacturing Gulfstream business jets, which are among the most prestigious in the market. Additionally, General Dynamics is a major supplier of tanks, armored vehicles, and submarines to the U.S. military and its allies. The company's robust portfolio also includes cutting-edge information technology services and solutions, which are critical to national security and cyber defense. Over the years, General Dynamics has demonstrated a solid track record of financial performance, underscored by consistent revenue growth, profitability, and a strong commitment to shareholder returns through dividends and share repurchases. Its strategic focus on innovation, customer satisfaction, and operational excellence has positioned it well for future growth in both existing and emerging defense and aerospace markets.
| Address | 11011 Sunset Hills Road | City | Reston | State | VA |
|---|---|---|---|---|---|
| Zip Code | 20190 | Country | United States | Phone | 703 876 3000 |
| Website | https://www.gd.com | Industry | Aerospace & Defense | Sector | Industrials |
| Full-Time Employees | 100,000 | Previous Close | 266.87 | Open | 265.74 |
| Day Low | 264.33 | Day High | 266.4003 | Dividend Rate | 5.28 |
| Dividend Yield | 0.0199 | Payout Ratio | 0.4393 | Five Year Avg Dividend Yield | 2.37 |
| Beta | 0.69 | Trailing PE | 22.06905 | Forward PE | 16.234394 |
| Volume | 1,683,180 | Average Volume | 1,156,316 | Average Volume 10 Days | 1,883,850 |
| Market Cap | 72,391,385,088 | Fifty Two Week Low | 202.35 | Fifty Two Week High | 269.5 |
| Price to Sales Trailing 12 Months | 1.7125139 | Fifty Day Average | 254.039 | Two Hundred Day Average | 230.3547 |
| Trailing Annual Dividend Rate | 5.28 | Trailing Annual Dividend Yield | 0.019784914 | Enterprise Value | 79,796,166,656 |
| Profit Margins | 0.07842 | Float Shares | 254,697,910 | Shares Outstanding | 272,896,992 |
| Total Cash | 1,912,999,936 | Total Cash Per Share | 7.004 | EBITDA | 5,107,999,744 |
| Total Debt | 9,260,999,680 | Total Revenue | 42,271,997,952 | Debt to Equity | 43.481 |
| Return on Assets | 0.04987 | Return on Equity | 0.1663 | Free Cashflow | 2,822,749,952 |
| Operating Cashflow | 4,705,999,872 | Revenue Growth | 0.075 | Gross Margins | 0.10042 |
| Sharpe Ratio | 0.734879406194263 | Sortino Ratio | 14.103227505002543 |
| Treynor Ratio | 0.25383358218100793 | Calmar Ratio | 1.3431632741466637 |
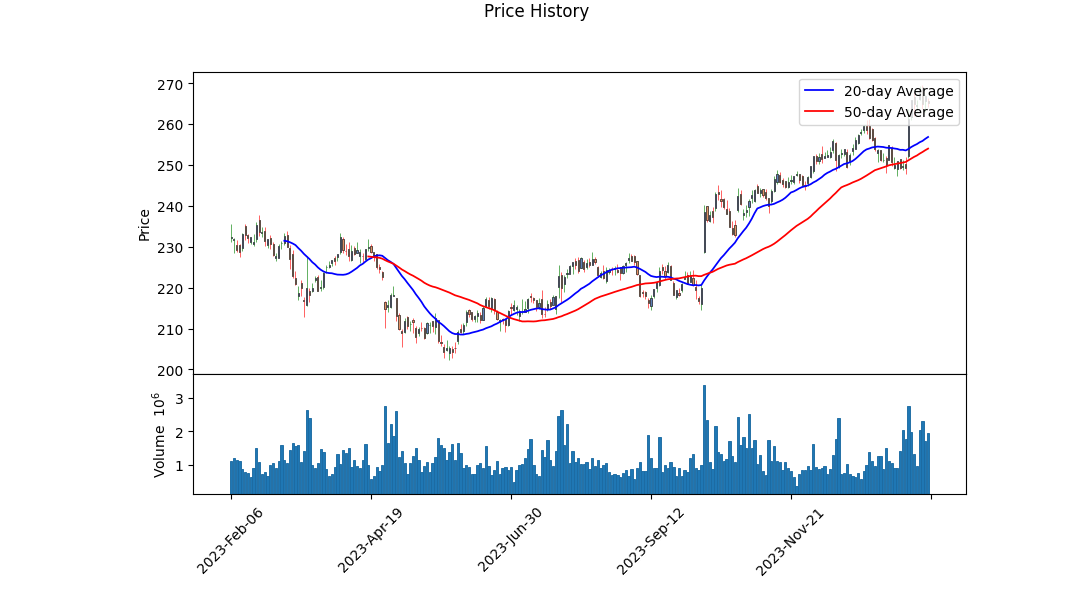
Analyzing the technical indicators, fundamentals, and risk-adjusted return ratios reveals a comprehensive picture of GD's financial health and potential stock price movement in the coming months. With a closing price incrementally rising over the observed period, accompanied by an increasing On-Balance Volume (OBV), which signifies growing investor confidence, the technical indicators paint a bullish outlook.
The Moving Average Convergence Divergence (MACD) histogram showing positive momentum toward the end of the period further bolsters this outlook. However, the absence of data in the initial part of this timeframe for the MACD histogram indicates the need for cautious optimism, as it may point to erratic movements in the earlier phases.
Turning to the fundamental analysis, GD presents a robust financial posture. With consistent growth in net income over the observed period and a reduction in total debt, the company appears to be on solid footing. The increase in free cash flow and a managed level of repurchase of capital stock highlight a company that is generating sufficient cash while returning value to shareholders, a positive signal to potential investors.
The analysis of risk-adjusted return ratios offers additional insight into GD's financial health and stock price potential. The Sharpe and Sortino ratios indicate a favorable return compared to the risk taken by investors. The especially high Sortino ratio suggests that the company is delivering strong returns on the downside risk, a desirable metric for risk-averse investors. Similarly, the Treynor and Calmar ratios, which measure returns on systematic and downside risk respectively, present GD as an attractive investment, considering its potential to offer considerable returns when accounting for its beta and drawdown risks.
Projected analyst expectations and growth estimates indicate an optimistic outlook, with a notable anticipation of revenue growth and earnings per share increase in the coming year. This, coupled with the financial health demonstrated by the balance sheet and cash flows, provides a sound basis for expecting sustained growth and profitability.
In conclusion, the combination of positive technical indicators, strong fundamentals, and favorable risk-adjusted return ratios positions GD as an attractive investment opportunity. The bullish signals from technical analysis, stable financials, and optimistic growth estimates collectively suggest that GDs stock price is likely to experience upward momentum in the forthcoming months. As with any investment, it remains vital for investors to consider broader market conditions and individual risk tolerance, but GD presents a compelling case for consideration in an investment portfolio based on the analyzed data.
In our analysis of General Dynamics Corporation (GD), we have closely examined the company's financial performance metrics to provide a comprehensive view on its investment potential. The Return on Capital (ROC) for General Dynamics stands at 11.71%, which is a robust indicator of how effectively the company generates profit relative to the capital invested in the business. This figure is particularly indicative of GD's ability to deploy its capital efficiently, resulting in favorable returns. On another note, the Earnings Yield for General Dynamics is calculated to be 4.58%. Earnings yield, which is the inverse of the Price-to-Earnings (P/E) ratio, offers insight into the profitability of an investment in GD's shares. This figure suggests that for every dollar invested in the stock, investors can expect to earn approximately 4.58 cents in profit. This yield is an essential measure for investors comparing potential returns across different investments, giving a clear perspective on GD's standing in terms of earnings generation relative to its market price. Together, these metrics showcase General Dynamics Corporation's solid financial health and its capability to deliver value to its investors.
Given the extensive data provided for General Dynamics Corporation (GD) across multiple periods, including quarterly and annual financial metrics, we'll distill some key information aligned with Benjamin Graham's investment criteria to form a cohesive investment analysis.
Investment Analysis Overview:
General Dynamics Corporation, recognized by its symbol GD, presents a myriad of financial metrics across several periods, ranging from Q1 2021 to Q3 2021, and also includes annual data for FY 2021. An analysis considering the philosophies of Benjamin Graham, focusing on intrinsic value, earnings growth, and a margin of safety, reveals insightful aspects of GD's investment suitability.
Fundamental Analysis Based on Benjamin Graham's Criteria:
1. Earnings Growth and Stability: - GD has shown consistent revenue and earnings across the quarters in 2021, indicating a level of operational stability. Such stability is a plus, as Graham emphasizes earnings consistency and modest growth over time for long-term investments.
2. P/E Ratio (Price-to-Earnings Ratio): - While the exact P/E ratio across the periods isn't directly provided, the earnings per share (EPS) figures point towards profitability. Investors should calculate GD's P/E ratio using its market price and compare it against industry averages and past performance. Graham typically favored a P/E ratio below 15 to 20 times earnings.
3. Debt-to-Equity Ratio: - GDs financial structure, indicated by liabilities and equity across multiple periods, necessitates a calculation of its debt-to-equity ratio. Graham preferred companies with a low debt-to-equity ratio, emphasizing financial stability and reduced leverage risk. The detailed debt figures, including short-term borrowings and long-term debt, would be crucial for this assessment.
4. Dividend Record: - GD has a history of paying dividends, as seen in the data, signifying a commitment to returning value to shareholders. Graham advocated for entities that had uninterrupted dividend payments for at least 20 years; hence, GDs recent dividend history should be cross-referenced with its longer historical performance.
5. P/B Ratio (Price-to-Book Ratio): - Investors should analyze GD's market valuation concerning its book value to obtain the P/B ratio, another critical metric for value investors akin to Graham. A P/B ratio under 1.5 is generally preferred by Graham, indicating a potentially undervalued stock or a company worth more than currently priced at, assuming the company is financially sound.
Conclusion:
General Dynamics Corporation exhibits hallmarks of earnings stability and shareholder return through dividends, aligning with aspects of Benjamin Grahams investment philosophy. However, a comprehensive investment suitability analysis necessitates additional calculations, including P/E and P/B ratios, and a deeper dive into debt levels compared to equity all weighed against broader market and industry benchmarks.
Potential investors should conduct a thorough due diligence process, considering both quantitative metrics and qualitative factors, including market position, product portfolio, and sector outlook, to ascertain GDs alignment with Grahams principles for value investing.
| Statistic Name | Statistic Value |
| R-squared | 0.440 |
| Adj. R-squared | 0.439 |
| F-statistic | 985.3 |
| Prob (F-statistic) | 4.11e-160 |
| Log-Likelihood | -1999.1 |
| No. Observations | 1257 |
| AIC | 4002. |
| BIC | 4013. |
| Alpha | 0.006285598915411145 |
| Beta | 0.798544217846699 |
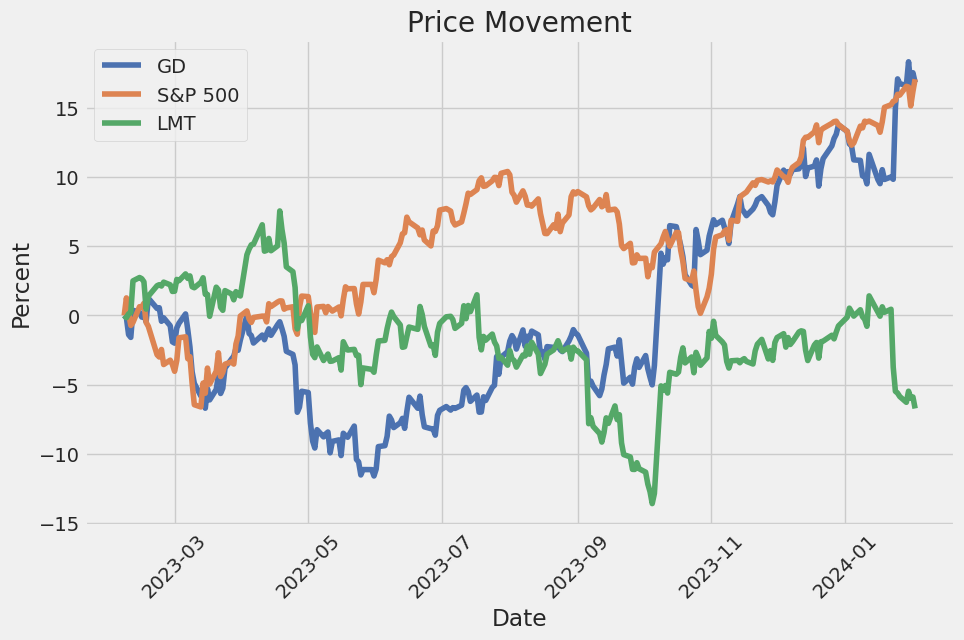
Using a linear regression model to examine the relationship between General Dynamics (GD) and the SPDR S&P 500 ETF (SPY), a proxy for the overall market, the analysis reveals a positive correlation between GD and the SPY. This is demonstrated by a beta coefficient of approximately 0.7985, suggesting that for every 1% change in the SPY, GD is expected to change by roughly 0.7985% in the same direction. The positive beta is indicative of GD's movements being generally in line with market trends, albeit with less volatility than the market. Additionally, the relatively high R-squared value of 0.440 implies that about 44% of the variations in GD's price can be explained by movements in the SPY, highlighting a significant, though not overwhelming, market influence on GD's performance.
The alpha value, or the intercept of the regression model, is approximately 0.0063, suggesting a slight positive return over the market return that is not accounted for by the market movements alone. However, considering the statistical significance of the alpha, with a p-value far above conventional significance levels (0.851), the alpha does not strongly indicate GD's performance superior to the market after adjusting for its systemic risk. Thus, while GD moves with the market to a considerable extent, as shown by its beta, the alpha suggests that after controlling for market movements, GD's unique returns are not significantly different from zero, pointing to a performance closely aligned with market expectations over the period studied.
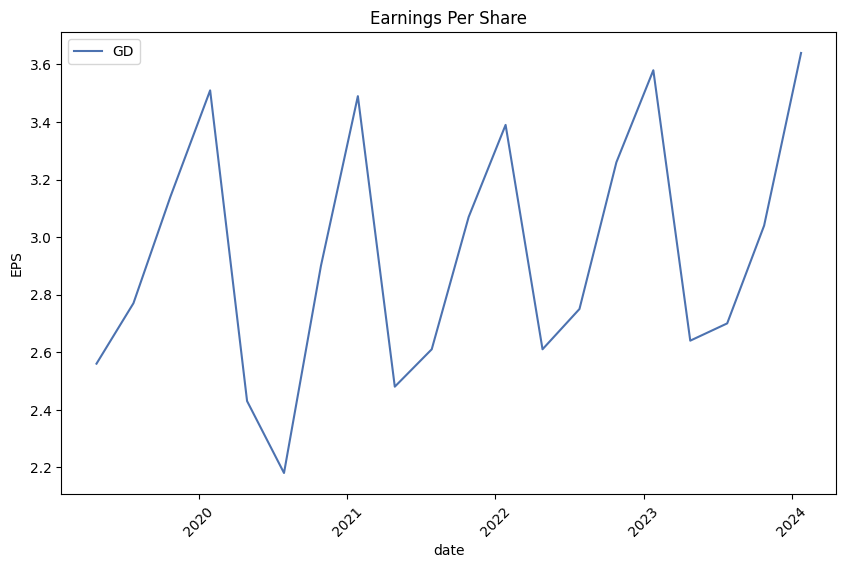
General Dynamics Corporation (GD) held its earnings conference call for the fourth quarter and full year of 2023, providing insights into its financial performance and operational highlights. The company reported a robust fourth quarter with earnings of $3.64 per diluted share on revenue of $11.668 billion, an increase of 7.5% over the same period the previous year. Operating earnings for the quarter stood at $1.288 billion, up $61 million from the fourth quarter of the previous year. Despite these positive results, earnings per share saw a modest growth of 1.7%, attributed partly to a $52 million decrease in other net income compared to the previous year. The sequential improvement was notable, with the final quarter being the strongest of the year in both revenue and earnings, maintaining a steady progression throughout the year.
For the full year of 2023, GD reported a revenue of $42.3 billion, which is a 7.3% increase from the previous year, and operating earnings of $4.25 billion, reflecting a moderate 0.8% uplift. However, earnings per fully diluted share decreased by 1.4% ($0.17), chiefly due to variations in below-the-line items like other income which was higher, and the tax provision, which was lower in 2022. This performance fell slightly below market consensus, mainly due to the G700 aircraft not receiving certification before the year's end, resulting in the non-delivery of 15 G700 units that were anticipated. Despite these challenges, General Dynamics emphasized the overall strength of the quarter and the year.
The company's strong backlog and order activity were highlighted, with a total backlog reaching $93.6 billion by year-end, a $2.5 billion increase over the previous year. The aerospace segment led with a 1.2 to 1 book-to-bill ratio, ending with a total backlog of $20.5 billion. The defense segments also performed well, with solid book-to-bill ratios, reflecting persistent demand across the company's portfolio. Cash performance was another area of strength, with $1.2 billion in operating cash flow for the quarter, leading to $4.7 billion for the year, bolstered significantly by Gulfstream orders and additional payments on Combat Systems international programs.
Looking ahead to 2024, General Dynamics provided a positive outlook. Phebe Novakovic, CEO, outlined expectations for enhanced revenue and operating margins across the company's segments, with particular attention to the anticipated increase in aerospace revenue by around 40% to about $12 billion, thanks in part to increased Gulfstream deliveries. The combat systems segment is expected to see a 3% revenue increase to $8.5 billion with a corresponding improvement in operating margin. Marine systems are projected to continue their growth trajectory, and the technologies segment is expected to see a slight uptick in revenue. Overall, the company projects a revenue increase of approximately 9.5% for 2024, with improved operating margins and an EPS forecast around $14.40. The company remains focused on overcoming the remaining supply chain challenges and maximizing the opportunities for growth and margin improvement across its diverse portfolio.
udgments and estimates associated with the recognition of revenue on long-term contracts, retirement plans and income taxes are critical because of their significance to our financial statements and the possibility that future events may differ markedly from our current estimates. There is no assurance that actual results will not differ from these estimates.
Revenue Recognition on Long-Term Contracts: Our revenue primarily comes from long-term contracts, particularly in our defense segments. Accounting for these contracts involves significant judgment and estimates to determine total contract revenue, costs, and profits. This includes assumptions about labor productivity, material costs, subcontractor performance, and the complexity of the work to be performed. As performance on a contract progresses, we regularly review and update our estimates. When there is a significant change in an estimate, we recognize the cumulative effect of the change in the current period, which can have a significant impact on our reported revenue and income. The Aerospace segment's revenue recognition, particularly relating to aircraft manufacturing and delivery, also involves significant estimates related to production costs and delivery schedules.
Retirement Plans: We provide a range of retirement benefits, including defined benefit pension plans and other post-retirement benefits. The cost of providing these benefits is subject to various actuarial assumptions, such as discount rates, expected returns on plan assets, compensation increases, health care cost trend rates, and mortality rates. These assumptions are reviewed annually and updated as necessary based on current market and economic conditions. Differences between these assumptions and actual results are recognized over future periods and can have a significant impact on the cost of providing pension and other post-retirement benefits, as well as our financial position.
Income Taxes: Our income tax expense includes estimates for taxes currently payable and deferred taxes related to differences between the financial reporting and tax bases of assets and liabilities. Determining these amounts requires interpretation of complex tax laws and regulations. We evaluate our tax positions and record liabilities for uncertain tax positions where the risk of audit exposure is reasonably high. Changes in our estimates for tax positions, or changes in tax laws, could significantly impact our income tax expense and net income in the period of change.
These critical accounting policies and estimates are key in understanding our financial condition and results. Managing these estimates requires a significant level of judgment, and changes in underlying assumptions or outcomes can have a material impact on our financial statements.
General Dynamics Corporation, an industry leader in global aerospace and defense, has carved a niche for itself through its innovative prowess and strategic endeavors. The company's extensive portfolio, encompassing combat vehicles, weapons systems, and sophisticated aerospace systems, has positioned it as a key player in the defense sector, navigating through the complexities and dynamic market conditions.
The scheduled webcast of its fourth-quarter and full-year financial results on January 24, 2024, marks a significant event for stakeholders. This initiative reflects General Dynamics' commitment to transparency and shareholder engagement, offering insights into its financial health and directions for the future. Such engagements are crucial, providing investors, analysts, and industry observers with a detailed overview of the company's performance and strategic initiatives. The wide-ranging products and services portfolio has bestowed upon General Dynamics a resilient and innovative character, crucial for staying ahead in the competitive defense and aerospace sectors.
Further investigations reveal the intricate connection between General Dynamics' prospects and the broader dynamics of the United States defense industry. The escalating geopolitical tensions, coupled with an anticipated growth in defense spending, present a favorable backdrop for the company. These factors, alongside the potential for strategic stock buybacks, underscore a promising outlook for General Dynamics, particularly in navigating the defense industry landscape in 2024.
Notably, General Dynamics' recognition as a dividend aristocrat highlights its financial stability and commitment to shareholder value, an emblem of its resilient performance amid economic volatilities. The company's strategic diversification across defense and aerospace dimensions has fortified its market position, offering a buffer against sector-specific downturns. This diversification is pivotal, especially considering the defense sector's reliance on governmental contracts and budgets, presenting a unique set of challenges and opportunities for the company.
The anticipation surrounding General Dynamics' participation in the Cowen 45th Annual Aerospace & Defense Conference on February 13 further exemplifies the company's industry leadership and commitment to strategic communication. This platform offers an invaluable opportunity for the company to elucidate its achievements, future endeavors, and strategic positioning, emphasizing its role as a frontrunner in the global defense and aerospace industry.
Moreover, General Dynamics' involvement in critically acclaimed projects like the Virginia-class and Seawolf-class submarines underlines its contribution to enhancing naval warfare capabilities and technological dominance. The development and manufacturing of these advanced submarines not only demonstrate General Dynamics' technical expertise but also its strategic importance to national defense and global security frameworks.
In essence, General Dynamics Corporation stands as a testament to innovation, strategic resilience, and financial stability within the defense sector. Its expansive portfolio, coupled with a strategic approach to market challenges and opportunities, positions the company for sustained growth and shareholder value enhancement. The forthcoming financial results webcast, combined with its involvement in high-profile defense projects and strategic industry engagements, underscores General Dynamics' pivotal role in shaping the future of the defense and aerospace sectors.
General Dynamics Corporation (GD) experienced noteworthy fluctuations during the observed period, with volatility modeled effectively using the ARCH (Autoregressive Conditional Heteroskedasticity) method. This model revealed a significant omega parameter, indicating a strong persistent component in the volatility, as well as a sizeable alpha[1] coefficient, which reflects the impact of past returns on current volatility. The statistical analysis, supported by a robust covariance estimator, underscores the intricate dynamics of General Dynamics Corporation's stock volatility, characterized by substantial shifts and the relevance of historical performance in predicting future volatility trends.
| Statistic Name | Statistic Value |
|---|---|
| Log-Likelihood | -2,254.82 |
| AIC | 4,513.65 |
| BIC | 4,523.92 |
| Omega | 1.5654 |
| Alpha[1] | 0.3600 |
Analyzing the financial risk of a $10,000 investment in General Dynamics Corporation (GD) over a one-year period encompasses a sophisticated blend of volatility modeling and machine learning predictions. The aim is to not only comprehend the inherent volatility of General Dynamics Corporation's stock but also to leverage predictive analytics in forecasting potential future returns.
Volatility modeling plays a crucial role in this analysis. By examining the historical price fluctuations of General Dynamics Corporation, this model provides a framework for understanding how volatile the stock is. It's particularly adept at capturing the persistence of volatility clusters, a common phenomenon in financial time series where periods of high volatility are often followed by more high volatility, and similarly for low volatility periods. This insight is invaluable as it directly impacts the risk associated with our investment, specifically by forecasting future price variability which, in turn, influences the potential for loss.
On the other hand, machine learning predictions contribute by analyzing historical data to make forecasts about future returns. Specifically, a predictive model like the one mentioned extracts patterns from past price movements and other relevant financial indicators to estimate what the stock is likely to do in the future. While historical performance is not always indicative of future results, this predictive power, when combined with an understanding of volatility, creates a more nuanced view of what the future might hold for an investment in General Dynamics Corporation.
The integration of these two approaches culminates in the calculation of the Annual Value at Risk (VaR) at a 95% confidence interval. For the $10,000 investment under consideration, the VaR is calculated to be $181.60. This value signifies that, under normal market conditions, there is a 95% confidence level that the investor will not lose more than $181.60 over the course of a year due to regular volatility. This metric is crucial as it quantifies the level of financial risk associated with the investment, offering a clear insight into potential losses that might be incurred from extreme, but not unlikely, market movements.
Therefore, by integrating insights from volatility modeling with forecasts derived through machine learning, investors can form a more comprehensive understanding of the potential financial risks involved in equity investments. This mixture not only enhances the assessment of General Dynamics Corporation's stock volatility but also improves the accuracy of predicting future returns, thereby offering a detailed picture of the economic implications tied to investing $10,000 in General Dynamics Corporation over a one-year period.
Based on the provided options chain for General Dynamics Corporation (GD) call options, and with an analysis focused on the Greeks along with other metrics like premium, ROI (return on investment), and profit, we can discern which options might be the most profitable under the condition that the target stock price is a 5% increase over the current stock price.
Starting from the top, it's clear that some options stand out due to their significant ROI and profit despite having varying premiums. Let's delve deeper into a selection of these options:
-
Option with a strike of 157 (expiry not provided) - This option boasts a high Delta () of 0.981206, which suggests that the option's price is highly sensitive to changes in the underlying stock price. The Gamma () and Vega () are both zero, indicating no convexity to changes in the underlying stock price or volatility, respectively, perhaps due to it being deep in-the-money or nearing expiry. With a premium of 53.17 and an ROI of 1.135292, this option yields a profit of 60.3635, making it exceptionally attractive for those betting on a slight increase in GD's stock price.
-
Option with a strike of 18 (expiry not provided) - This option has an even higher Delta of 0.999346, effectively moving almost one-to-one with the stock price, but again with no Gamma or Vega, emphasizing its deep in-the-money nature. The premium is lower at 48.60, with a higher ROI of 1.233200 and a very close profit of 59.9335. Its high Delta and ROI make it a strong candidate for profitability.
-
Option with a strike of 152 (expiry not provided) - Similar in Greek profile to the first option but with a significantly higher premium of 105.55. Despite the higher cost of entry, it offers an ROI of 0.549346 with a profit of 57.9835. This suggests that while more capital is at risk, the expected return is still favorable.
-
Lower-Priced Options - Towards the bottom of the table, we see options with much lower premiums and significantly different Greeks. For example, the option with a strike of 41 has a very low Delta (0.067010), indicating minimal sensitivity to the stock price movement, but a higher Gamma and Vega, suggesting it's far out-of-the-money and more sensitive to changes in volatility. These options offer minimal profit and ROI, suggesting they are less attractive under the scenario of a 5% stock price increase.
In summary, the most profitable call options for General Dynamics Corporation, assuming a target 5% increase in the stock price, appear to be those with high Delta values and significant ROI. Specifically, the options with strikes at 157 and 18, despite their differing premiums, offer the most attractive balance between the cost of entry (premium), sensitivity to the underlying stock price movement (Delta), and overall profitability (ROI and profit). Their lack of Gamma and Vega values likely points to them being deep in-the-money, hence their responsive nature to price movements in the short term. Investors or traders looking for profitable call options should consider these factors along with risk tolerance and market conditions before making decisions.
Similar Companies in Aerospace & Defense:
Lockheed Martin Corporation (LMT), Report: Raytheon Technologies Corporation (RTX), Raytheon Technologies Corporation (RTX), Report: L3Harris Technologies, Inc. (LHX), L3Harris Technologies, Inc. (LHX), Huntington Ingalls Industries, Inc. (HII), Report: Northrop Grumman Corporation (NOC), Northrop Grumman Corporation (NOC), The Boeing Company (BA), Curtiss-Wright Corporation (CW), Hexcel Corporation (HXL), Textron Inc. (TXT)
https://seekingalpha.com/article/4664690-general-dynamics-gd-q4-2023-earnings-call-transcript
https://finance.yahoo.com/news/q4-2023-general-dynamics-corp-040440493.html
https://finance.yahoo.com/news/company-news-jan-25-2024-142500294.html
https://finance.yahoo.com/news/growth-investor-1-stock-could-144507058.html
https://finance.yahoo.com/news/general-dynamics-corporation-nyse-gd-144559519.html
https://finance.yahoo.com/m/d460801e-d276-3eec-9052-0455f3712b9d/booz-allen-breaks-out%2C.html
https://finance.yahoo.com/news/general-dynamics-ceo-speak-cowen-220000903.html
https://finance.yahoo.com/news/15-navies-most-submarines-world-230237301.html
https://www.sec.gov/Archives/edgar/data/40533/000004053323000070/gd-20231001.htm
Copyright © 2024 Tiny Computers (email@tinycomputers.io)
Report ID: PrN3Mx
Cost: $1.01833