Raytheon Technologies Corporation (ticker: RTX)
2024-02-03
 Raytheon Technologies Corporation, traded under the ticker symbol RTX on the New York Stock Exchange, stands as a prominent player in the aerospace and defense industry. With its foundation stemming from the 2020 merger between Raytheon Company and United Technologies Corporation, RTX has strategically positioned itself to provide a broad array of high-technology products and services. The company's operations are divided among several key segments, including intelligence, space, missile defense, and advanced electronics, which cater to a global clientele that spans both government and commercial sectors. Financially robust, RTX has shown resilience and growth potential amidst fluctuating market conditions, driven by its commitment to innovation, strategic partnerships, and expanding its global footprint. Its emphasis on research and development further underlines the company's dedication to maintaining a competitive edge in the ever-evolving aerospace and defense landscape. With a solid track record and a forward-looking approach, Raytheon Technologies Corporation continues to assert its significance in shaping the future of defense and aerospace solutions on a global scale.
| Full Time Employees | 180,000 | CEO & Chairman Total Pay | $6,821,349 | President COO & Director Total Pay | $2,758,460 |
| Chief Financial Officer Total Pay | $2,304,639 | President of Collins Aerospace Systems Total Pay | $1,888,193 | Executive Officer Total Pay | $1,708,553 |
| Market Cap | $132,258,045,952 | Previous Close | $92.17 | Volume | 6,064,755 |
| Average Volume | 8,072,345 | Dividend Rate | $2.36 | Dividend Yield | 0.0257 |
| Fifty Two Week Low | $68.56 | Fifty Two Week High | $104.91 | Trailing PE | 41.24664 |
| Forward PE | 15.12829 | Enterprise Value | $164,922,703,872 | Net Income to Common | $3,195,000,064 |
| Total Cash | $6,586,999,808 | Total Debt | $45,239,001,088 | Total Revenue | $68,920,000,512 |
| Book Value | 44.135 | Price to Book | 2.0840604 | EBITDA | $9,555,999,744 |
| Current Ratio | 1.035 | Return on Assets | 0.02083 | Return on Equity | 0.049829997 |
| Free Cash Flow | $6,014,000,128 | Earnings Growth | 0.093 | Revenue Growth | 0.101 |
| Sharpe Ratio | -0.19620478766467442 | Sortino Ratio | -2.9762763921567106 |
| Treynor Ratio | -0.08700203019034837 | Calmar Ratio | -0.10239371073977117 |
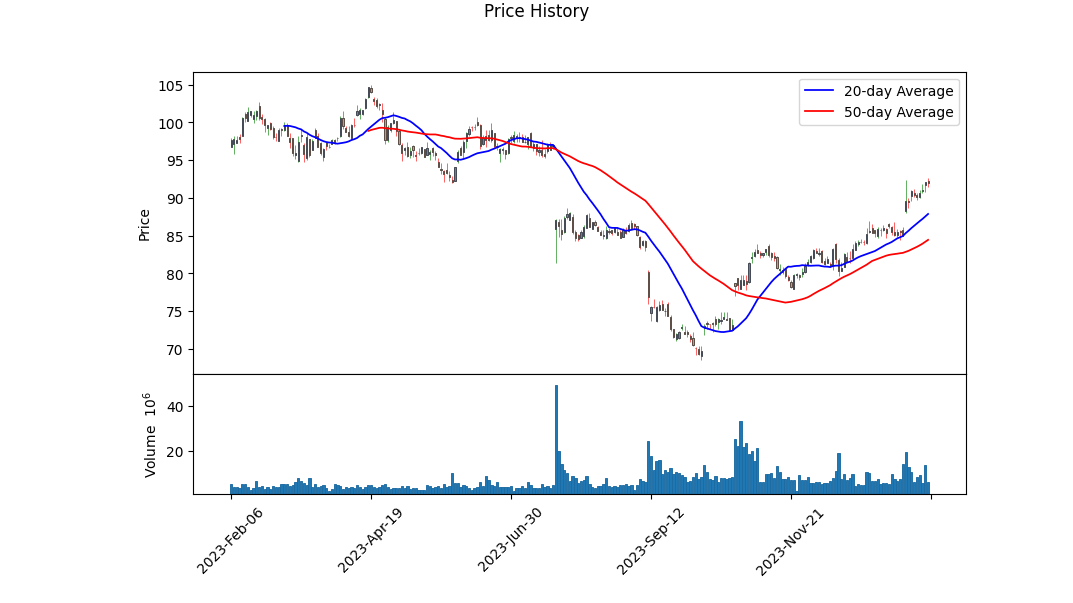
Analyzing RTX using a blend of technical analysis, fundamental analysis, and key financial ratios reveals insights into its potential stock price movement over the next few months. Technical indicators, including the On-Balance Volume (OBV) and Moving Average Convergence Divergence (MACD), point towards a positive price movement. The rising OBV indicates accumulating volume behind the stock price increase, suggesting a strong buying interest. The MACD histogram, which also has shown positive values in the latter part of the observed data, corroborates this bullish sentiment by indicating momentum behind the price increases.
Fundamentally, RTX exhibits a robust financial structure with significant operating and gross margins that underscore its efficiency in revenue generation and cost management. Furthermore, the cash flow statements reflect a healthy liquidity position, with a notable free cash flow that can support both operational needs and strategic investments. Despite some debt, the net debt figures and the management of debt across the financial years reflect prudent financial controls and a sustainable capital structure.
The balance sheets underscore a solid asset base with controlled liabilities, providing RTX with a stable foundation to weather economic variances and invest in growth opportunities. The analyst expectations, revealing an uptick in earnings estimates and positive sales growth projections, further buoy investor confidence. It implies an optimistic outlook on the company's revenue and profitability trajectory, aligning with the growth and expansion strategies delineated by the management.
Lastly, examining the risk-adjusted performance metricsSharpe, Sortino, Treynor, and Calmar ratiospaints a complex picture. The negative Sharpe and Sortino ratios indicate that the stock has not provided returns commensurate with its volatility or downside volatility, respectively, in the past year. However, these figures should be contextualized within broader market conditions and company-specific challenges during the period. They indicate caution but should not be a deterrent if other indicators are promising.
In conclusion, integrating the insights from technical analysis, fundamental analysis, and risk-adjusted performance measures, RTX appears poised for upward price movement in the coming months. The confluence of solid financial fundamentals, positive market sentiment as reflected through technical indicators, and overarching economic conditions suggest a favorable environment for growth. Investors and stakeholders should, however, remain vigilant of market dynamics and company-specific developments that could influence the trajectory.
In our latest analysis focusing on Raytheon Technologies Corporation (RTX), two pivotal metrics stand out: the Return on Capital (ROC) and Earnings Yield, both of which are crucial for assessing the company's financial performance and investment attractiveness. Raytheon Technologies has demonstrated a Return on Capital (ROC) of approximately 2.97%. This figure indicates how effectively the company is utilizing its capital to generate profits, albeit suggesting a modest efficiency level in transforming invested capital into earnings. Additionally, the Earnings Yield for RTX is calculated to be around 2.58%. Earnings yield, essentially the inverse of the price-to-earnings ratio, offers insight into the profitability from the shareholders' perspective, showing the percentage of each dollar invested in the stock that was earned by the company. In the context of RTX, this indicates a relatively low yield, suggesting that the company's current stock price may be high compared to the earnings it generates. Both metrics should be meticulously analyzed in conjunction with other financial and market factors to formulate a comprehensive investment strategy regarding Raytheon Technologies Corporation.
Based on the complex financial data provided for Raytheon Technologies Corporation (RTX), we can extract and comment on several key metrics and how they compare to Benjamin Graham's criteria for selecting stocks. Given the volume and complexity of the data, we will focus on summarizing the key metrics relevant to Graham's principles:
-
Debt-to-Equity Ratio: Graham preferred companies with a low debt-to-equity ratio. RTX's debt-to-equity ratio can be derived from the balance sheet items (total debt divided by total stockholder equity). The detailed data necessary for exact calculation isn't directly provided, but the information on long-term debt and stockholder's equity allows for estimations. Generally, for Grahams strategy, a ratio below 0.5 is preferred, implying that the company doesn't rely heavily on debt to finance its operations.
-
Current and Quick Ratios: Graham favored a current ratio (current assets/current liabilities) above 2 and a quick ratio (quick assets/current liabilities) above 1 to ensure financial stability. Again, specific closing balances for each quarter will have to be examined for precise calculation, but with comprehensive assets and liabilities data provided, RTX appears to have significant resources to cover its short-term obligations, though the exact current and quick ratios would need to be calculated.
-
Earnings Growth: Benjamin Graham looked for a history of stable earnings growth. The provided financial data outline various income and operating figures across different quarters, but without direct comparisons year-over-year, specific growth rates aren't immediately clear. However, consistent positive net income and operating income suggest stable performance.
-
P/E (Price-to-Earnings) Ratio: Graham typically sought stocks with P/E ratios below 15, which indicates that the stock is reasonably priced relative to its earnings. The provided data do not include share price or exact P/E calculations, but these numbers can be derived from available earnings data in conjunction with historical stock price information.
-
Dividend Record: Graham favored companies with a consistent dividend record. The presented data contain mentions of dividend payments, implying that RTX does indeed have a history of paying dividends, fitting Graham's criterion of rewarding shareholders and indicating financial stability.
-
P/B (Price-to-Book) Ratio: Graham often focused on companies trading below their book value, as determined by the P/B ratio (market price per share/book value per share). Although specific market prices and book values per share are not given, the financial statements provide assets and liabilities data needed to assess the company's book value overall.
For a comprehensive analysis consistent with Benjamin Graham's investing principles, an investor would need to calculate or obtain the specific ratios and figures based on the provided financial data, as well as market data like the stock price for periods in question. However, based on the provided segments, RTX demonstrates several of the characteristics Graham advised investors to look for, such as a strong dividend record and substantial assets compared to liabilities, hinting at a potentially sound investment from a value investing perspective, pending further exact calculations.
| Statistic Name | Statistic Value |
| R-squared | 0.415 |
| Adj. R-squared | 0.415 |
| F-statistic | 890.6 |
| Prob (F-statistic) | 2.47e-148 |
| Log-Likelihood | -2368.0 |
| No. Observations | 1257 |
| AIC | 4740 |
| BIC | 4750 |
| Const | -0.0168 |
| Coef | 1.0182 |
| Std Err | 0.034 |
| t | 29.843 |
| P>|t| | 0.000 |
| [0.025 | 0.951 |
| 0.975] | 1.085 |
| Omnibus | 196.724 |
| Prob(Omnibus) | 0.000 |
| Jarque-Bera (JB) | 3022.178 |
| Skew | -0.075 |
| Prob(JB) | 0.00 |
| Kurtosis | 10.595 |
| Cond. No. | 1.32 |
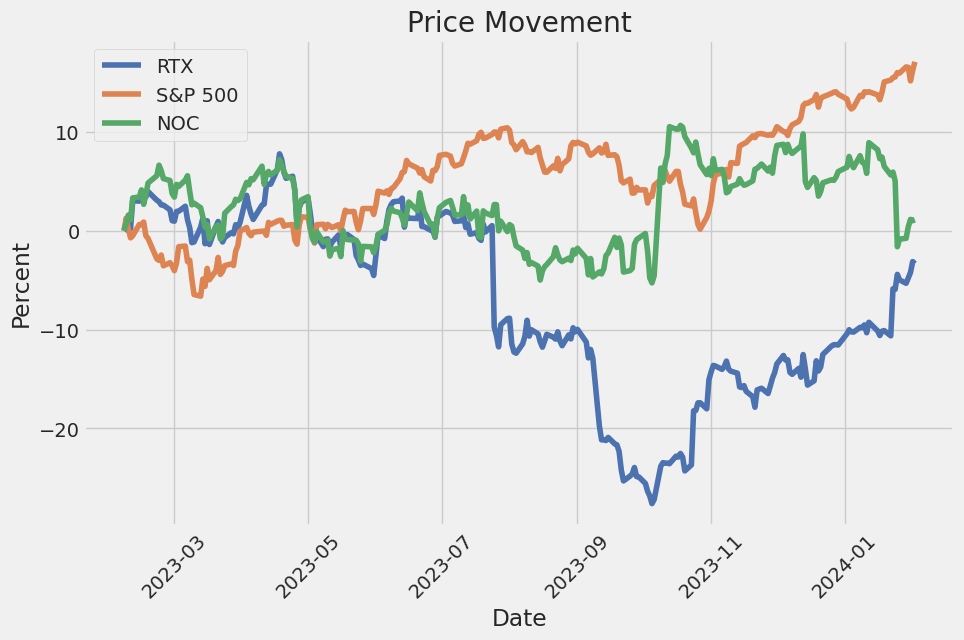
The linear regression model between RTX (Raytheon Technologies Corporation) and SPY (SPDR S&P 500 ETF Trust), which is a proxy for the overall market, reveals a positive relationship indicated by a beta of approximately 1.0182. This means that, on average, for every 1% increase in SPY, RTX is expected to increase by about 1.0182%, adjusting for other variables. However, the alpha, or the intercept, of this model is -0.0168, implying that in the absence of any market movement, RTX is expected to slightly underperform by approximately 1.68% in the period analyzed. Although this negative alpha suggests a slight underperformance relative to the market's constant movements, the positive beta coefficient highlights that RTX's returns have a tendency to move in the same direction as the market.
The statistical significance of the model's coefficients, coupled with a relatively robust R-squared value of 0.415, indicates that roughly 41.5% of the variability in RTX's returns can be explained by the movements in the market index (SPY). While this does not account for the majority of RTX's price movements, it demonstrates a significant market influence. The model's strong F-statistic and its associated probability affirm the overall significance of the regression analysis, yet the presence of a negative alpha signals that investors might need to consider other factors beyond market movements to fully understand RTX's performance. The detailed statistical output further supports the validity of these findings, emphasizing the importance of considering both market trends and individual stock fundamentals in investment decision-making.
Raytheon Technologies Corporation (RTX) held its fourth-quarter 2023 earnings call, highlighting several key updates and financial results. Greg Hayes, the Chairman and CEO, announced that Chris Calio will succeed him as the new CEO effective May 2, following a deliberate succession planning process by the Board of Directors. Hayes expressed his confidence in Calio's leadership and his gratitude towards RTX employees for their dedication and effort over the years.
Chris Calio, the incoming CEO, took the opportunity to thank RTX employees for their contributions and outlined the company's focus on delivering a record backlog, accelerating innovation, and driving operational performance. He announced leadership changes, including Wes Kremer's retirement and Phil Jasper's appointment as President of Raytheon business. Calio also provided market updates, highlighting strong demand in both commercial aerospace and defense sectors, with significant growth in air traffic and unprecedented demand for air defense systems.
Neil Mitchill, CFO of RTX, provided detailed financial results for the fourth quarter, noting organic growth across all segments, a notable increase in segment operating profit, and strong free cash flow. The company reported adjusted sales of $19.8 billion, up 10% organically versus the prior year, with adjusted earnings per share of $1.29. Mitchill also outlined the financial outlook for 2024, expecting solid growth in adjusted sales, segment operating profit, and earnings per share.
Throughout the call, several challenges and plans for improvement were highlighted. These included the focus on resolving Pratt's powdered metal issue, addressing margin challenges at Raytheon, and ongoing efforts to manage supply chain constraints. The leadership emphasized their commitment to operational execution, strategic investments in innovation and technology, maintaining a strong balance sheet, and returning capital to shareholders. The call concluded with an open session for questions, addressing topics such as GTF engine production, market dynamics in commercial aerospace, and the financial impact of the powdered metal issue on future performance.
Raytheon Technologies Corporation (RTX), now legally known as RTX Corporation, is a prominent entity in the aerospace and defense industry, operating through its varied segments that cater to commercial, military, and government customers globally. The company's third-quarter financials for 2023, as reported in their 10-Q filing, shed light on various aspects of their operations, financial health, and future outlook.
During the quarter ending September 30, 2023, RTX continued to face challenges and opportunities inherent in the global aerospace and defense markets. The company's financial results were affected by various factors, including the consequences of the Russian military's invasion of Ukraine, leading to broad economic sanctions and export controls that have implications for RTX's operations and financial conditions. The sanctions, among others, restrict transactions involving Russian entities and impose export controls limiting the aerospace sector's interactions with Russia. RTX reported taking a consequential charge related to credit losses, inventory reserves, and other financial impacts due to these sanctions, indicating the geopolitical risks involved in its operations.
RTX's financial performance during this period also reflects the impact of the COVID-19 pandemic, which has disrupted global economies and the industries RTX serves. While the long-term fundamentals driving air travel demand remain strong, the company acknowledges the pandemic's continued effects on its business, including challenges related to the labor market, supply chains, inflation, and overall financial performance. RTX's strategies and expectations regarding recovery from these impacts are based on currently available information, though the precise financial implications are notably uncertain and could vary significantly based on future developments.
Furthermore, the filing highlights an important operational update within RTX's Pratt & Whitney segment related to a powder metal matter affecting the PW1100 Geared Turbofan (GTF) engine fleet. This issue has necessitated accelerated inspections, resulting in additional costs and customer compensation. RTX reported taking a substantial charge in the third quarter to cover these unforeseen expenses, illustrating the technical and financial complexities involved in aerospace manufacturing and maintenance.
RTX's financial statements provided a detailed accounting of net sales, operating expenses, and comprehensive income, showcasing the company's ability to generate revenue and manage costs amidst a challenging operational environment. Particular attention was given to the recalibration of estimates and liabilities related to environmental remediation activities, showcasing RTX's commitment to sustainable operations and regulatory compliance across its global operations.
This 10-Q filing underscores RTX's ongoing navigation through a complex array of operational, financial, and geopolitical challenges. The company's strategic adjustments, financial prudence, and focus on sustainability and compliance are evident as it continues to serve a critical role in the global aerospace and defense sectors. The outlined financial metrics, along with the discussed impacts of external events and internal operational challenges, reflect RTX's resilience and strategic approach to managing its broad portfolio of businesses.
Raytheon Technologies Corporation (RTX) has maintained its role as a leading entity in the aerospace and defense sector through strategic planning, technological innovation, and a focus on sustainability, as evidenced by discussions in its recent earnings call and analyses across several financial platforms. From tackling engine manufacturing challenges to securing significant defense contracts, RTX demonstrates resilience and adaptability in a rapidly evolving global market.
The company's strategic direction, grounded in enhancing shareholder value while pushing the boundaries of aerospace and defense technology, positions it favorably among industry peers. Despite facing setbacks such as the engine recall impacting its Pratt & Whitney subsidiary, RTXs diversified operations and strategic focus areas, including hypersonic weapons and cyber warfare, underscore its prospects for recovery and growth.
RTX's enduring commitment to R&D and sustainability initiatives aligns with global trends towards eco-friendly technologies and ethical business practices. These efforts not only position the corporation as a forward-thinking industry leader but also address investor demands for environmentally responsible investment opportunities. Furthermore, the companys proactive approach to addressing supply chain disruptions exemplifies operational excellence and strategic foresight.
The recent earnings call highlighted RTX's optimism for the future, backed by a record backlog and a strategic emphasis on areas expected to drive long-term growth. The companys financial outlook, despite some challenges, reflects a stable and potentially lucrative investment proposition, marked by a solid balance sheet, strategic share repurchase programs, and a focus on shareholder returns.
Moreover, RTX's re-engagement with Stinger missile production amid growing international defense demands illustrates its capacity to respond dynamically to market needs. The anticipated rebound in commercial aerospace, alongside robust defense spending, provides a solid foundation for RTX's revenue and profit growth.
In assessing RTX's trajectory and potential as a resilient investment, various analyses suggest a cautious yet optimistic outlook. The company's strategic initiatives, technological leadership, and commitment to sustainability and ethical practices are poised to drive its recovery and growth in the coming years. Investors and stakeholders are thus encouraged to monitor RTX's progress closely, considering both the opportunities and challenges that lie ahead in the aerospace and defense landscape.
Raytheon Technologies Corporation (RTX) experienced notable volatility from February 2019 to February 2024, as evidenced by its ARCH model analysis. The model highlights the absence of a direct relationship between preceding period returns and the current return but points out significant volatility patterns in the data. Specifically, the ARCH parameter (alpha[1]), indicative of the impact of past volatility on current volatility, shows a substantial effect, underscoring periods of heightened market sensitivity and unpredictability in RTX's stock price movement.
| Statistic Name | Statistic Value |
|---|---|
| Log-Likelihood | -2585.92 |
| AIC | 5175.84 |
| BIC | 5186.12 |
| omega | 2.6575 |
| alpha[1] | 0.4176 |
Analyzing the financial risk of a $10,000 investment in Raytheon Technologies Corporation (RTX) over a one-year period requires a sophisticated approach that blends volatility modeling and machine learning predictions to forecast future stock behavior and potential investment risks. This integration not only provides a dynamic view of the investment landscape but also enhances the precision of risk estimation, particularly in the volatile defense and aerospace sectors in which RTX operates.
Volatility modeling, specifically through the widely adopted ARCH (Autoregressive Conditional Heteroskedasticity) family models, plays a crucial role in understanding and quantifying the erratic behavior of RTX's stock prices. By focusing on the variability and the conditional variance within the stock's historical price movements, this approach delivers a robust framework to gauge the inherent volatility that investors might face. The model treats volatility as a variable that changes over time, influenced by past errors or shocks to the stock's returns, which is particularly relevant for a company like Raytheon Technologies Corporation, operating in an industry susceptible to geopolitical tensions, defense spending, and technological advancements.
In tandem with volatility modeling, incorporating machine learning predictions through a model like the decision-tree-based approach enhances the capability to forecast future returns. This methodology leverages historical data, learning from patterns of stock price movements, and incorporating numerous variables that might affect stock performance, including market trends, company performance indicators, and macroeconomic factors. By applying this technique, the analysis can move beyond the constraints of linear regression models, accommodating the non-linear complexities inherent in financial markets.
When combined, these methodologies allow for a nuanced risk assessment, quantified by the Value at Risk (VaR) metric. The calculated Annual VaR at a 95% confidence level for a $10,000 investment in RTX stands at $247.65. This figure represents the potential loss in value that, under normal market conditions, should not be exceeded with 95% confidence over a one-year period. It highlights the quantified risk of investment based on both the inherent volatility captured by the volatility modeling and the expected future returns informed by machine learning predictions.
The integration of volatility modeling and machine learning predictions provides a comprehensive overview of the potential risks in equity investment in RTX. By utilizing these methods, investors can gain insights into both the expected volatility and the anticipated direction of the stock, enabling a more informed investment decision. This approach reflects the evolving landscape of financial risk management, where traditional and contemporary methods converge to offer a detailed risk profile, exemplified by the estimated Value at Risk. This calculated risk, represented by the VaR figure, serves as a critical indicator for investors to gauge potential financial exposure and make strategic investment decisions accordingly.
Analyzing the options trading data for Raytheon Technologies Corporation (RTX) based on the provided parameters centers around finding call options with the highest likelihood of profitability given a target stock price increase of 5%. The pivot of our analysis includes Delta, Gamma, Vega, Theta, premium, and projected ROI (return on investment) complemented by profit margins.
-
High Delta Options: When focusing on options with high delta values, we're looking at options that are already in-the-money (ITM) or have a high probability of ending ITM should the stock price increase by the target 5%. For instance, the call options with delta values of 0.994733, 0.992774, and 0.999155 stand out for their proximity to 1, indicating almost a 1:1 responsiveness to changes in the underlying stock price. Among these, the option with a delta of 0.999155 and a premium of 27 USD is quite appealing, showcasing a ROI of 0.539963 and a profit of 14.579. This option, given its short expiration of 12 days, could be a lucrative short-term investment if the stock's price surges as anticipated.
-
Options Near Expiration: The relationship between theta and short expirations is crucial. Theta represents the rate of time decay of an option's value. An option with a high delta and a low theta, like the one with a delta of 0.999155 and a theta of 0.000402, indicates minimal value loss over time, making it a strong candidate for profitability in a short span. Despite the high immediate cost, the combination of a high ROI and a short time to expiration could yield significant returns on a bullish bet on RTX.
-
Low Vega and Gamma in High Delta Options: A remarkable observation is the zero values of vega and gamma in the high delta options. Typically, gamma and vega reflect the sensitivity of an option's delta to changes in the underlying's volatility and price, respectively. In this case, the lack of sensitivity (shown by the zeros) implies that these options are less influenced by volatility swings, which could be advantageous in a stable or predictably bullish market. This stability provides a clearer forecast of potential returns, as seen with the options listed.
-
Optimal Picks for Profitability:
- For a short-term investment strategy aiming for high returns, the option with a delta of 0.999155, boasting the highest ROI of 0.539963 and a profit of 14.579, is particularly attractive. Its low theta suggests it retains value well despite the looming expiration.
- The option with a delta of 0.994733 and a 75-day expiration strikes a balance between ROI (0.517231) and time, offering a middle ground for those seeking slightly longer investment horizons without significantly sacrificing potential returns.
- Investors looking for a blend of safety and returns might lean towards the option with a 229-day expiry, presenting a more moderate ROI of 0.578949 but the highest profit figure of 17.079. The extended timeframe here allows for more flexibility in response to market movements.
Given the volatility of the options market, these findings outline pathways for potentially lucrative investments in RTX's call options, focusing on factors like delta, premium cost, and theta. However, it's crucial to consider that options trading carries significant risk, and these projections are contingent upon market conditions aligning with assumptions.
Similar Companies in Aerospace & Defense:
Report: Northrop Grumman Corporation (NOC), Northrop Grumman Corporation (NOC), Report: General Dynamics Corporation (GD), General Dynamics Corporation (GD), The Boeing Company (BA), Report: L3Harris Technologies, Inc. (LHX), L3Harris Technologies, Inc. (LHX), Lockheed Martin Corporation (LMT), Huntington Ingalls Industries, Inc. (HII), Virgin Galactic Holdings, Inc. (SPCE)
https://www.fool.com/investing/2023/12/21/is-rtx-an-excellent-dividend-stock-to-buy-for-2024/
https://seekingalpha.com/article/4659803-rtx-corporation-grounded-as-sp500-has-rocketed-higher
https://seekingalpha.com/article/4660339-rtx-hone-in-on-value-2024
https://seekingalpha.com/article/4660395-rtx-corporation-viable-undervalued-dividend-play
https://seekingalpha.com/article/4660588-6-top-long-term-stocks-on-my-2024-wishlist
https://www.fool.com/investing/2024/01/08/why-rtx-stock-fell-in-2023/
https://www.fool.com/investing/2024/01/14/why-is-europe-buying-940-raytheon-stinger-missiles/
https://www.fool.com/investing/2024/01/17/is-rtx-corporation-stock-a-buy/
https://www.fool.com/investing/2024/01/22/rtx-stock-buy-sell-or-hold/
https://www.proactiveinvestors.com/companies/news/1039158?SNAPI
https://www.fool.com/investing/2024/01/23/why-rtx-stock-jumped-8-today/
https://seekingalpha.com/article/4664437-rtx-corporation-rtx-q4-2023-earnings-call-transcript
https://www.sec.gov/Archives/edgar/data/101829/000010182923000037/rtx-20230930.htm
Copyright © 2024 Tiny Computers (email@tinycomputers.io)
Report ID: 2WYQ57
Cost: $1.03197
https://reports.tinycomputers.io/RTX/RTX-2024-02-03.html Home