Huntington Bancshares Incorporated (ticker: HBAN)
2024-02-11
 Huntington Bancshares Incorporated (ticker: HBAN) operates as a diversified regional bank holding company primarily serving individuals and small-to-medium-sized businesses throughout the Midwest. With its headquarters located in Columbus, Ohio, Huntington has expanded its presence significantly through strategic acquisitions, thereby bolstering its service offerings that include commercial, retail, wealth management, and mortgage banking services. As of the latest data, Huntington operates hundreds of branches and ATMs, offering a wide array of banking products and services designed to cater to the evolving needs of its customer base. The company's dedication to innovation and customer service, coupled with a robust regional footprint, positions it favorably within the competitive banking sector. HBANs focus on sustainable growth and operational efficiency has also been instrumental in driving shareholder value, even amidst economic fluctuations. With a solid balance sheet, Huntington Bancshares Incorporated continues to navigate the complexities of the financial industry while targeting strategic opportunities for expansion and improved profitability.
| City | Columbus | State | OH | Employees | 19,612 |
| CEO Pay | $4,984,987 | CFO Pay | $2,130,519 | Technology Officer Pay | $2,096,144 |
| Commercial Banking Pay | $1,898,119 | Consumer Banking Pay | $2,462,574 | Dividend Rate | 0.62 |
| Dividend Yield | 0.05 | Payout Ratio | 0.5 | Beta | 1.128 |
| Volume | 14,115,658 | Market Cap | $17,973,651,456 | Profit Margins | 0.2804 |
| Shares Outstanding | 1,448,320,000 | Book Value | 11.709 | Price to Book | 1.0598685 |
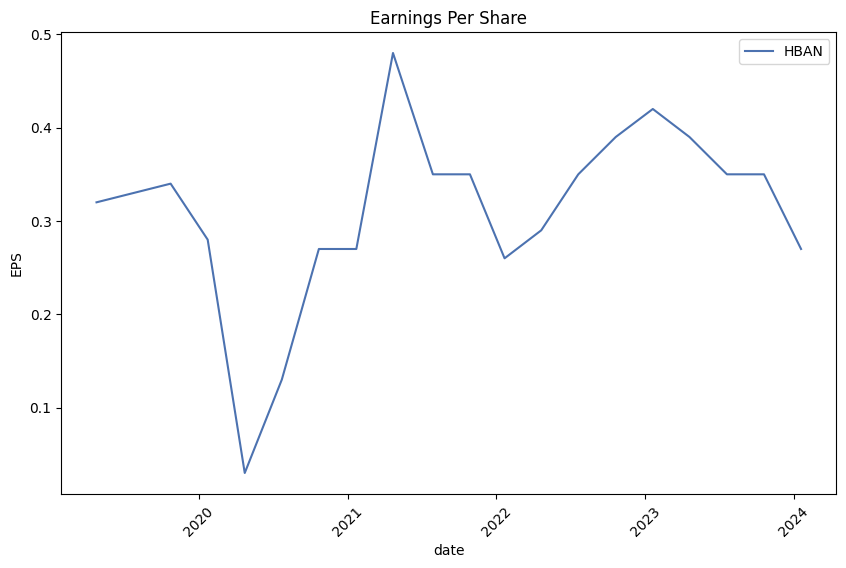
| Net Income | $1,816,999,936 | Trailing EPS | 1.24 | Forward EPS | 1.38 |
| Total Cash | $10,448,000,000 | Total Debt | $13,013,999,616 | Total Revenue | $6,958,000,128 |
| Return on Assets | 0.01059 | Return on Equity | 0.10606 | Operating Margins | 0.31661 |
| Statistic Name | Statistic Value | Statistic Name | Statistic Value |
| Sharpe Ratio | -0.3631429280510004 | Sortino Ratio | -5.343086823073096 |
| Treynor Ratio | -0.08708800223643216 | Calmar Ratio | -0.38375453469020226 |
Analyzing the provided data in terms of technical analysis, fundamentals, balance sheet, cash flows, analyst expectations, and risk-adjusted performance ratios, we can infer the possible future movement of HBAN's stock price over the next few months.
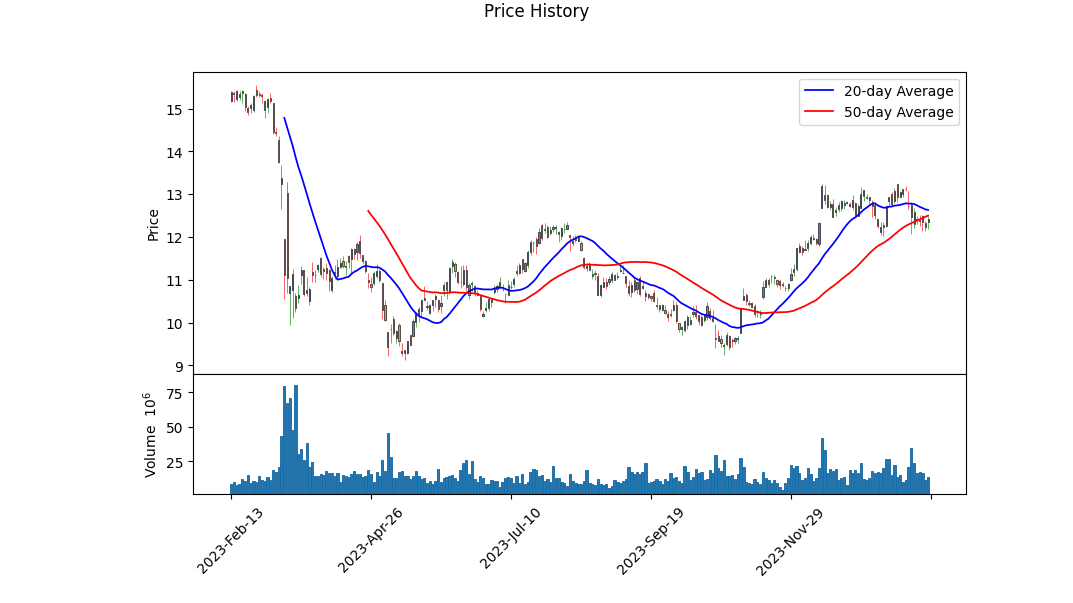
Technical Analysis: - The Opening and Closing prices show volatility, suggesting market indecision. Despite this, there's a noticeable upward trend with the closing price at 12.35 on the last day, compared to the opening price of 10.07 a few months before. - The MACD histogram value towards the end of the period being negative and decreasing indicates a bearish momentum, which could hint at a potential pullback or consolidation in the short term.
Fundamental Analysis: - There's a notable decline in earnings growth and revenue growth, which are typically bearish indicators for stock sentiment. However, the operating margins remain relatively healthy. - Further, analyst expectations show optimism for the next year, with a projected earnings increase and sales growth estimation, which could underpin future stock performance positively.
Risk-Adjusted Performance Ratios: - Negative values across Sharpe, Sortino, Treynor, and Calmar ratios indicate that the stock has not performed well relative to the risk-free rate, with potentially more risk or volatility than might be preferable. These metrics suggest that the investment carries significant risk relative to its returns over the past year.
Balance Sheet and Cash Flows: - The balance sheet shows a robust figure in total assets and retained earnings, which is a positive sign for the company's financial health. - The sharp increase in debt issuance offset by debt repayment on the cash flow statement signifies active capital management. The increase in free cash flow is a positive indicator of financial health and operational efficiency.
Analyst Expectations and Growth Estimates: - Analysts have a positive outlook in terms of revenue and EPS for the next year, showing confidence in the companys potential for growth. - Growth estimates, however, show a mixed picture with a significant decline expected in the current quarter and year but a recovery anticipated for the next year.
Given the blend of positive and negative indicators, HBAN's stock price over the coming months is likely to exhibit a mix of volatility and potential upside. The technical indicators suggest short-term pressure, whereas fundamentals, analyst sentiment, and improvements in cash flows could provide a cushion to the downside risks. Expect some consolidation in the near term, potentially setting the stage for gradual upwards momentum driven by solid operational performance and market sentiment aligning with the analysts positive outlook for the coming year.
Investors should hence brace for some volatility but could see this as an opportunity to engage with a fundamentally strong company at potentially lower price points. The mixed signals from risk-adjusted performance ratios indicate that while past performance may have been underwhelming when considering the taken risks, the forward-looking indicators give a reason for cautious optimism.
In our analysis of Huntington Bancshares Incorporated (HBAN) through the lens of the methodologies espoused in "The Little Book That Still Beats the Market," we have derived two key metrics to assess the company's financial health and investment potential: Return on Capital (ROC) and Earnings Yield. The Return on Capital (ROC) for HBAN stands at 2.096705440009147%. This ROC indicates the efficiency at which the company converts its capital into profits; in the case of HBAN, the figure suggests a modest level of efficiency relative to the capital employed. On the other hand, the Earnings Yield for HBAN is calculated to be 17.7276390008058%. Earnings yield, which is the inverse of the Price-to-Earnings (P/E) ratio, is a significant indicator of the potential return on investment. A higher earnings yield, as seen with HBAN, suggests that the company might be undervalued or that it is generating substantial earnings compared to its share price, highlighting a potentially attractive investment opportunity. Combined, these metrics provide a mixed yet insightful perspective into HBAN's operational efficiency and market valuation, offering a foundational analysis for investment decisions.
| Statistic Name | Statistic Value |
| R-squared | 0.389 |
| Adj. R-squared | 0.388 |
| F-statistic | 798.2 |
| Prob(F-statistic) | 2.68e-136 |
| Log-Likelihood | -2657.5 |
| No. Observations | 1256 |
| AIC | 5319. |
| BIC | 5329. |
| const coef | -0.0328 |
| beta | 1.2160 |
| std err | 0.057 |
| t | 28.252 |
| P>|t| | 0.000 |
| [0.025 | 1.132 |
| 0.975] | 1.300 |
| Omnibus | 226.297 |
| Durbin-Watson | 1.916 |
| Jarque-Bera (JB) | 4880.946 |
| Skew | -0.028 |
| Prob(JB) | 0.00 |
| Kurtosis | 12.657 |
| Cond. No. | 1.32 |
The linear regression model analyzing the relationship between HBAN (Huntington Bancshares Incorporated) and SPY (SPDR S&P 500 ETF Trust), a proxy for the overall market, reveals significant insights into how HBANs performance is influenced by market movements. The coefficient (beta) value of 1.2160 signals a positive and relatively strong relationship between the movements of HBAN and the broader market as represented by SPY. This suggests that for every 1% change in the SPY, HBAN is expected to change by approximately 1.22%. The positive beta coefficient points towards a direct relationship where HBAN tends to move in alignment with the market. However, the value of alpha, which is -0.0328, indicates underperformance relative to the risk-free rate when accounting for market movements. In essence, this negative alpha suggests that HBAN, after adjusting for market movements, offers a slightly lower return than what would be expected, underlining a potential area of concern for investors focusing on outperformance relative to market risk.
The statistical significance of the model is underscored by an F-statistic of 798.2 and a corresponding p-value effectively at 0, which rejects the null hypothesis that HBANs returns are not related to the markets returns. Despite this, the models R-squared value of 0.389 indicates that approximately 38.9% of the variability in HBANs returns can be explained by the movements in the SPY, implying that other factors outside the market's performance play a significant role in influencing HBANs returns. This level of explained variance highlights the importance of considering both market-based and firm-specific factors when analyzing HBAN's performance. Additionally, the models adjusted R-squared value of 0.388 closely mirrors the R-squared value, indicating a high degree of confidence in the models explanatory power when considering the sample size and number of predictors.
Huntington Bancshares Incorporated held its 2023 Fourth Quarter Earnings Review, announcing strong results and outlining strategic growth initiatives. Chairman, President, and CEO Steve Steinour, along with CFO Zach Wasserman and Chief Credit Officer Brendan Lawlor, highlighted the bank's performance against a challenging backdrop, including the achievement of over $3 billion of deposit growth and a $2.5 billion increase in loans. The bank's efforts in acquiring new customers, managing deposit beta effectively, and expanding into new markets were emphasized as key factors in its outperformance.
Huntington's focus on strategic investments, particularly in commercial banking and regional expansion, underpins its resilience and anticipation of continued growth into 2024 and beyond. The bank aims to leverage its position of strength to increase both deposits and loans, driving accelerated revenue growth supported by fee opportunities. Through diligent balance sheet management and hedging programs, Huntington is poised to navigate the changing macroeconomic environment, maintaining a moderate-to-low-risk appetite while capitalizing on the improving outlook for GDP growth.
CFO Zach Wasserman provided detailed financial performance insights, revealing GAAP earnings and adjustments due to notable items such as the FDIC special assessment. Deposits showed a trend of growth with a stabilizing non-interest bearing mix, while loan balances saw an increase. Wasserman outlined the bank's strategic actions to manage net interest margins (NIM) and the impact of rate changes. He anticipates a trough in net interest income for the first quarter of 2024, but expects sequential expansion over the year. Expenses are forecasted to increase modestly alongside core expense adjustments, reflecting strategic investments and efficiency initiatives.
During the Q&A session, discussions included the bank's loan growth outlook, expense guidance, deposit beta management in the context of rate cuts, and commercial credit quality. The bank's strategic positioning and risk management approach underscore its preparedness for potential economic scenarios. Huntington's executives expressed confidence in their growth strategy, emphasizing the role of disciplined execution and strategic investments in driving future performance. The bank remains steadfast in its commitment to expanding its customer base, improving financial metrics, and solidifying its standing as a strong regional bank.
Huntington Bancshares Incorporated (HBAN), in its SEC 10-Q filing for the quarter ending September 30, 2023, presents a comprehensive overview of its financial position and operations. The report, meticulously compiled to provide shareholders, potential investors, and regulatory bodies with a clear picture of HBAN's performance, includes a variety of financial data and performance metrics that highlight both the successes and the challenges faced by the company during the period.
The document outlines several key financial statements, including the balance sheet, income statement, and cash flow statement for the quarter. These statements offer a detailed look at the company's financial health, revealing its assets, liabilities, revenue generation, operational expenses, and net income. A notable point of interest is the company's net income which is a critical indicator of its profitability during the quarter, reflecting the culmination of its operational efficiency, cost management, and revenue generation capabilities.
HBAN's 10-Q filing also delves into the specifics of its operational segments, analyzing the performance and contributions of each to the overall business. This segmentation allows for a deeper understanding of which areas of the business are thriving and which may require strategic adjustments. Such granularity in reporting facilitates a better grasp of the company's operations, enabling stakeholders to make informed decisions based on the performance of individual business units.
An essential component of the filing is the comprehensive analysis of the company's loan portfolios, investment holdings, and detailed breakdowns of assets and liabilities. This includes categories such as commercial and industrial loans, residential mortgages, and consumer loans among others. The reporting on the quality of the loan portfolio, including past due loans and provisioning for credit losses, provides insight into the risk management practices and financial health of the bank. Additionally, the document reports on the fair value measurements of various financial instruments, offering a perspective on the bank's investment strategies and their market responsiveness.
Moreover, HBAN's filing includes detailed notes on accounting policies and practices, ensuring transparency in how financial transactions and events are recognized, measured, and reported. This serves to build trust with investors and compliance with regulatory standards.
Overall, Huntington Bancshares Incorporateds SEC 10-Q filing for the quarter ending September 30, 2023, serves as a pivotal document that encapsulates the company's financial trajectory, operational efficiencies, risk management practices, and strategic positioning within the competitive banking landscape. The in-depth analysis provided within the report underscores HBAN's commitment to transparency, regulatory compliance, and shareholder communication, while also offering a scaffold upon which future strategic decisions can be made.
Huntington Bancshares Incorporated has recently been the focus of significant attention within the financial community, driven by a series of strategic initiatives aimed at bolstering its financial stability amid a challenging banking environment. The company, renowned for its comprehensive financial services ranging from retail banking to wealth management, has taken proactive steps to navigate through the shifts and challenges confronting the banking sector.
In a detailed analysis, it's apparent that Huntington has responded to the unstable banking landscape with a mix of sophistication and strategic foresight. Amidst the financial turmoil reminiscent of the 2008 crisis, which saw several bank failures, including high-profile cases like Silicon Valley Bank, Huntington implemented measures to safeguard its operational integrity. The bank's decision to close a pay-fixed swaption hedge established during this tumultuous period underscores a strategic response to the evolving interest rate environment. This move, costing the bank $24 million, reflects a cautious optimism, banking on steady interest rates and the growing likelihood of cuts in 2024, thereby mitigating potential financial strain.
Further bolstering its financial framework, Huntington executed a synthetic credit risk transfer transaction pertaining to $3 billion in prime indirect auto loans. This strategic maneuver aimed at risk mitigation and capital ratio enhancement underscores the bank's commitment to maintaining a strong balance sheet. By reducing its risk-weighted assets by approximately $2.4 billion, Huntington effectively improved its Common Equity Tier 1 (CET1) ratio, a critical measure of a bank's financial strength.
Huntington's financial prudence extends to its preparation for the Federal Deposit Insurance Corporation's (FDIC) Deposit Insurance Fund Special Assessment. The bank's contribution of $214 million to this assessment exemplifies its strategic fiscal planning, further solidifying its capital ratios and manifesting resilience against industry-wide pressures.
Throughout these strategic financial adjustments, Huntington has maintained an attractive proposition for investors. With a dividend yield of 4.8% and a modest payout ratio, the bank has showcased its commitment to shareholder returns even amid market volatility. The strategic financial management, coupled with a forward-looking approach to banking challenges, positions Huntington as a bank geared toward sustainable growth and stability.
Beyond financial maneuvers, Huntington's engagement with the regulatory and economic landscape offers additional insights into its strategic positioning. At the Worldwide Economic Forum in Davos, Stephen Steinour, Chairman, President, and CEO of Huntington, provided valuable perspectives on interest rate adjustments and their implications for the banking sector. The forecasted three to four rate cuts, contingent on economic data, underscores a cautiously optimistic outlook, differing from the market speculation of six to seven cuts.
This pragmatic approach to interest rate expectations aligns with Huntington's broader operational strategy. Despite a slight earnings beat but a revenue miss, the bank has shown resilience by pursuing growth in its loan portfolio, emphasizing customer support, and navigating unforeseen regulatory costs with strategic acumen. The banks adaptability in adjusting to dynamic market conditions, managing deposit and loan segments effectively, and upholding strong credit management practices, underscores its robust operational strategy.
Huntington Bancshares' strategic initiatives, from financial hedging to regulatory preparation and beyond, demonstrate a comprehensive approach to navigating the complexities of the current banking environment. Despite facing macroeconomic uncertainty and regulatory challenges, the bank's forward-looking strategies, coupled with its commitment to solid financial management, suggest a positive trajectory as it continues to adapt to and anticipate future financial landscapes and regulatory requirements.
The volatility of Huntington Bancshares Incorporated (HBAN) from February 2019 to February 2024 shows no direct relationship between its returns and other market variables, as indicated by an R-squared of 0.000. The model identifies significant volatility in HBAN's returns, with an omega coefficient of 3.7622 suggesting a high base level of volatility and an alpha of 0.5270 pointing towards substantial impacts from past squared shocks on current volatility. This implies that HBAN's stock was prone to wide fluctuations, likely responding heavily to market events or company-specific news.
| Statistic Name | Statistic Value |
|---|---|
| Mean Model | Zero Mean |
| Vol Model | ARCH |
| Log-Likelihood | -2867.40 |
| AIC | 5738.80 |
| BIC | 5749.07 |
| No. Observations | 1,256 |
| omega | 3.7622 |
| alpha[1] | 0.5270 |
The financial risk associated with a $10,000 investment in Huntington Bancshares Incorporated (HBAN) over a one-year period can be analyzed comprehensively using a dual approach that integrates volatility modeling with machine learning predictions. These methodologies, when combined, offer a robust framework for assessing the potential fluctuations in the investment's value, thereby providing investors with a clearer understanding of the risks involved.
Volatility modeling serves as a fundamental tool in understanding the behavior of Huntington Bancshares Incorporated's stock volatility. This technique is particularly adept at capturing the persistence of financial market volatility, allowing for a more accurate estimation of future variance based on past data. By fitting the stock's historical returns to the volatility model, we can simulate the potential variance of returns over the upcoming year. This step is crucial as it helps in identifying periods of increased risk that could affect the investment's value.
On the other hand, the integration of machine learning predictions plays a pivotal role in forecasting future returns of the stock. Specifically, these predictions utilize historical data and identify patterns that may not be immediately apparent through traditional analysis. By employing an ensemble learning technique, which aggregates multiple predictions to improve upon the accuracy of single forecast models, the approach is fine-tuned to predict the stock's future price movements. This predictive power, when combined with the insights from the volatility model, offers a comprehensive view of both the expected returns and the range within which those returns may vary.
When focusing on the results, particularly the Annual Value at Risk (VaR) at a 95% confidence level, we find a calculated VaR of $389.39 for a $10,000 investment. This figure represents the maximum expected loss over a one-year period with a 95% confidence level, derived from the integrated approach of volatility modeling and machine learning predictions. The VaR is a crucial metric in risk management as it quantifies the extent of potential loss, factoring in both the expected stock volatility and the forecasted returns. It therefore serves as a vital indicator for investors, highlighting the potential downside risk of the investment.
Through this multifaceted analysis, leveraging both volatility modeling and machine learning predictions, investors can gain a nuanced understanding of the financial risks associated with investing in Huntington Bancshares Incorporated. The calculated VaR, in particular, provides a quantitative basis for evaluating whether the potential risks align with the investor's risk tolerance and investment strategy. This integrated approach exemplifies the effectiveness of combining detailed volatility analysis with advanced predictive techniques in assessing equity investment risks.
In analyzing the options chain for Huntington Bancshares Incorporated (HBAN) with a focus on call options and considering a target stock price increase of 5% over the current stock price, we must delve into "the Greeks" to uncover the most profitable options available. The GreeksDelta, Gamma, Vega, Theta, and Rhoplay a crucial role in understanding how the price of an option is affected by various factors.
Starting with options that have a short expiry period (4 days to expire on February 16, 2024), we notice a few intriguing choices. For instance, an option with a strike price of $9 stands out with a Delta of 0.875, Gamma of 0.05099, and Vega of 0.2662, indicating a strong sensitivity to the stock's price movement and volatilitythe options price is likely to increase significantly with slight movements in HBAN's stock price. Despite a Theta of -0.1023, hinting at time decay, its high Return on Investment (ROI) of 0.2104 signals a potentially profitable short-term investment if the stock achieves the target price increase.
For options with a medium-term horizon, expiring on April 19, 2024, with 67 days to expiry, an option with a strike price of $6 emerges as particularly appealing. It boasts a Delta of 0.9154, clearly indicating that the option's price is likely to move almost in tandem with the stocks price. Coupled with a substantial Vega of 0.7544, it benefits significantly from volatility. Its ROI of 0.2554 is remarkable, suggesting it as a strong contender for investors targeting a medium-term horizon.
Looking further ahead, an option expiring on July 19, 2024, with a strike price of $10 shows potential for considerable gains. With 158 days to expiry, it possesses a Delta of 0.7995 and an impressive Vega of 2.1184, indicating high sensitivity to changes in volatility. This option's ROI of 0.2627 further underscores its appeal for investors with a longer-term focus, assuming the stock meets the targeted price increase.
For those contemplating even longer-term investments, options expiring on January 17, 2025, offer intriguing prospects. An option with a strike price of $8, showing a Delta of 0.8302, stands out. Its exceptionally high Vega of 2.4211 means it benefits greatly from an increase in implied volatility. With an ROI of 0.0936 over 340 days until expiry, it presents a significant opportunity for profit if the stock price maneuvers favorably over the longer term.
Finally, considering options with a very long horizon, expiring on January 16, 2026, an option with a strike price of $5 shows a balanced profile with a Delta of 0.8458 and a very high Vega of 2.0665. An ROI of 0.1588, combined with its long expiry, provides a strategic choice for investors betting on a significant move in the underlying stock over an extended period.
In summary, while each investor's risk tolerance and investment horizon vary, these selected options depict a range of opportunities from short to very long-term investments in Huntington Bancshares Incorporated. The key to maximizing profits lies in balancing the Greeks to match one's forecasted stock price movement and volatility expectations.
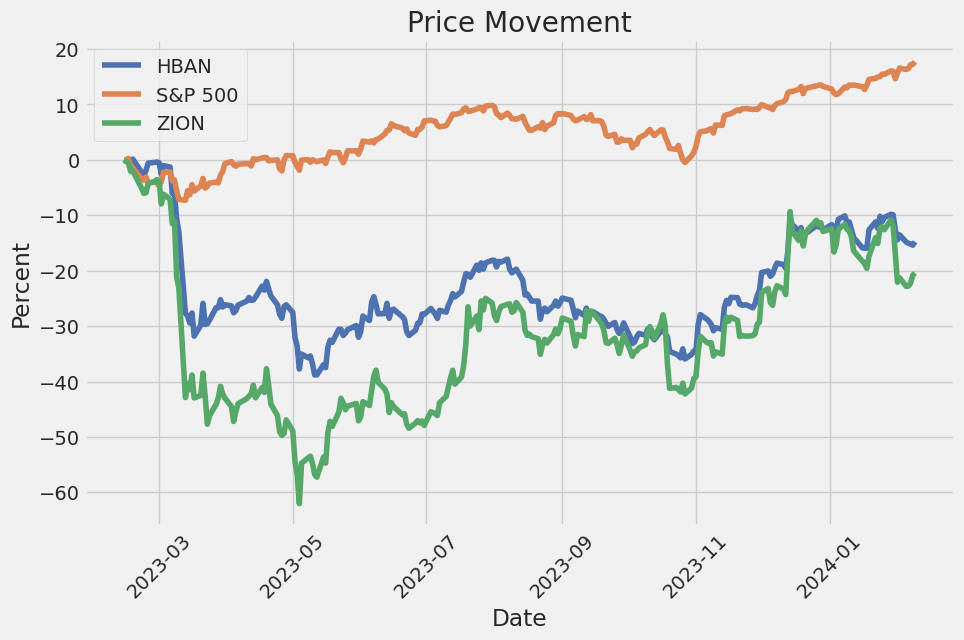
Similar Companies in BanksRegional:
Zions Bancorporation, National Association (ZION), Comerica Incorporated (CMA), Western Alliance Bancorporation (WAL), U.S. Bancorp (USB), KeyCorp (KEY), Report: The PNC Financial Services Group, Inc. (PNC), The PNC Financial Services Group, Inc. (PNC), Report: Regions Financial Corporation (RF), Regions Financial Corporation (RF), Report: Fifth Third Bancorp (FITB), Fifth Third Bancorp (FITB), M&T Bank Corporation (MTB), Citizens Financial Group, Inc. (CFG), First Horizon Corporation (FHN), Truist Financial Corporation (TFC)
https://www.fool.com/investing/2024/01/05/this-high-yield-dividend-stock-is-getting-stronger/
https://www.youtube.com/watch?v=2z6xFIRoY_k
https://finance.yahoo.com/news/huntington-hban-q4-earnings-beat-163900315.html
https://finance.yahoo.com/news/1-huntington-bancshares-profit-falls-190822322.html
https://www.youtube.com/watch?v=FH-kQ0swxHY
https://finance.yahoo.com/news/huntington-bancshares-incorporated-declares-quarterly-213000672.html
https://finance.yahoo.com/news/q4-2023-huntington-bancshares-inc-071108879.html
https://finance.yahoo.com/news/huntington-bancshares-full-2023-earnings-135308224.html
https://finance.yahoo.com/news/huntington-bancshares-incorporated-nasdaq-hban-134145480.html
https://finance.yahoo.com/news/capstone-partners-imap-release-2023-153000250.html
https://finance.yahoo.com/news/capstone-partners-strengthens-industry-coverage-150000758.html
https://www.sec.gov/Archives/edgar/data/49196/000004919623000097/hban-20230930.htm
Copyright © 2024 Tiny Computers (email@tinycomputers.io)
Report ID: KN5SQr
Cost: $0.76825
https://reports.tinycomputers.io/HBAN/HBAN-2024-02-11.html Home