Invesco QQQ Trust (ticker: QQQ)
2024-02-06
 The Invesco QQQ Trust, known by its ticker QQQ, represents an exchange-traded fund (ETF) that offers investors broad exposure to the Nasdaq-100 Index. This index includes 100 of the largest non-financial companies listed on the Nasdaq stock market, emphasizing sectors like technology, entertainment, biotechnology, and retail. Launched in March 1999, the QQQ has become one of the most popular and heavily traded ETFs in the United States, known for its liquidity and the significant growth potential of its constituent companies. The fund aims to replicate the performance of the Nasdaq-100 Index, minus expenses and fees, providing a straightforward way for investors to gain exposure to some of the most innovative and high-performing companies in the U.S., such as Apple, Amazon, Google's parent company Alphabet, and Microsoft. As with any investment, it's important for investors to consider the fund's objectives, risks, charges, and expenses before investing. The QQQ offers a blend of growth potential and sector diversity, making it a cornerstone investment for those looking to capitalize on the growth of major technology and non-financial firms in the American economy.
| Previous Close | 429.01 | Open | 429.07 | Day Low | 425.00 |
| Day High | 429.61 | Volume | 39,729,703 | Average Volume | 45,213,690 |
| Average Volume 10 days | 45,637,180 | Bid | 428.68 | Ask | 428.72 |
| Bid Size | 1,000 | Ask Size | 1,300 | Yield | 0.0062 |
| Total Assets | 229,965,266,944 | Fifty Two Week Low | 285.19 | Fifty Two Week High | 430.24 |
| Fifty Day Average | 405.3608 | Two Hundred Day Average | 370.90295 | Trailing Annual Dividend Rate | 1.77 |
| Trailing Annual Dividend Yield | 0.0041257776 | Nav Price | 429.3 | YTD Return | 0.0475923 |
| Three Year Average Return | 0.1009203 | Five Year Average Return | 0.2153342 | Trailing PE | 34.93732 |
| Sharpe Ratio | 1.9347148700182895 | Sortino Ratio | 31.71714065547799 |
| Treynor Ratio | 0.2639268311966345 | Calmar Ratio | 3.9215916550487475 |
The analysis of the Invesco QQQ Trust (QQQ), based on its recent technical indicators, fundamentals, and financial ratios, reveals important insights into its potential stock price movement in the coming months. The provided data outlines a clear trajectory in the stock's performance, incorporating information up to the last trading day.
Technical indicators exhibit a positive uptrend, as evidenced by the opening and closing price movements. A closer analysis of On-Balance Volume (OBV) shows a significant increase, suggesting a strong buyer interest and potential for price appreciation. However, the MACD histogram values toward the end of the dataset indicate some volatility, with slight fluctuations in momentum.
The evaluation of the Sharpe, Sortino, Treynor, and Calmar ratios provides a deeper insight into the risk-adjusted performance of QQQ. A Sharpe ratio of 1.9347148700182895 signals that the investment return is relatively good in relation to its volatility, a positive signal for potential investors. The exceptionally high Sortino ratio of 31.71714065547799 further emphasizes that the ETF performs exceptionally well under upward market conditions, considering only the downside volatility. The Treynor ratio at 0.2639268311966345 suggests a moderate level of return when adjusted for systematic risk, whereas the Calmar ratio of 3.9215916550487475 indicates a strong performance against maximum drawdown, a reassuring signal for long-term investments.
Fundamental analysis reveals a strong underlying business performance, as indicated by a trailing PE of 34.93732, signifying a premium market valuation reflective of investor confidence and future growth expectations. The ETF's total assets and its consistent year-to-date return further highlight its solid market position and the financial robustness of the underlying portfolio. The assessment of average volumes and the bid-ask spread points towards a highly liquid ETF, conducive to favorable trading conditions.
Furthermore, analyst expectations underscore a promising outlook, with a notable net asset value (NAV) and an encouraging daily total year-to-date return. The low expense ratio indicates efficiency in management, translating into better net returns for the investors.
Taking into account the comprehensive data, the projections for QQQ's stock price movement in the next few months look optimistic. The technical indicators, combined with the ETF's strong fundamentals and outstanding risk-adjusted return ratios, suggest a continuing upward trend. However, investors must be wary of potential volatility and market-wide economic factors that could influence the trajectory. The combination of a solid foundation in the ETF's fundamental data and robust technical performance positions QQQ as a potentially lucrative investment for those seeking growth in a large growth category, keeping in mind the inherent risks and market dynamics.
In the context of the principles outlined in "The Little Book That Still Beats the Market," it's essential to analyze both the Return on Capital (ROC) and the Earnings Yield for investment opportunities to determine their potential for outperforming the market. For Invesco QQQ Trust (QQQ), applying these specific metrics directly encounters some limitations, as QQQ is not a conventional company but an exchange-traded fund (ETF) that tracks the Nasdaq-100 Index, comprising 100 of the largest non-financial companies listed on the Nasdaq stock market. Therefore, traditional measures such as ROC and Earnings Yield, typically calculated for individual companies to assess their profitability and valuation, respectively, do not directly apply to QQQ in the traditional sense used within "The Little Book That Still Beats the Market."
Instead, investors interested in QQQ might evaluate the fund's performance, the aggregate earnings yield, and possibly an averaged or weighted return on capital of its holdings, acknowledging that these figures would provide a broader market overview rather than the performance metrics of a single entity. Given this, it's crucial to adjust our analysis to focus on the portfolio's overall characteristics, growth potential, sector allocations, and historical performance, alongside traditional valuation measures applied to its composite companies, to gauge QQQ's attractiveness and potential fit within a diversified investment strategy.
Without specific ROC and Earnings Yield values for QQQ, investors should look at alternative metrics such as the ETF's price-to-earnings (P/E) ratio, price-to-book (P/B) ratio, and overall market performance trends of the Nasdaq-100 Index. This approach aligns more closely with evaluating a collective investment vehicle rather than a single business entity, offering insight into the investment potential of QQQ within the framework of the market-beating strategies proposed by Joel Greenblatt in his influential work.
| Statistic Name | Statistic Value |
| Alpha | 0.0192 |
| Beta | 1.1255 |
| R-squared | 0.867 |
| Adj. R-squared | 0.866 |
| F-statistic | 8144 |
| Prob (F-statistic) | 0.00 |
| Log-Likelihood | -1102.0 |
| No. Observations | 1256 |
| AIC | 2208 |
| BIC | 2218 |
| Omnibus | 103.312 |
| Durbin-Watson | 1.948 |
| Prob(Omnibus) | 0.000 |
| Jarque-Bera (JB) | 512.825 |
| Skew | -0.175 |
| Kurtosis | 6.111 |
| Cond. No. | 1.32 |
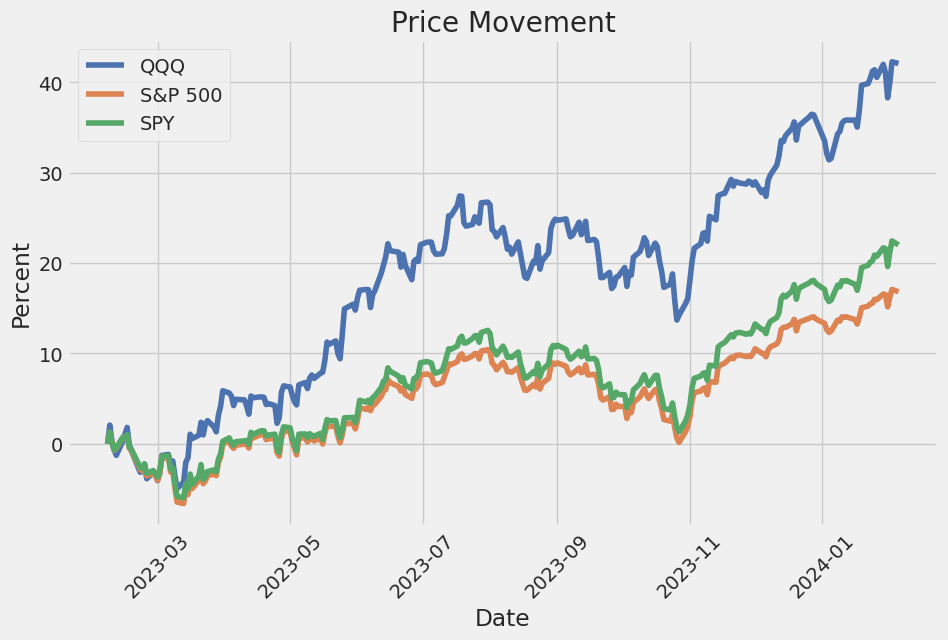
Analyzing the linear regression model that predicts the relationship between QQQ and SPY, which represents the overall market, we observe a beta coefficient (slope) of 1.1255. This indicates that for every one-percent increase in SPY, QQQ is expected to increase by approximately 1.1255 percent, highlighting the sensitivity of QQQ to changes in the overall market. The model's alpha, which stands at 0.0192, suggests that QQQ has a slight positive performance offset compared to SPY irrespective of the market's movement. This alpha value, albeit small, indicates an average outperformance against the benchmark SPY.
The model showcases a strong relation between QQQ and SPY with an R-squared value of 0.867, revealing that approximately 86.7% of QQQs movements can be explained by the movements in SPY. This high degree of correlation underscores the influence of overall market trends on QQQ, reinforcing why investors often scrutinize broader market indicators when assessing tech-heavy portfolios like the QQQ. Despite the statistically significant beta, the alpha indicates an additional level of performance potentially attributed to specific factors affecting stocks within the QQQ outside of the general market movements represented by SPY.
As the Invesco QQQ Trust (QQQ) garners attention for its anticipated performance in 2024, investors are closely analyzing its constituency and market position relative to other major investment vehicles and economic indicators. The QQQ, which tracks the NASDAQ-100 Index, is a preferred choice for investors seeking exposure to top non-financial firms driven by technological innovation and growth. Its attraction lies in encapsulating a segment of the economy that is often at the forefront of cutting-edge developments, particularly in the realms of AI, biotech, and digital services.
A fundamental aspect of QQQ's allure is its significant exposure to the leading lights of the technology and consumer discretionary sectors. As global economies pivot more toward digital solutions and innovation, companies within these sectors are poised for growth, enhancing QQQ's potential for positive returns. The inclusion of blue-chip tech giants provides a mix of stability and growth potential, making QQQ a unique proposition for investors.
| company | symbol | percent |
|---|---|---|
| Apple Inc | AAPL | 9.22 |
| Microsoft Corp | MSFT | 8.61 |
| Amazon.com Inc | AMZN | 4.83 |
| Broadcom Inc | AVGO | 4.15 |
| Meta Platforms Inc Class A | META | 3.85 |
| NVIDIA Corp | NVDA | 3.77 |
| Tesla Inc | TSLA | 3.68 |
| Alphabet Inc Class A | GOOGL | 2.55 |
| Alphabet Inc Class C | GOOG | 2.48 |
| Costco Wholesale Corp | COST | 2.32 |
The technological stance of QQQ's constituents underlines its appeal in a world increasingly dominated by digital innovation. For example, Apple and Microsoft not only boast large market capitalizations but also significant investments in research and development, positioning them at the vanguard of technological and digital advances. Similarly, companies like NVIDIA spearhead developments in AI and computing, reflecting sectoral trends that signal growth trajectories aligned with futuristic innovations.
However, investing in QQQ is not without its considerations. The tech-heavy focus introduces volatility, subject to market cycles and valuation pressures. Macroeconomic conditions, particularly those influencing interest rates and inflation, could disproportionately impact the growth-centric companies that dominate QQQ. Investive strategies should therefore include a thorough analysis of broader economic indicators and sector-specific trends to navigate the potential headwinds facing these industries.
Moreover, geopolitical developments continue to play a critical role in shaping market dynamics, with trade policies and international tensions potentially affecting the global operations of the QQQ constituents. Diversification within the portfolio, across sectors such as healthcare, consumer goods, and clean energy, provides a hedge against these uncertainties, underscoring the relevance of comprehensive market analysis in investment decision-making processes.
The resilience of the tech sector, as evidenced in the projected bullish outlooks, suggests an underlying confidence in the enduring value proposition of innovative companies. This confidence, juxtaposed against the backdrop of evolving consumer behaviors and digital transformations, positions QQQ as a pivotal player in investment strategies focused on long-term growth.
Investors drawn to QQQ are advised to maintain a focus on the long-term horizon, acknowledging the ebb and flow of market conditions while staying attuned to the structural shifts that favor innovation-driven markets. The performance of QQQ, particularly in the context of its top holdings and sectoral compositions, provides a lens through which market observers can gauge the evolving landscapes of growth, technology, and investment potential in the coming year.
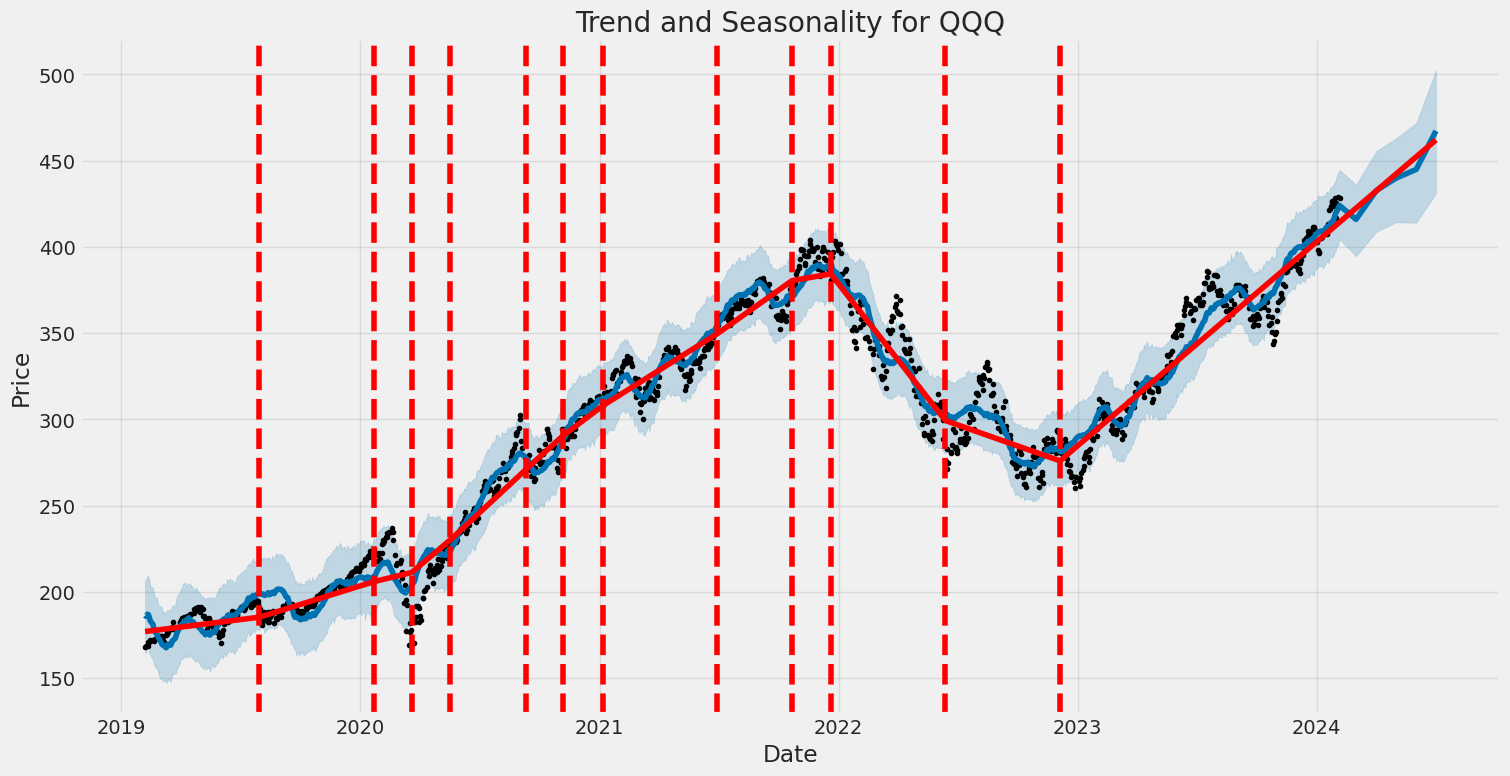
The volatility of the Invesco QQQ Trust (QQQ) from 2019 to 2024 demonstrates significant fluctuations. The data analyzed through the ARCH model reveals that the volatility is not constant over time but rather exhibits periods of higher and lower volatility, captured by the model's parameters. The key features of this volatility include the omega value, indicating the baseline volatility, and the alpha value, showing how much past returns impact current volatility.
| Statistic Name | Statistic Value |
|---|---|
| Mean Model | Zero Mean |
| Vol Model | ARCH |
| Log-Likelihood | -2286.92 |
| AIC | 4577.84 |
| BIC | 4588.12 |
| No. Observations | 1256 |
| omega | 1.7145 |
| alpha[1] | 0.3085 |
To understand the financial risk of a $10,000 investment in the Invesco QQQ Trust (QQQ) over a one-year period, a sophisticated analysis combining volatility modeling and machine learning predictions has been performed. This approach gives a holistic view of the investment's potential volatility and its expected future returns, which are crucial in assessing the financial risk involved.
Volatility modeling plays a pivotal role in this analysis. It focuses on understanding the past fluctuations in the price of Invesco QQQ Trust's stock to make inferences about future volatility. This model is particularly effective in financial markets due to their inherent time-varying volatility. By analyzing historical data, the model forecasts the level of variability in the stock's returns over time. This is essential in risk assessment as it helps in quantifying the extent to which an investment's return can deviate from its expected value, providing a gauge for the investment's risk.
In tandem with volatility modeling, machine learning predictions are employed to forecast future returns of the Invesco QQQ Trust stock. Specifically, a model that relies on decision trees to make predictions based on historical data is used. This approach is adept at handling non-linear relationships and interactions between variables without requiring them to be specified a priori. By analyzing historical price data and other relevant financial indicators, the model predicts the expected returns of the stock. These predictions are instrumental in understanding the potential upside or downside, thereby contributing significantly to the overall risk assessment.
The culmination of this analysis is the calculation of the Value at Risk (VaR) at a 95% confidence interval for a $10,000 investment in Invesco QQQ Trust. VaR is a widely used risk measure that estimates the maximum potential loss over a certain period, given normal market conditions, at a specified confidence level. In this case, the calculated VaR is $162.08. This figure represents the maximum estimated loss that the investment could encounter over a year, with a 95% level of confidence. It is derived from the combination of the stock's forecasted volatility and expected returns, taking into account the potential variations in stock price as indicated by the volatility modeling and machine learning predictions.
By integrating these two sophisticated analytical techniques, the analysis provides a comprehensive view of the potential risks involved in investing in the Invesco QQQ Trust. The calculated VaR offers a quantifiable risk metric that investors can use to assess whether the potential financial risk aligns with their investment goals and risk tolerance. This integration of volatility modeling with machine learning for future return predictions exemplifies a powerful approach to financial risk analysis, providing insights that are crucial for informed investment decisions.
Similar Companies in Investment Trusts/Mutual Funds:
SPDR S&P 500 ETF Trust (SPY), Vanguard 500 Index Fund (VOO), Report: NVIDIA Corporation (NVDA), NVIDIA Corporation (NVDA), SPDR Dow Jones Industrial Average ETF Trust (DIA), Report: McDonald's Corporation (MCD), McDonald's Corporation (MCD), iShares Russell 2000 ETF (IWM), Report: Vanguard Total Stock Market ETF (VTI), Vanguard Total Stock Market ETF (VTI)
https://seekingalpha.com/article/4659377-qqq-cautious-optimism-for-2024
https://seekingalpha.com/article/4659453-chaim-siegel-is-bullish-for-2024
https://www.fool.com/investing/2023/12/25/before-you-buy-the-invesco-qqq-trust-etf-here-are/
https://seekingalpha.com/article/4659851-tug-an-active-etf-that-aims-to-be-hedged-version-of-qqq
https://www.fool.com/investing/2023/12/27/dow-jones-hit-all-time-high-beat-nasdaq-2024/
https://www.etftrends.com/etf-education-channel/qqq-qqqm-epicenters-innovation/
https://seekingalpha.com/article/4660071-qqq-pumped-warned-by-bond-market
https://seekingalpha.com/article/4660544-2024-the-year-of-living-dangerously
https://www.etftrends.com/etf-education-channel/usual-suspects-could-ai-leaders-again-2024/
https://www.fool.com/investing/2024/01/03/this-invesco-qqq-etf-is-at-an-all-time-high-histor/
https://www.etftrends.com/etf-education-channel/tech-could-shine-again-2024-wealth-management-firm/
https://www.etftrends.com/etf-education-channel/sp-500-dow-nasdaq-since-2000-highs-december-2023/
Copyright © 2024 Tiny Computers (email@tinycomputers.io)
Report ID: KF5WQ3
Cost: $0.56283
https://reports.tinycomputers.io/QQQ/QQQ-2024-02-06.html Home