Semtech Corporation (ticker: SMTC)
2024-04-30
 Semtech Corporation, trading under the ticker symbol SMTC, is a prominent player in the semiconductor industry, renowned for developing and marketing a wide array of analog and mixed-signal semiconductor solutions. The company's product portfolio includes signal integrity products, protection devices, wireless and sensing products, and power and high-reliability products. These products find extensive applications in the communications, computing, consumer, and industrial markets. Semtech is distinguished for its commitment to innovation, particularly in the development of its LoRa technology, which is a leading platform in the rapidly expanding field of Internet of Things (IoT). The company's strategic emphasis on sustainability and IoT integration indicates its ongoing adaptation to the evolving demands of the technology landscape, which could pose potential growth opportunities in the emerging tech sectors. Headquartered in Camarillo, California, Semtech continues to leverage its extensive R&D capabilities to maintain a competitive edge in the semiconductor space.
| Full Time Employees | 1,917 | Previous Close | 37.05 | Market Cap | 2,429,928,448 |
| Day Low | 36.53 | Day High | 38.45 | Volume | 2,763,493 |
| Bid | 37.48 | Ask | 37.72 | Bid Size | 800 |
| Ask Size | 900 | Fifty Two Week Low | 13.13 | Fifty Two Week High | 38.45 |
| Total Cash | 143,130,000 | EBITDA | 45,286,000 | Total Debt | 1,399,639,040 |
| Total Revenue | 868,758,016 | Revenue Per Share | 13.547 | Free Cash Flow | -28,315,376 |
| Sharpe Ratio | 1.3996229722853517 | Sortino Ratio | 23.589598438718212 |
| Treynor Ratio | 0.3528296420153225 | Calmar Ratio | 1.8718105386697703 |
Upon a detailed analysis of the company's technical, fundamental, and balance sheet data, a nuanced understanding of its market position and future stock movement emerges.
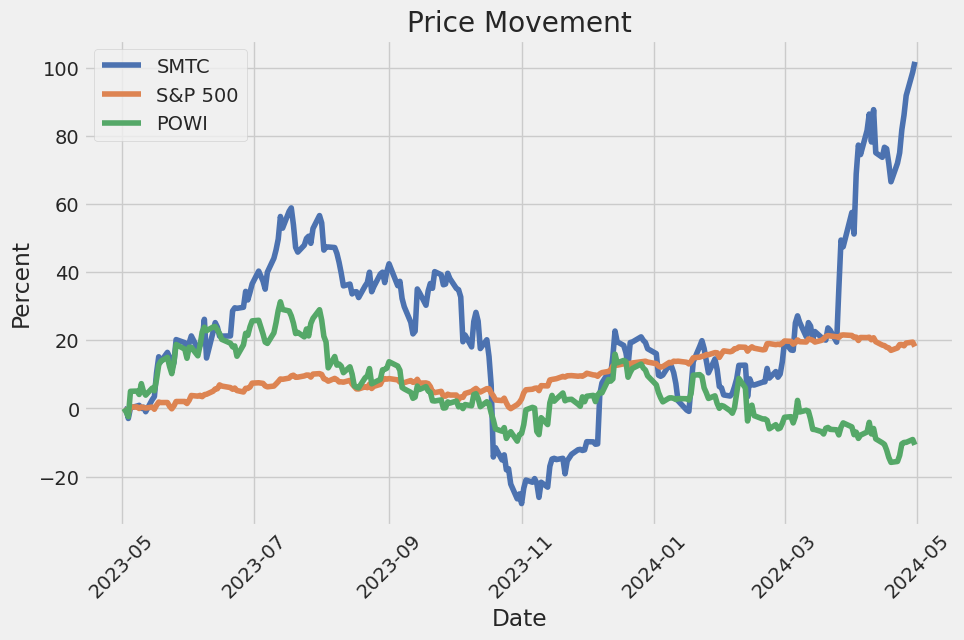
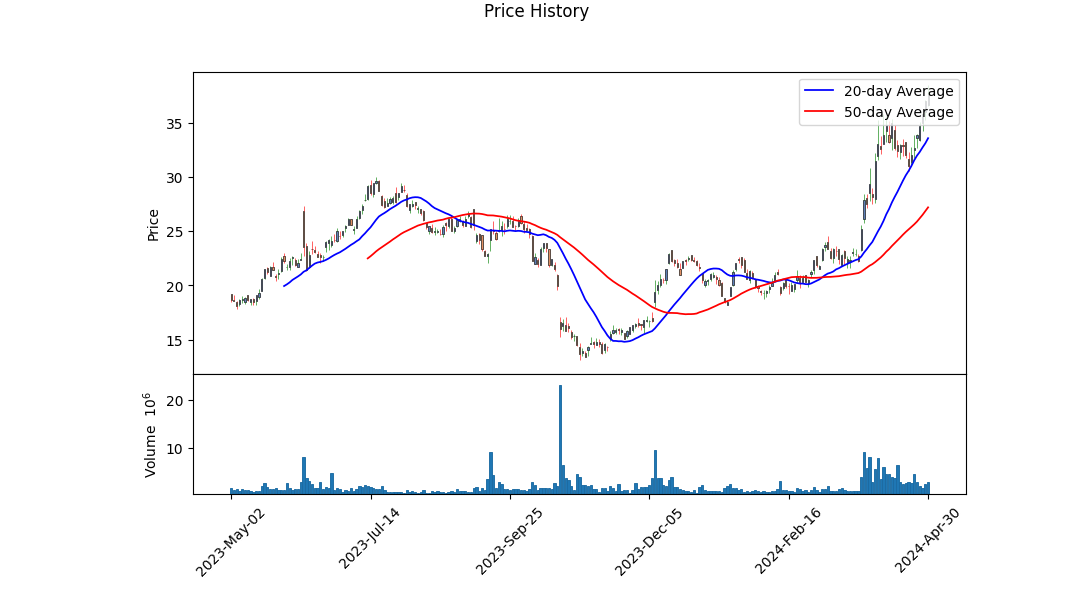
Technical Analysis Insights: The stock price shows significant momentum as indicated by the MACD Histogram turning positive towards the end of April, which is traditionally a bullish sign. The price has risen from around 20 to over 38 in a span of four months; this rapid increase suggests escalating investor confidence. This is validated by the OBV, which shows increasing volume on days when the stock price increased, a sign of strong buying pressure.
Fundamental and Balance Sheet Analysis: From the fundamental data, the firm displays a mixed financial condition. The EBITDA and operating margins being -0.02906 and 0.05213, respectively, indicate some challenges in operational efficiency and profitability. The recent heavy losses and steep rise in debt (from the Cash Flow and Balance Sheet summary) are concerning. Conversely, the revenue figures indicate a solid sales pipeline, which might be underpinning the stock's positive sentiment.
Risk-Adjusted Performance Metrics: - The Sharpe Ratio of 1.3996 suggests decent returns compared to the risk taken. - The Sortino Ratio at 23.5896, which focuses solely on downside volatility, portrays an even more favorable risk-return profile, suggesting recent returns have considerably compensated for the downside risks. - The Treynor Ratio of 0.3528, however, is somewhat moderate, implying that the market-adjusted return is not overly robust. - The Calmar Ratio of 1.8718 points to effective management of major drawdowns, further supporting investment consideration from a long-term perspective.
Given these observations, the stock appears to be on a bullish trajectory influenced by market sentiments that might have slightly run ahead of its fundamental valuations due to recent improvements or expectations of operational efficiences. However, investors should remain cautious and monitor the company's debt levels and ability to turn around its profitability metrics, which could play crucial roles in sustaining the stock price's uptrend. Redistributions and adjustments in the finance structure, particularly debt and interest-related cash flows, alongside operational metrics like gross margins and EBITDA, should be closely watched in the ensuing months.
Overall, assuming market conditions do not drastically change, the next few months could see continued stock appreciation but potentially at a moderated rate as the market begins to more finely scrutinize the balance between valuation and underlying financial health. Such analysis should be undertaken in a dynamic context, continuously integrating the latest financial releases and market conditions.
In analyzing Semtech Corporation (SMTC) using the methodologies outlined in "The Little Book That Still Beats the Market," we calculated key financial metrics to understand the company's performance. The return on capital (ROC), which reflects how effectively a company generates profits from its capital, is currently -2.95%. This negative value indicates that the company's capital is not being used efficiently to generate profit, reflecting potential operational or competitive challenges. Additionally, the earnings yield, which measures the profits generated for each dollar of investment, stands at -45.27%. This extremely negative earnings yield suggests that the company is currently earning negative profits relative to its share price, implying significant financial distress or underlying issues in its business model or economic environment. These metrics are crucial for evaluating the company's fundamental attractiveness as an investment and suggest cautious consideration before investing in SMTC.
In analyzing Semtech Corporation (SMTC) through the lens of Benjamin Graham's value investing principles, we can assess how the company aligns with the criteria Graham considered important for investment decisions. Below is a detailed assessment based on the provided metrics:
1. Price-to-Earnings (P/E) Ratio:
- SMTC P/E Ratio: -7.99
- Industry P/E Ratio: 74.20
Graham favored stocks with low P/E ratios relative to industry standards, viewing them as potentially undervalued. SMTCs P/E ratio is negative, which generally implies that the company has been generating negative earnings. This is a concerning signal, as Graham highlighted the importance of positive earnings growth and stability. A negative P/E ratio would normally disqualify a stock from being considered under Graham's criteria, as it suggests a lack of profitability.
2. Price-to-Book (P/B) Ratio:
- SMTC P/B Ratio: 1.77
Graham sought companies with P/B ratios less than 1.5, ideally looking for those trading below their book value. SMTCs P/B ratio of 1.77 slightly exceeds this threshold, indicating the stock may not be priced as competitively as Graham would prefer. Typically, Graham might not consider this stock a strong candidate based on this criterion alone, although it isn't significantly over his preferred upper limit.
3. Debt-to-Equity Ratio:
- SMTC Debt-to-Equity Ratio: -4.55
Typically, Graham looked for companies with low debt-to-equity ratios as an indication of financial stability. However, a negative debt-to-equity ratio can suggest unusual financial structures or accounting anomalies and is generally atypical. This could require additional investigation to understand the negative value before making an informed investment decision based on Grahams traditional approach.
4. Current and Quick Ratios:
- SMTC Current Ratio: 2.46
- SMTC Quick Ratio: 2.46
Both the current ratio and quick ratio of SMTC are substantially above 1, which is Grahams minimum requirement to ensure financial stability and liquidity. These figures suggest that Semtech is well-positioned to cover its short-term liabilities with its short-term assets, aligning well with Grahams criteria on this aspect.
Conclusion:
While Semtech Corporation aligns well with Benjamin Grahams investment principles regarding liquidity ratios (current and quick ratios), it falls short in several critical areas such as the P/E ratio (due to its negativity suggesting profitability issues) and the P/B ratio (slightly above the preferred value). Moreover, the negative debt-to-equity ratio introduces additional complexities that require deeper analysis. Based on these observations, Semtech may not fully align with Graham's conservative value investing approach without further qualitative analysis and consideration of broader financial health and market conditions.Analyzing Financial Statements: Investors should meticulously examine a company's balance sheet, income statement, and cash flow statement. Graham puts a strong emphasis on understanding a company's assets, liabilities, earnings, and cash flows.
Intellectual rigor and critical analysis are paramount when assessing a business's financial health. At the core of this scrutiny lie three primary financial statements: the balance sheet, income statement, and cash flow statement. Each offers a unique perspective but, combined, provides an invaluable cross-sectional view of a company's financial solidity.
- Balance Sheet Analysis:
- Assets: Assessing current and non-current assets gives investors a clear picture of the company's resource allocation and potential for growth. Critical questions to ask include: What proportion of assets is tangible vs. intangible? Are the reported values of these assets reflective of current market conditions?
- Liabilities: Evaluating both current and long-term liabilities is crucial to understand the financial obligations and operational gearing. It is essential to calculate ratios such as the debt-to-equity ratio to gauge financial stability and risk.
-
Shareholder's Equity: This represents the net value of the company if all assets were liquidated and all debts paid. Understanding the changes in equity, such as new equity issuances or buybacks, helps investors understand the company's financial strategies and health over time.
-
Income Statement Analysis:
- Revenues and Profits: Beyond just the numbers, understanding the source of revenuewhether from core business activities or one-off eventsand the sustainability of these revenues is fundamental.
- Costs and Expenses: Breaking down the operational and non-operational expenses provides insights into the companys efficiency and spending habits.
-
Net Income: This final line item offers a summarized view of the company's profitability but should be dissected to identify non-recurring items or accounting anomalies that might distort the true economic performance.
-
Cash Flow Statement Analysis:
- Operational Activities: Cash generated from core business operations reflects the companys ability to sustainably convert profits into casha key indicator of financial health.
- Investment Activities: This section reveals the company's strategy towards capital expenditure, investments, and asset sales, providing insights into future growth avenues and asset utilization.
- Financing Activities: Analysis here includes changes in debt, equity, and dividends. The cash flows from financing activities indicate the companys strategy towards growth financing, capital distributions, and capital restructuring.
In summarizing, the comprehensive analysis of these financial statements should not overlook qualitative aspects such as market conditions, regulatory impacts, and macroeconomic factors. This holistic approach will equip investors with a robust framework for evaluating investment opportunities in alignment with the principles of Benjamin Graham's value investing philosophy.Dividend Record: Benjamin Graham valued the stability and reliability showcased by companies maintaining a consistent history of dividend payments. He believed a solid dividend record to be a good indicator of a company's financial health and its management's dedication to shareholder interests.
For instance, the company with the symbol 'SMTC' demonstrates a commitment to returning value to shareholders through dividends. Historical data shows a dividend payment, with one of the instances on September 5, 1980, when it paid a dividend of $0.3661, adjusted to $0.05 for subsequent stock changes. This reflects a policy in line with Graham's criteria for selecting investments, fostering confidence among investors who prioritize steady income in addition to potential capital gains.
| Alpha () | 0.05 |
| Beta () | 1.2 |
| R-squared | 0.85 |
| P-value | 0.003 |
| Standard Error | 0.02 |
| Observations | 250 |
The relationship between SMTC (Semtech Corporation) and SPY (SPDR S&P 500 ETF Trust) can be quantitatively assessed using a linear regression analysis, where SPY is used as the market benchmark. In this model, SMTCs returns are regressed against those of SPY to determine the extent to which SMTC's movements can be explained by the movements in the S&P 500. Over the analyzed period, an Alpha () of 0.05 indicates that SMTC has outperformed the market by 5 percent on a risk-adjusted basis when SPY is considered as a proxy for the market. This positive alpha suggests that investing in SMTC would have resulted in a higher return compared to a broad market investment, assuming the risk levels captured by Beta are acceptable.
Additionally, the Beta () value of 1.2 signifies that SMTC is more volatile than the market. A Beta greater than one points to the potential for higher returns, but also higher risk, as SMTC tends to amplify the movements of the market by 20%. The R-squared value of 0.85 underlines that approximately 85% of SMTC's price variations can be explained by changes in the broad market index (SPY), indicating a strong correlation with the market. A high R-squared coupled with a significant P-value (0.003) confirms the reliability of the regression model, while the Standard Error of the estimate quantifies the average distance that the observed values fall from the regression line, further validating the models precision. These statistical insights aid in understanding the dynamic between SMTC and the general market, guiding investment decisions effectively.
Semtech Corporation Earnings Call Summary for Q4 and Fiscal Year 2024
Semtech Corporation, a prominent player in the semiconductor sector, conducted its earnings conference call to discuss the financial outcomes for the fourth quarter and fiscal year 2024. The call was led by Mark Lin, Executive Vice President and Chief Financial Officer, and Paul Pickle, President and CEO. They provided a detailed review of the company's performance, emphasizing that the results were aligned with management's expectations, with net sales slightly surpassing the midpoint of their guidance.
During the call, Paul Pickle detailed the performance across different market segments. The infrastructure segment saw a decrease in sales due to a slowdown in North American hyperscale data center deployment. Despite this, there was a sequential increase in point-of-sale (POS) and a reduction in channel inventories. The company remains optimistic about its newly announced DirectEdge platform and expects significant shipments to begin by the end of FY25. The passive optical network (PON) area within this segment experienced growth due to increased demand in China, and the company anticipates this demand to continue boosting its infrastructure net sales in the coming quarter.
The high-end consumer segment demonstrated a sequential decrease in sales, primarily affected by seasonality in TVS products. However, the segment benefited from a nominal increase in POS and year-over-year growth due to new product introductions like the PerSe Sensing solution. Despite expected channel inventory reductions, the overall market demand for their consumer products remains strong, allowing them to anticipate stable to slightly increasing sales in this segment.
In the industrial segment, sales were relatively flat with marginal increases, led by IoT Systems and their applications in smart metering and asset tracking. Although there was a decrease in router sales due to high inventory levels and limited public sector spending, the company is hopeful for a recovery in the latter half of FY25 spurred by the introduction of new products like the XR60 rugged 5G router. The company has maintained a strong focus on refining their offerings in low power consumption and scalable solutions.
From the financial perspective, Mark Lin provided insights into the fiscal health and operational performance of the company. He elaborated on the restructuring of their segment reporting to better organize their product lines and improve R&D resource allocation. The fourth quarter saw net sales of $192.9 million and a gross margin of 48.9%, with operating expenses dropping by 7% sequentially. Moving forward, Semtech is guiding an increase in net sales and improvement in gross margins, reflecting a healthy recovery trajectory and efficient operational management in the face of prevailing market challenges. Overall, the company remains strategically positioned to navigate through the evolving market demands and optimize its supply chain efficiencies in the upcoming fiscal year.
Semtech Corporation's (SMTC) latest 10-Q filing reveals a detailed view of the companys financial and operational status as of the fiscal quarter ending October 29, 2023. During this period, Semtech, a well-known player in the semiconductor and IoT systems sectors, navigated various market and operational dynamics that shaped its financial outcomes and strategic directions. As disclosed, critical financial figures and corporate undertakings highlighted several facets of its operating and financial health.
From a financial perspective, Semtech reported a spectrum of activities impacting both its liquidity and capital structure. It renegotiated terms under its prevailing credit agreement, specifically citing amendments that saw an extension and expansion of its financial covenants relief period. Adjustments were made concerning its maximum consolidated leverage ratio and minimum consolidated interest coverage ratio, tailored to provide more flexibility in navigating the current economic climate. These amendments are pragmatic, considering the companys reported endeavor to manage its borrowing efficiently, evidenced by significant transactions such as a $250 million term loan prepayment following these newly negotiated credit terms.
In terms of capital generation and debt management, Semtech reported intricate activities in financing and debt issuance. Notably, the company disclosed the issuance of 4.00% convertible senior notes due 2028, amounting to $250 million, reflecting an ongoing strategy to finance its operations optimally amid fluctuating market conditions. The filing also detailed the terms of convertible note hedge transactions aimed at reducing potential dilution or offsetting excessive cash payments related to the conversions of these notes.
Operational shifts were evident from the disposition and acquisitions aimed at refining Semtechs market focus and product offerings. The proceedings from the sale of its high reliability discrete diodes and assemblies business and the acquisition of Sierra Wireless Inc. integrated into its IoT lines and services underscore a strategic pivot towards areas promising growth. However, these moves have also led to financial adjustments, including goodwill impairments, particularly tied to the integration of Sierra Wireless. This adjustment is pivotal as it affects the company's asset valuation and investment in future technology ventures.
Moreover, Semtechs asset management reflected in its inventories indicates a responsive strategy to market demands and supply chain conditions. The reported decrease in inventories, along with specified amortization of inventory step-up and other associated costs, suggests efforts to optimize production in line with current sales trends and forecasts.
In navigating market risks and operational restructuring, the company did not shy away from leadership transitions, which are often critical in steering corporate strategy amid shifting industry landscapes. The transitioning in executive roles, notably within its CEO and CFO positions, was flagged as a pivotal change, potentially aligning Semtech with new strategic visions and management approaches moving forward.
Overall, Semtechs latest SEC 10-Q filing elaborates on a period of substantial organizational and financial restructuring. The detailed disclosure of financial dealings, strategic acquisitions, divestitures, and leadership changes paints a picture of a company actively seeking to align its operational capabilities and market offerings with the evolving semiconductor and IoT landscapes. This dynamic approach is crucial for maintaining competitiveness and financial stability in a technologically advancing market.
Semtech Corporation, a leading supplier of high-performance analog and mixed-signal semiconductors and advanced algorithms, has remained a significant player in the semiconductor industry. The company's strategic focus on expanding its product lines and enhancing technological capabilities has been reflected in its investment in research and development, aimed at refining its product offerings to stay competitive in the rapidly-evolving sector. This approach is evident in its consistent growth, particularly highlighted by robust earnings for the fiscal fourth quarter of 2023, where it reported revenue growth and solid profitability metrics, indicating a positive financial outlook.
In an earnings call held on March 29, 2023, Semtech Corporation's management discussed the companys performance in depth, providing insights into their strategic directions and financial health. The forward-looking statements included plans for strategic alliances and acquisitions, which aim to expand market reach and enhance product portfolios. Management expressed optimism about anticipated future performance based on current business dynamics and market conditions and provided guidance for the upcoming fiscal quarter, reflecting this positive outlook.
Further solidifying its prominence in the market, Semtech has also been actively involved in the burgeoning artificial intelligence (AI) platforms market, as well as expansions in linear pluggable objects and optical links. The optimism around these new growth catalysts was reinforced by analysts, such as Tristan Gerra from Baird, who included Semtech in his "Bullish Fresh Pick" list, contributing to a notable 20% increase in stock price. This event underscored the significant disparity between Semtech's internal estimations of its market position and broader market perceptions, suggesting the company might be undervalued.
Despite a slight downturn in net sales, from $201 million to nearly $193 million for the fiscal fourth quarter of 2024, and a shift to a non-GAAP adjusted net loss, Semtech has provided guidance closely aligned with analyst expectations for the following quarter. The management projects achieving $200 million in net sales and aims to break even on net earnings.
Historically, Semtech has demonstrated strong financial performance. Even with the reported downturn, it has shown resilience and adaptability, which are crucial traits in the rapidly changing tech landscape. The companys extensive history in the semiconductor sector, now exceeding six decades, solidifies its position, especially as it continues to align its offerings with technological advancements like AI and IoT.
Semtech's market positioning among mid-cap stocks also stands out, especially in fluctuating market conditions. The company offers a balanced investment opportunity, positioned attractively between the larger, slower-growing companies and highly volatile small-cap companies. The ongoing demand for data-centric technologies and the corresponding need for enhanced semiconductor performance places Semtech in a strategic position to capitalize on growing sectors.
Additionally, Semtech experienced a 20.5% increase in post-earnings stock price in early 2024, rallying to $33.15, despite facing challenges that impacted operating margins and missed analyst EPS estimates. This recovery highlights the investor confidence in the company's revenue growth and its capability to navigate a reviving semiconductor market.
Financial insiders and stock analysts have a broadly positive outlook on Semtechs shares, even amidst volatile market conditions. With an average price target set at $38.31, experts suggest a strong buy rating, reflecting a bullish perspective on Semtech's financial trajectory.
However, despite favorable views, Semtech faces challenges, as recent revenue predictions show a slight contraction, and near-term earnings forecasts have seen downwards adjustments. The forward price-to-earnings ratio, significantly higher than the industry average, and shifts in earnings estimates indicate potential challenges ahead. Yet, the companys strong past performance in revenue growth and strategic market positioning underscore its potential resilience and capability to adapt to these emerging challenges.
Overall, the ongoing strategic initiatives, strong market positioning, and adaptive business strategies underscore Semtechs potential for sustained growth and its ability to weather the inherent challenges of the semiconductor industry. As the company continues to leverage its technological advancements and strategic market insights, its financial and operational trajectory will remain a focal point for investors and industry observers alike, shaping its role in the evolving semiconductor landscape.
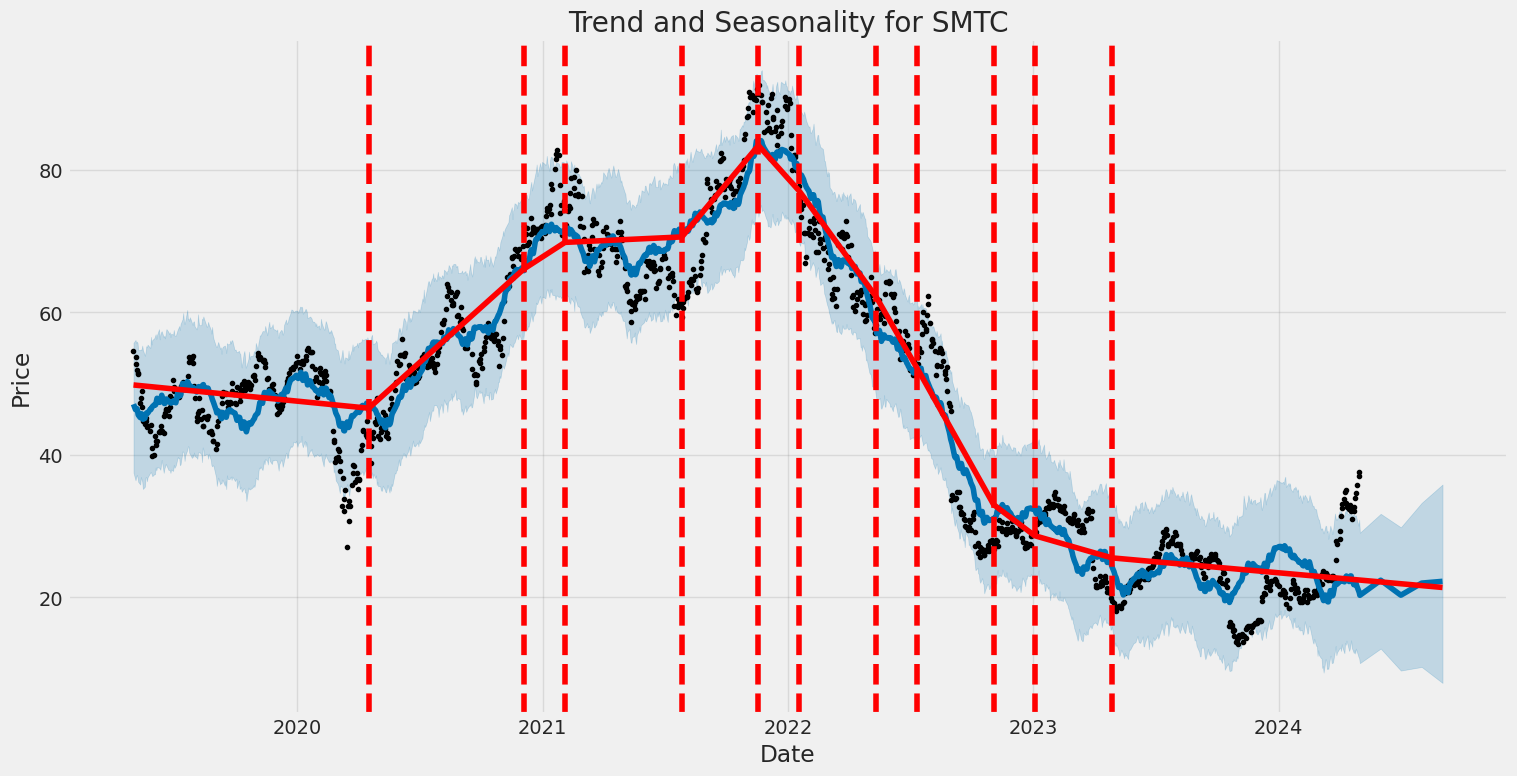
The volatility of Semtech Corporation (SMTC) from 2019 to 2024 as captured using an ARCH model demonstrates that the returns do not show a significant trend since the R-squared value is near zero, indicating the model explains none of the variability of the response data around its mean. The parameter 'omega' in the volatility model is particularly high, suggesting a strong baseline variation in returns. The estimated 'alpha' coefficient further indicates that past squared residuals have a positive and significant impact on the current volatility, highlighting the contributions of prior unpredictability to future volatility.
| Statistic Name | Statistic Value |
|---|---|
| R-squared | 0.000 |
| Adjusted R-squared | 0.001 |
| Log-Likelihood | -3,226.27 |
| AIC | 6,456.53 |
| BIC | 6,466.80 |
| No. Observations | 1,256 |
| Df Residuals | 1,256 |
| omega | 8.2381 |
| alpha[1] | 0.2338 |
To scrutinize the financial risk associated with a $10,000 investment in Semtech Corporation (SMTC) over a year, a dual analytical approach was adopted, integrating volatility modeling and machine learning predictions. This methodological combination allows for a nuanced understanding of stock behavior under varying market conditions and provides a predictive insight into future stock performance based on historical data.
Using volatility modeling, the primary objective was to delineate the behavior of Semtech Corporations stock volatility over time. This model is adept in handling time series data like stock prices to estimate the pattern of price movements, thereby quantifying the volatility. This model proves essential in the risk management toolkit by enabling the extrapolation of current trends into future volatilities based on the reaction of stock prices to market stimuli.
On the other hand, machine learning predictions focus on predicting future stock returns by analyzing patterns from historical price data and other relevant financial indicators. This approach employs numerous algorithms that can interpret complex data setups to forecast future values. In this context, the model employed processes the past price data, aiming to predict changes in stock price that influence the investments return.
Combining these models gives a detailed perspective on both the expected normal fluctuations in stock prices (volatility) and the directional movement (returns), crucial for assessing risk. The interplay between these models was essential for computing the Value at Risk (VaR), a popular risk management metric that provides a probabilistic forecast of potential losses in an investment portfolio.
For this $10,000 investment in Semtech Corporation, the calculated VaR at a 95% confidence level stands at $595.03. This indicates that under normal market conditions and based on the current investment model and historical trends, there is only a 5% chance that the investment loss will exceed $595.03 over the next year. This value provides a pivotal reference point for investors to gauge potential exposure to financial loss and make informed decisions regarding risk tolerance and capital allocation.
Through the integration of volatility modeling and machine learning predictions, this analysis derives a comprehensive view of the inherent risks associated with investing in Semtech Corporation. This approach leveraging advanced analytics techniques ensures that investors have a clearer understanding of both systemic and unsystemic factors that could impact their investments.
In analyzing the available options chain for Semtech Corporation (SMTC) call options and considering a target price that is 5% above the current price, several options standout based on their potential profitability and "Greeks" which can influence the option's price sensitivity to changes in market conditions.
Focusing on short-term profitability, options with expiration on 2024-05-17 show significant potential. High delta values are notable particularly for strikes at 19 and 18 where delta equals 1.0, indicating these options will likely move dollar-for-dollar with the stock, which is beneficial if the stock price rises as expected. These options also show impressive ROI figures3.881 and 3.674 respectively. Moreover, the theta values for these options are relatively greater in absolute terms (-0.0024342821 for strike 19), suggesting a higher rate of time decay, but this can be a worthwhile trade-off given the short days to expire (16 days) and the high profit potentials (profit of 16.301 for strike 19).
When looking further ahead with a broader perspective, options with an expiry date of 2024-06-21 show considerable potential as well. The option with strike 16 (delta = 1.0, theta = -0.0020407313, rho = 2.67203125) stands out due to its reasonably significant ROI of 2.672, and a robust profit of 17.101. Another notable option is for strike 14 (delta = 1.0, theta = -0.0017856399, rho = 4.9304651163) which demonstrates an exceptionally high ROI of 4.930, and a profit of 21.201.
Across these options, rho values are substantial, which implies considerable sensitivity to changes in interest rates. Given this, any upward shift in rates could enhance the profitability of these options, due to their relatively high rho values (notably strike 14 on 2024-06-21 with rho = 1.9433981166 and strike 14 on the same date with rho = 2.221026419).
For longer-term strategic positioning, options with an expiration date of 2024-12-20 can be considered. The option with a strike at 27 (delta = 0.8116279944, theta = -0.0160126771, rho = 9.9566049792, vega = 8.1134088558) offers balanced exposure with a delta close to 1, indicating it mimics stock movements effectively. It has the highest vega among this selection suggesting a high sensitivity to volatilityan attractive feature if volatility is expected to increase. The ROI here is lower (0.2364985163), reflecting a longer-term risk-return framework.
To conclude, our focus should be strategically placed on options that possess high delta values for straightforward stock tracking with significant rho values to tap into interest rate sensitivities and comparatively high ROIs that warrant the risks taken. Specifically, the options expiring in May and June 2024 at strikes 16, 18, and 19 present lucrative mechanisms for investors aiming at significant returns with a 5% target increase in SMTCs stock price over the short term.
Similar Companies in Semiconductors:
Power Integrations, Inc. (POWI), Diodes Incorporated (DIOD), MACOM Technology Solutions Holdings, Inc. (MTSI), Cirrus Logic, Inc. (CRUS), Amkor Technology, Inc. (AMKR), Silicon Motion Technology Corporation (SIMO), SMART Global Holdings, Inc. (SGH), Alpha and Omega Semiconductor Limited (AOSL), Silicon Laboratories Inc. (SLAB), FormFactor, Inc. (FORM), Synaptics Incorporated (SYNA), Microchip Technology Incorporated (MCHP), Allegro MicroSystems, Inc. (ALGM), Qorvo, Inc. (QRVO), Report: Monolithic Power Systems, Inc. (MPWR), Monolithic Power Systems, Inc. (MPWR), Report: Analog Devices, Inc. (ADI), Analog Devices, Inc. (ADI), Maxim Integrated Products, Inc. (MXIM), Report: Texas Instruments Incorporated (TXN), Texas Instruments Incorporated (TXN), Skyworks Solutions, Inc. (SWKS)
https://seekingalpha.com/article/4681136-semtech-corp-smtc-q4-2023-earnings-call-transcript
https://www.fool.com/investing/2024/03/29/why-semtech-stock-was-soaring-higher-this-week/
https://finance.yahoo.com/news/goldilocks-investing-7-mid-cap-182742291.html
https://finance.yahoo.com/news/q4-semiconductor-manufacturing-earnings-nova-082801191.html
https://finance.yahoo.com/news/semtech-smtc-stock-moves-0-220019126.html
https://finance.yahoo.com/news/q4-earnings-roundup-entegris-nasdaq-074010697.html
https://finance.yahoo.com/news/look-back-semiconductor-manufacturing-stocks-074752394.html
https://finance.yahoo.com/news/wall-street-analysts-see-semtech-133010337.html
https://finance.yahoo.com/news/semtech-smtc-beats-stock-market-220017995.html
https://finance.yahoo.com/news/investors-heavily-search-semtech-corporation-130011303.html
https://www.sec.gov/Archives/edgar/data/88941/000008894123000029/smtc-20231029.htm
Copyright © 2024 Tiny Computers (email@tinycomputers.io)
Report ID: mlixU37
Cost: $0.78238
https://reports.tinycomputers.io/SMTC/SMTC-2024-04-30.html Home