Texas Instruments Incorporated (ticker: TXN)
2024-01-27
 Texas Instruments Incorporated (NASDAQ: TXN), widely known as TI, is a prominent technology company that specializes in the design and manufacture of semiconductors and various integrated circuits, which it distributes globally. Founded in 1930 and headquartered in Dallas, Texas, TI is one of the top suppliers in the semiconductor market, particularly renowned for producing high-quality analog chips and embedded processors that are essential in electronic devices across a broad array of industries. The company operates through two major segments: Analog and Embedded Processing. The Analog segment primarily includes high-volume analog and logic products, while the Embedded Processing segment encompasses microcontrollers and digital signal processors. Texas Instruments is also known for its educational technology products, including graphing calculators used in schools worldwide. TI's broad product portfolio, continual innovation, and strategic market positioning allow it to maintain resilience against market fluctuations and remain competitive in the dynamic technology sector.
| Address | 12500 TI Boulevard | City | Dallas | State | TX |
| ZIP | 75243 | Country | United States | Phone | 214 479 3773 |
| Website | https://www.ti.com | Industry | Semiconductors | Sector | Technology |
| Previous Close | 167.42 | Open | 166.2 | Day Low | 163.28 |
| Day High | 166.2 | Market Cap | 149,157,806,080 | Fifty Two Week Low | 139.48 |
| Fifty Two Week High | 188.12 | Volume | 8,800,206 | Average Volume | 5,925,880 |
| Average Volume 10 days | 7,902,210 | Bid | 163.91 | Ask | 164.09 |
| Book Value | 18.589 | Price to Book | 8.827263 | Net Income To Common | 6,510,000,128 |
| Trailing EPS | 7.06 | Forward EPS | 6.6 | Total Revenue | 17,518,999,552 |
| Profit Margins | 0.3716 | Shares Outstanding | 909,000,000 | Dividend Rate | 5.2 |
| Dividend Yield | 0.0311 | Payout Ratio | 0.71 | Beta | 1.029 |
| Sharpe Ratio | -17,590.735571571468 | Sortino Ratio | -286.42593551961613 |
| Treynor Ratio | -0.013583897557790827 | Calmar Ratio | -0.14767371059976425 |
The current technical analysis presents a mixed signal for the stock of TXN. Despite the improvement in the OBV (On Balance Volume) over the last few months, reaching 0.55317 million, indicating some buying pressure, the declining MACD Histogram, from 0.153289 to -0.510255, points to bearish momentum as the latest values turn negative. This divergence suggests a faltering bullish run and a potential shift towards a downward trend or consolidation.
Analyzing the fundamental health of the company, we see solid margins with gross margins at 62.897% pointing towards solid profitability in the goods or services offered. Operating margins at 37.601% also portray efficient management in terms of controlling expenses relative to revenue. A trailing PEG ratio at 3.2205 is high, leading some to question future growth relative to earnings. However, the balance sheet reveals a healthy liquidity situation with a significant amount of cash and cash equivalents which can support future operations and investments.
Risk-adjusted performance metrics paint a bleaker picture. With a Sharpe Ratio of -17.5907, Sortino Ratio of -286.4259, Treynor Ratio of -0.0136, and Calmar Ratio of -0.1477, the risk-adjusted returns over the past year have been poor. These values suggest that TXN has not only underperformed its own volatility but also in comparison to a risk-free benchmark rate.
The cash flow statement shows proactive capital management, with significant free cash flow generation and repurchase of capital stock. Such buybacks typically signal management's confidence in the stock's inherent value but could potentially be a concern if not managed judiciously in relation to the companys investment needs.
The analyst expectations for TXN indicate that despite an immediate negative outlook for the current and next quarter, with declines of 41.60% and 37.40% respectively, the next year growth estimate is set at a robust 26.00%. This optimistic longer-term growth forecast contrasts with negative earnings revisions for the next year.
The Altman Z-Score of 9.9619 indicates a very healthy zone, minimizing the risk of bankruptcy, but with a low Piotroski Score of 3, there are some concerns about the financial strength and operational efficiency at present.
Taking into account the technical, fundamental assessments, and risk-adjusted performance metrics, the possible movement in TXN's stock price in the next few months may lean towards a bearish or consolidatory phase due to the recent negative momentum and risk assessments. However, the underlying fundamentals and analyst growth expectations suggest that a medium to long-term perspective could see a rebound, assuming positive corporate developments and market conditions. Understanding the cyclic nature of the technology sector, TXN's stock price performance will also be sensitive to broader market trends and sector-specific events. Investors should closely monitor forthcoming earnings releases, management commentary, and industry trends, which could lead to a reevaluation of current projections and expectations.
| Statistic Name | Statistic Value |
| R-squared | 0.615 |
| Adj. R-squared | 0.614 |
| F-statistic | 2005 |
| Prob (F-statistic) | 1.87e-262 |
| Log-Likelihood | -2024.6 |
| No. Observations | 1,258 |
| AIC | 4053 |
| BIC | 4064 |
| Alpha (const) | -0.0066 |
| Beta (0) | 1.1615 |
| Std Err (Beta) | 0.026 |
| t (Beta) | 44.773 |
| P>|t| (Beta) | 0.000 |
| [0.025 | 1.111 |
| 0.975] | 1.212 |
In analyzing the relationship between TXN and SPY using the linear regression model, we find a significant positive beta coefficient of approximately 1.1615. This suggests that for each unit increase in SPY - a proxy for the entire market - the expected return of TXN increases by about 1.1615 units, showcasing a strong positive relationship between the performance of TXN and the overall market. The R-squared value of 0.615 indicates that roughly 61.5% of the variations in TXN's returns can be explained by the market's returns, represented here by SPY.
Regarding the intercept of the regression, also known as alpha, the model reports a value of approximately -0.0066. Alpha is an indicator of the excess return or underperformance of TXN relative to the benchmark index after adjusting for market movements. A negative alpha of -0.0066 implies that TXN underperforms the market returns by -0.66% after accounting for market moves. However, given the p-value associated with the alpha estimate (0.847), this result is not statistically significant, meaning we cannot confidently assert that TXN has underperformed (or outperformed) the market based on the available data up to the present time.
Summary of Texas Instruments' Fourth Quarter 2023 Earnings Call:
Overview: Texas Instruments Incorporated (TI) conducted its fourth-quarter 2023 earnings call, led by Dave Pahl, Head of Investor Relations, and Chief Financial Officer Rafael Lizardi. The session included preambles on forward-looking statements and an announcement of the upcoming Capital Management Call. TI reported a decrease in revenue, attributed primarily to decreasing industrial demand and reduced automotive market sales.
Fourth Quarter Performance: TI noted a revenue of $4.1 billion for the fourth quarter, signifying a 10% sequential decrease and a 13% year-over-year decline. Analog revenue saw a 12% year-over-year drop, while embedded processing declined by 10%. A more significant decline of 25% was observed in the 'other' segment compared to the previous year. Industrials decreased by mid-teens, and the automotive market saw a mid-single-digit decline, indicating inventory adjustments by customers. Conversely, personal electronics remained relatively flat, communication equipment declined by low-single-digits, and enterprise systems grew by low single-digits.
End Market Breakdown: The revenue by end market for 2023 showcased that industrial made up 40%, automotive 34%, personal electronics 15%, communications equipment 5%, and enterprise systems 4%. The combination of industrial and automotive segments now represents 74% of TI's revenue, with a particular strategic focus due to increased chip content per application in these fields, resulting in potential growth.
Financial Results and Guidance: Lizardi reported a gross profit of $2.4 billion or 60% of revenue, representing a significant reduction from the previous year primarily due to decreased revenue and increased manufacturing costs from capacity expansions. Operating profit fell by 30% year-over-year, and net income was $1.4 billion, or $1.49 per share. Notably, TI returned $4.9 billion to shareholders over the past 12 months and maintained a strong cash and short-term investments balance of $8.6 billion. Inventory levels saw an increase to $4 billion, and days of inventory rose to 219. The expected revenue for the first quarter of 2024 is projected to be between $3.45 billion and $3.75 billion, with earnings per share in the range of $0.96 to $1.16. TI's effective tax rate for 2024 is anticipated to be around 13%.
Closing Remarks:
The call ended with a Q&A session, addressing specific queries about market trends, gross margins, customer inventory levels, CapEx, and the anticipated impact of the Chips Act. Overall, TI emphasized its focus on long-term profitability and market share growth through strategic investments and capital management.
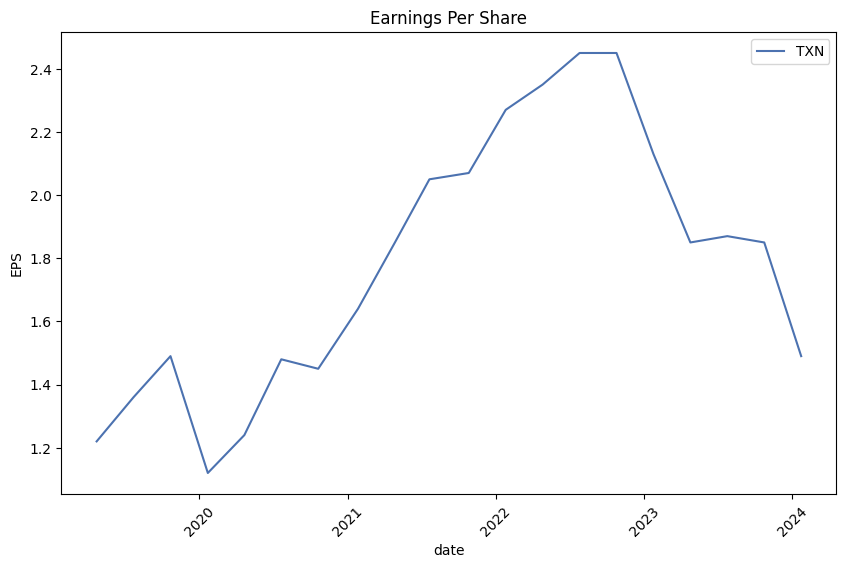
As of September 30, 2023, Texas Instruments Incorporated (TI) reported their third-quarter earnings with a revenue of $4.53 billion, a decrease of 14% from the third quarter of 2022. Net income experienced a decline, reported at $1.71 billion compared to $2.30 billion in the comparable quarter of the previous year. The company's earnings per share (EPS) also fell to $1.85 from $2.47 in Q3 of 2022. This reduction in revenue and income is primarily ascribed to lower sales in the Analog segment, albeit it was slightly offset by higher revenue from the Embedded Processing segment.
The Analog segment, which includes Power and Signal Chain product lines, suffered a revenue drop of 16% year over year to $3.353 billion, leading to a 31% decrease in operating profit to $1.504 billion. In contrast, the Embedded Processing division experienced an 8% increase in revenue. However, operating profit in this segment declined by 20% despite the rise in revenue, mainly due to higher manufacturing costs.
Cash flow from operations for the trailing twelve months was reported at $6.5 billion, indicating the strength and resilience of TI's business model. Free cash flow for the same period stood at $1.6 billion, representing 9% of revenue. The report reveals significant investment in research and development (R&D) and selling, general, and administrative (SG&A) activities, totaling $3.7 billion, and capital expenditures of $4.9 billion over the past 12 months. Furthermore, TI returned $5.6 billion to shareholders.
The company's inventory level increased by $1.15 billion compared to the end of 2022, pointing to a strategic build-up in inventory levels. Total cash, inclusive of cash equivalents and short-term investments, decreased slightly by $119 million from the end of 2022, amounting to $8.95 billion.
In the investing activities, TI reported capital expenditures of $3.92 billion, majorly allocated to semiconductor manufacturing equipment and facilities. This investment is part of TI's strategy to strengthen its competitive advantage in manufacturing and technology, and the company anticipates receiving cash benefits associated with the U.S. CHIPS and Science Act investment tax credit for qualifying capital expenditures in the future.
Financing activities saw the issue of $3.00 billion in new fixed-rate, long-term debt and the retirement of $500 million existing debt. Dividends paid increased slightly due to an elevated dividend rate offset by fewer shares outstanding, and the company repurchased 1.3 million shares of common stock for $228 million.
The filing details an anticipated increase in the dividend by 5% in September 2023. This move underscores TI's commitment to returning value to its shareholders, marking the 20th consecutive year of dividend increases.
Finally, as of September 30, 2023, TI has an open-market purchase authorization for up to $21.26 billion of its common stock, without a specified expiration date, delineated from its 2018 and 2022 board authorizations.
Texas Instruments Incorporated (TI) holds a venerable position as a semiconductor manufacturer renowned for its operational excellence and consistent financial performance. Analog chips and embedded processors represent the core of TI's product lineup, addressing the relentless demand spanning consumer electronics, industrial applications, and automotive industries. This focus on essential yet commoditized components aligns TI's strategy with industry counterparts like Amphenol, both exemplifying prowess in large-scale manufacturing efficiency to sustain profitability amid competitive market conditions.
TI has indeed invested heavily in expanding production capabilities, evidenced by its enhanced capital expenditures aimed at establishing new chip fabrication facilities. The move, reflective of the sector's capital-intensive nature, is designed to secure TI's competitive edge and its fulfillment of increasing semiconductor requirements globally. Emulating the growth pattern of Amphenol, TI has judiciously combined organic growth initiatives with strategic acquisitions to widen its market reach and boost profits.
Historically a strong dividend payer, TI has intrigued investors with its ability to manage growth alongside rewarding shareholder returns. The strategy has mirrored the success of companies with financial fortitude, who may not engage in groundbreaking technology, yet offer reliability and sound fiscal increments, akin to the "boring" but robust performance of firms like Amphenol.
Analysts and investors alike were keyed into Texas Instruments' stock movements as shown in various reports from December 2023 through January 2024. On December 18, 2023, TXN stock experienced a decline, falling to $167.42 and marking a -0.72% difference from the previous day, which contrasted with the S&P 500's gain. While the market generally trended upwards, Texas Instruments' downturn culminated from less than favorable projections for its forthcoming earnings release. Analysts expected a downturn, with projected Earnings Per Share (EPS) of $1.46a decline of 31.46% year-over-yearand an anticipated revenue fall by 11.92%. Full-year estimates pointed to earnings of $7.04 per share and revenue totaling $17.56 billion, representing declines of -25.03% and -12.35%, respectively.
Tracking analyst revisions and Texas Instruments' Zacks Rank became a focal point for investors. At the time of the report on December 18, 2023, Texas Instruments sat at a Zacks Rank of #4 (Sell), suggesting bearish implications. Its valuation metrics, such as the Forward Price-to-Earnings (P/E) ratio and Price/Earnings to Growth (PEG) ratio, were central to investment considerations. The company's industry, Semiconductor - General, was ranked at 181 out of over 250 industries by Zacks, which placed it in the bottom 29%.
Despite these projections, Texas Instruments had its moments of positive market performance. By December 28, 2023, the company's share price increased, capturing an 11.77% appreciation over the past month, outperforming both the Computer and Technology sector and the S&P 500. Analyst expectations for an earnings decline persisted, but shifts in analyst estimates served as pivotal indicators for potential shifts in company performance and stock price movement.
Further discussions in the financial sector highlighted Texas Instruments' stability amid a bullish market rally, which faced adjustments after a pivot signal from the Federal Reserve. Market participants were advised to keep an eye on high-quality names like Texas Instruments during economic stress. The company's prospects may be further buoyed by domestic manufacturing incentives and its steadfast role within the technology sector.
Texas Instruments' importance in the dynamic field of automotive chips was accentuated by its diverse product range, which includes chips for DLP in forefront automotive technologies, ADAS radar sensor chips, and more. The company's 27% revenue increase in 2021 and continued 9% growth in 2022 though followed by projections of a decline in revenue in 2023, underscores the cyclical challenges within markets. Despite facing a slower recovery in China's industrial sector, the company's transition from 200mm to 300mm wafer technology, which is expected to cut costs of unpackaged parts by about 40%, indicated a commitment to cost-efficiency and future growth.
As investors awaited the financial results for the fourth quarter and full year of 2023, the webcast scheduled for January 23, 2024, presented an opportunity for stakeholders to gain insights from TI's leadership on the company's direction amidst the discussed fiscal challenges.
In summary, Texas Instruments, though facing economic pressures evidenced by a series of detailed financial reports, continues to execute a strategic plan that balances manufacturing leadership and fiscal prudence. While earnings and revenue projections might signal a downturn, long-term investments, coupled with a commanding presence in the semiconductor industry, align to underpin Texas Instruments' role as a resilient contender amidst market uncertainty.
Based on the volatility model analysis of Texas Instruments Incorporated (TXN) from January 28, 2019, to January 26, 2024, the following points summarize its volatility:
-
The ARCH model suggests that the fluctuations in TXN's returns are significantly persistent, evidenced by a substantial omega value and an alpha[1] that indicates the impact of past volatility on current volatility.
-
The model indicates no substantial predictive power for future returns by the past returns themselves, as the R-squared value is virtually zero.
-
The statistics provide strong confidence in the model's accuracy, with narrow confidence intervals for estimated parameters and high statistical significance.
Here is the HTML table detailing the volatility statistics:
| Statistic | Value |
|---|---|
| Mean Model | Zero Mean |
| R-squared | 0.000 |
| Adj. R-squared | 0.001 |
| Log-Likelihood | -2,544.84 |
| AIC | 5,093.67 |
| BIC | 5,103.95 |
| No. Observations | 1,258 |
| omega | 2.6307 |
| alpha[1] | 0.2659 |
When assessing the financial risk of a $10,000 investment in Texas Instruments Incorporated (TXN) over a one-year period, we employ volatility modeling to understand and forecast the stock's volatility and complement this with machine learning predictions to estimate future stock returns.
Volatility modeling is a statistical tool often employed in the finance industry to quantify the degree of variation in a trading price series over time. In the context of TXN, the use of volatility modeling allows investors to measure the stock's historical volatility and predict how it may behave in the near future. This model takes past price data and estimates the level of variability that may be expected, which is a critical component for calculating risk metrics such as the Value at Risk (VaR).
On the other hand, machine learning predictions incorporate a vast array of algorithms and statistical methods to analyze historical data and recognize patterns. In this case, machine learning predictions help in forecasting the future returns of TXN by learning from its historical prices, trading volumes, and other relevant financial indicators.
Combining these two approaches provides a robust assessment of risk. Whereas volatility modeling gives us an understanding of how uncertain the stock returns are, machine learning predictions offer insights into the direction and magnitude of future stock returns.
The calculated VaR at a 95% confidence interval provides investors with an estimate of the maximum expected loss over a set period, which in this case is one year. For the $10,000 investment in TXN, the annual VaR at the 95% confidence level stands at $248.62. This figure implies that there is a 5% chance that the investment in TXN could lose more than $248.62 over the next year due to normal market fluctuations.
The effectiveness of integrating volatility modeling with machine learning predictions is demonstrated through the calculated VaR. The provided VaR figure is a practical and widely-used risk metric, helping investors to gauge potential losses and make more informed decisions regarding their investment in TXN.
Similar Companies in Semiconductors:
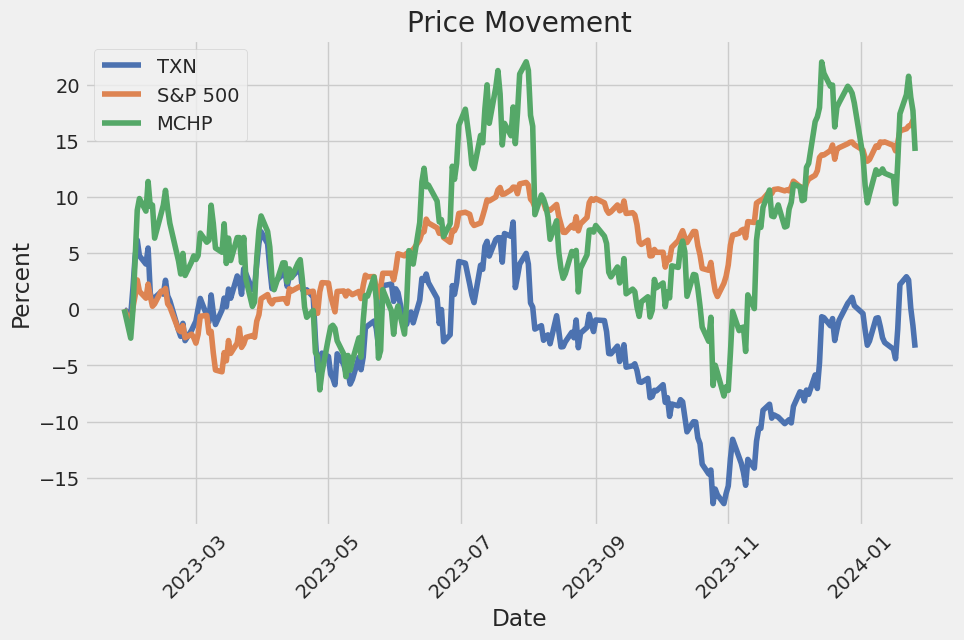
Microchip Technology Incorporated (MCHP), Monolithic Power Systems, Inc. (MPWR), NXP Semiconductors N.V. (NXPI), ON Semiconductor Corporation (ON), Analog Devices, Inc. (ADI), Qorvo, Inc. (QRVO), Broadcom Inc. (AVGO), Report: Micron Technology, Inc. (MU), Micron Technology, Inc. (MU), Report: Intel Corporation (INTC), Intel Corporation (INTC), Marvell Technology, Inc. (MRVL), Report: Advanced Micro Devices, Inc. (AMD), Advanced Micro Devices, Inc. (AMD), QUALCOMM Incorporated (QCOM), Lattice Semiconductor Corporation (LSCC), Maxim Integrated Products, Inc. (MXIM), STMicroelectronics N.V. (STM), Applied Materials, Inc. (AMAT)
https://seekingalpha.com/article/4658018-november-dividend-income-report
https://www.youtube.com/watch?v=JlA-fne2WiI
https://www.fool.com/investing/2023/12/22/boring-stock-investors-need-to-know-about-2024/
https://www.zacks.com/stock/news/2203386/texas-instruments-txn-laps-the-stock-market-here-s-why
https://seekingalpha.com/article/4660602-my-top-10-high-yield-dividend-stocks-for-january-2024
https://seekingalpha.com/article/4660666-my-top-15-high-growth-dividend-stocks-for-january-2024
https://www.fool.com/investing/2024/01/13/better-auto-chip-stock-mobileye-vs-texas-instrumen/
https://www.sec.gov/Archives/edgar/data/97476/000009747623000041/txn-20230930.htm
Copyright © 2024 Tiny Computers (email@tinycomputers.io)
Report ID: PccNPMv
Cost: $0.70731
https://reports.tinycomputers.io/TXN/TXN-2024-01-27.html Home