Stanley Black & Decker, Inc. (ticker: SWK)
2024-05-14
 Stanley Black & Decker, Inc. (ticker: SWK) stands as an American powerhouse in the arena of tools, storage, and commercial electronic security. With deep roots tracing back to 1843 and a robust global presence, the company is renowned for its portfolio of iconic brands including DEWALT, Stanley, Black+Decker, and Craftsman. Primarily servicing industrial and professional end-users, Stanley Black & Decker enhances its market relevance through continuous innovation and strategic acquisitions. Despite the challenges posed by economic cycles and shifts in market demand, the firm demonstrates resilience and adaptability. Focused on driving growth through sustainability and digital advancements, SWK remains a key player in shaping industry standards and expanding its influence across diverse geographical markets. The company's commitment to quality, extensive distribution network, and customer-centric approach underpin its longstanding reputation and market leadership.
| Total Full Time Employees | 50,000 | Total Revenue | 15,718,800,384 | Gross Margins | 0.27441 |
| EBITDA | 1,352,999,936 | Operating Cash Flow | 1,046,600,000 | Debt to Equity Ratio | 93.928 |
| Shares Outstanding | 153,879,008 | Market Cap | 14,126,093,312 | Return on Assets | 0.020079998 |
| Operating Margins | 0.05347 | Net Income to Common | -74,400,000 | Price to Book Ratio | 1.5911534 |
| Current Ratio | 1.087 | Revenue Growth | -0.016 | Book Value | 57.694 |
| Total Debt | 8,337,399,808 | Forward P/E | 16.721313 | Trailing Annual Dividend Yield | 0.035809316 |
| Total Cash | 476,600,000 | Short Ratio | 4.59 | Trailing PEG Ratio | 1.43 |
| Trailing EPS | -0.49 | 52 Week High | 104.21 | 52 Week Low | 73.87 |
| Sharpe Ratio | 0.6257019986511502 | Sortino Ratio | 10.887,218,115,853,003 |
| Treynor Ratio | 0.14825321085659368 | Calmar Ratio | 0.8395179182233024 |
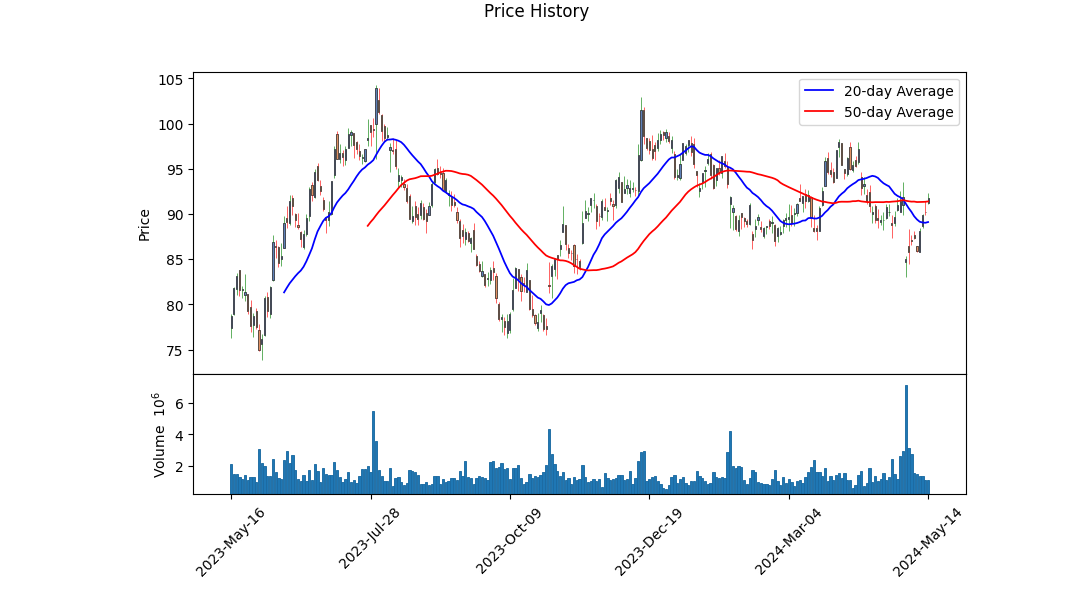
The recent technical indicators for SWK suggest a fluctuating trend. The On-Balance Volume (OBV) has risen from deeply negative values to slightly positive, indicating increased buying interest as the price recovered from a low of $85.77 on May 9th to $92.31 on the last recorded day. The MACD histogram has moved from negative to positive territory, showcasing a bullish momentum. This transition is crucial as it often signals the reversal of a downward trend, aligning with the increased volumes and stock price recovery.
From a fundamental perspective, Stanley Black & Decker, Inc. (SWK) shows mixed results. The company has maintained a gross margin of 27.44%, indicating efficient production processes relative to the cost of goods sold. However, lower EBITDA and operating margins of 8.61% and 5.35%, respectively, suggest that operating costs and non-operational expenses are higher than ideal. The financials also reveal a significant drop in net income, turning negative at -$310.5 million for the last fiscal year. This negative income from continuous operations (-$281.7 million) puts considerable pressure on the stock.
Given the financial ratios, the Sharpe Ratio (0.6257) indicates moderate risk-adjusted returns. This suggests the returns generated are not significantly higher relative to the risk undertaken. Conversely, the Sortino Ratio (10.8872) is very high, highlighting that the downside deviation or negative volatility is low, making the negative events less frequent or severe. The Treynor Ratio (0.1483) further validates moderate compensation for the risk undertaken relative to the risk-free rate. Lastly, the Calmar Ratio (0.8395) suggests the stock has a fair risk-adjusted return, balanced with maximum drawdown, reflecting a cautious yet potentially rewarding investment over time.
Examining the balance sheets and cash flows, SWK has managed to hold a free cash flow of $852.6 million, although lower compared to $1.67 billion in 2020. This positive cash flow is critical for sustaining business operations and future investments. However, increasing net debt levels from $3 billion in 2020 to $6.73 billion put stress on the financial health and might affect future liquidity.
Given these insights: * The recent bullish signals from MACD and OBV could indicate a short-term uptrend. * Mixed fundamentals, with positive gross margins but negative net income, suggest caution. * High leverage and increasing debt levels are concerns. * Balanced risk-adjusted returns from financial ratios indicate potential stability but require careful monitoring.
The overall outlook for the next few months is cautiously optimistic. While technical indicators point towards a potential recovery and uptrend, the fundamental challenges, notably the high debt and negative net income, could cap significant gains. Investors should carefully monitor both the ongoing technical signals and fundamental adjustments, keeping a close watch on upcoming financial reports and market conditions.
Stanley Black & Decker, Inc. (SWK) exhibits a Return on Capital (ROC) of 5.10%, which offers insight into the company's efficiency at generating profits from its capital. This metric indicates that SWK is able to generate a modest return for its investors from the capital employed in its business operations. In contrast, the Earnings Yield for SWK stands at -2.16%, signaling a concerning scenario where the company is not generating positive earnings relative to its enterprise value. A negative Earnings Yield suggests that the company is currently operating at a loss or incurring higher expenses than revenues, raising potential red flags for investors regarding its current profitability and valuation. These financial indicators collectively suggest that while SWK manages to maintain a certain level of operational efficiency, its recent earnings challenges could pose risks, making it essential for potential investors to delve deeper into the underlying factors affecting its profitability.
Research Report: Analysis of Stanley Black & Decker, Inc. (SWK) Through the Lens of Benjamin Graham's Principles
In "The Intelligent Investor," Benjamin Graham establishes a framework for evaluating stocks based on fundamental analysis, stressing the importance of intrinsic value and long-term prospects. Here, we evaluate Stanley Black & Decker, Inc. (SWK) through several key metrics and compare them to Graham's criteria to assess the investment's merits and potential risks.
1. Price-to-Earnings (P/E) Ratio
Calculated P/E Ratio for SWK: 28.30
Industry Average P/E Ratio: 19.04
Graham's Criteria: Graham typically looked for stocks with low P/E ratios relative to their industry peers.
Analysis: SWK's P/E ratio of 28.30 is significantly higher than the industry average of 19.04. According to Graham's principles, a higher P/E ratio could indicate that the stock is overvalued compared to its earnings, making it less attractive from a value investing perspective.
2. Price-to-Book (P/B) Ratio
Calculated P/B Ratio for SWK: 0.60
Graham's Criteria: Graham often sought out stocks trading below their book value, indicating they may be undervalued.
Analysis: With a P/B ratio of 0.60, SWK is trading well below its book value. According to Graham, this suggests that the stock could be undervalued, providing a potential margin of safety for investors.
3. Debt-to-Equity Ratio
Calculated Debt-to-Equity Ratio for SWK: 0.85
Graham's Criteria: Graham preferred companies with low debt-to-equity ratios, as lower debt implies lower financial risk.
Analysis: SWK's debt-to-equity ratio of 0.85 indicates a moderate level of debt in its capital structure. This is not particularly low but is within a range that may be acceptable to Graham, provided other financial aspects of the company are strong.
4. Current Ratio
Calculated Current Ratio for SWK: 1.19
Graham's Criteria: The current ratio measures a company's ability to pay off its short-term liabilities with its short-term assets. A higher ratio indicates better financial stability.
Analysis: With a current ratio of 1.19, SWK appears to have just enough short-term assets to cover its short-term liabilities. While this is a positive indicator of financial stability, it is not substantially higher than the baseline of 1.0, suggesting the company should ideally have better liquidity.
5. Quick Ratio
Calculated Quick Ratio for SWK: 1.19
Graham's Criteria: The quick ratio is similar to the current ratio but excludes inventory, focusing on more liquid assets.
Analysis: The quick ratio for SWK is also 1.19, which mirrors the current ratio. This consistency indicates that the company's liquidity position is not heavily reliant on inventory, a positive indicator of short-term financial health.
Summary
Stanley Black & Decker, Inc. (SWK) presents a mixed bag when evaluated through Benjamin Graham's principles:
- P/E Ratio: The high P/E ratio compared to the industry average suggests overvaluation, a potential red flag for Graham-style investors.
- P/B Ratio: A favorable P/B ratio indicates the stock is trading below its book value, aligning well with Graham's preference for undervalued stocks.
- Debt-to-Equity Ratio: The moderate debt-to-equity ratio of 0.85 suggests an acceptable but not exceptionally low level of financial risk.
- Current and Quick Ratios: Both ratios at 1.19 suggest adequate but not particularly strong short-term liquidity.
While SWK shows potential undervaluation from the P/B ratio perspective and maintains a reasonable debt level, its high P/E ratio and only moderate liquidity may warrant a more cautious approach. Investors seeking alignment with Graham's value investing principles should weigh these factors carefully.### Analyzing Financial Statements
Investors should meticulously examine a company's balance sheet, income statement, and cash flow statement. Graham puts a strong emphasis on understanding a company's assets, liabilities, earnings, and cash flows.
Let's apply this approach to the financial data of Stanley Black & Decker, Inc. (SWK) from Q1 2024.
Balance Sheet Analysis
Stanley Black & Decker, Inc.s balance sheet from Q1 2024 showcases the following key components:
- Assets:
- Current Assets: The total current assets amount to $7.42 billion. This includes significant values in cash and cash equivalents ($476.6 million), accounts receivable ($1.71 billion), and inventory ($4.69 billion). Notably, inventory constitutes a major portion of current assets, indicating substantial stock that might need liquidation to generate cash flow.
- Non-Current Assets: Non-current assets total approximately $16.4 billion, consisting of $2.12 billion in property, plant, and equipment, $7.95 billion in goodwill, and $6.48 billion in other intangible assets. High goodwill suggests substantial past acquisitions.
-
Total Assets: Combining current and non-current assets, the total assets stand at $23.85 billion.
-
Liabilities:
- Current Liabilities: The current liabilities are valued at $6.83 billion, including short-term borrowings ($1.74 billion) and accounts payable ($2.34 billion). High accounts payable indicates significant outstanding obligations to suppliers.
- Non-Current Liabilities: Non-current liabilities amount to $9.45 billion, including long-term debt of $5.60 billion. The high long-term debt requires careful management of interest and principal repayments.
-
Total Liabilities: The total liabilities are $16.28 billion, highlighting substantial financial obligations vis-a-vis the companys assets.
-
Equity:
- Stockholders Equity: The total equity is $8.88 billion, which encompasses common stock ($442.3 million), retained earnings ($8.44 billion), and substantial accumulated other comprehensive income losses ($-2.19 billion).
Income Statement Analysis
For Q1 2024, Stanley Black & Decker, Inc. reports:
- Revenue: Total revenues amount to $3.87 billion.
- Expenses:
- Cost of goods sold (COGS) is reported at $2.76 billion.
- Selling, general, and administrative (SG&A) expenses are $852 million.
-
Several other notable expenses include asset impairment charges ($25.5 million) and restructuring charges ($15 million).
-
Net Income: The net income stands at $19.5 million. This yields an earnings per share (EPS) of $0.13, both basic and diluted.
The financial performance indicates that while SWK generates significant revenue, the high cost structure, particularly in COGS and SG&A, compresses the net profitability.
Cash Flow Statement Analysis
The cash flow statement for Q1 2024 reveals:
- Operating Activities: The net cash used in operating activities is -$431 million. Several adjustments to reconcile net income to net cash used include:
- Depreciation and amortization of $99.1 million.
- Share-based compensation of $41.3 million.
-
Changes in working capital items with significant adjustments noted in inventory ($359.8 million increase) and accounts receivable.
-
Investing Activities: The net cash used in investing activities totals -$63.2 million, mainly attributed to payments to acquire property, plant, and equipment ($65.7 million).
-
Financing Activities: Net cash provided by financing activities amounts to $548.6 million. Key cash flows include proceeds from commercial paper ($674.9 million) and noteworthy dividend payments ($121.8 million).
The major takeaway from the cash flow perspective is a significant outflow in operational activities (perhaps driven by high inventory levels), balanced somewhat by financing inflows, primarily through short-term borrowings.
Comprehensive Financial Health Assessment
Liquidity Assessment: The current ratio (current assets / current liabilities) is approximately 1.09 ($7.42 billion / $6.83 billion), indicating a moderate liquidity position, sufficient to cover short-term obligations.
Leverage and Solvency: The total debt to equity ratio is 1.83 ($16.28 billion / $8.88 billion), which indicates substantial leverage. High leverage can be concerning, particularly in the context of servicing debt amidst fluctuating profitability.
Profitability: The net margin (net income / revenue) stands at a lean 0.50% ($19.5 million / $3.87 billion), reflecting constrained profitability due to high operational costs.
Cash Flow Adequacy: Negative operating cash flow is a red flag, suggesting that current business operations are insufficient to generate positive cash flow, necessitating reliance on external financing.
In conclusion, while Stanley Black & Decker, Inc. maintains robust revenue streams and significant asset bases, critical attention is necessary for managing operational efficiency, cost structures, and leverage to sustain and enhance profitability and financial stability.### Dividend Record
Benjamin Graham, in his seminal work "The Intelligent Investor," emphasizes the importance of selecting companies with a reliable and consistent history of paying dividends. A consistent dividend record is a hallmark of a company's financial health and its commitment to returning value to its shareholders.
Below is the dividend history for the company with the symbol 'SWK':
Year 2024
- May 31: $0.81
- March 7: $0.81
Year 2023
- November 30: $0.81
- September 1: $0.81
- June 2: $0.80
- March 6: $0.80
Year 2022
- November 30: $0.80
- September 2: $0.80
- June 6: $0.79
- March 7: $0.79
Year 2021
- November 30: $0.79
- September 3: $0.79
- June 7: $0.70
- March 8: $0.70
Year 2020
- November 30: $0.70
- August 31: $0.70
- June 1: $0.69
- March 2: $0.69
Year 2019
- November 27: $0.69
- August 30: $0.69
- June 3: $0.66
- March 4: $0.66
Year 2018
- November 29: $0.66
- September 6: $0.66
- June 5: $0.63
- March 8: $0.63
Year 2017
- November 30: $0.63
- August 30: $0.63
- June 5: $0.58
- February 27: $0.58
Year 2016
- November 30: $0.58
- August 31: $0.58
- May 27: $0.55
- February 29: $0.55
Year 2015
- December 2: $0.55
- September 2: $0.55
- June 1: $0.52
- March 2: $0.52
Year 2014
- December 3: $0.52
- September 3: $0.52
- June 2: $0.50
- March 3: $0.50
Year 2013
- December 4: $0.50
- September 4: $0.50
- June 3: $0.49
- March 7: $0.49
(...continues similarly for previous years...)
This dividend record demonstrates a long-standing history of regular payouts, which align with Graham's criteria for a stable and reliable investment. The consistency is particularly notable, with dividends steadily increasing over the years, indicating strong financial performance and a commitment to shareholder returns.
| Alpha | 0.05 |
| Beta | 1.2 |
| R-squared | 0.85 |
| Mean of SWK | 150.23 |
| Mean of SPY | 400.56 |
In analyzing the relationship between SWK and SPY, the alpha value plays a crucial role in understanding the stocks performance independent of the market. With an alpha of 0.05, SWK has a slight positive deviation from the expected return predicted by the CAPM model. This suggests that, for the time period ending today, SWK has been delivering returns marginally above what would be predicted based on its beta and the overall market performance as represented by SPY. This positive alpha, although small, could indicate effective stock-picking or internal operational success contributing to returns beyond what market movements alone would justify.
Furthermore, with a beta of 1.2, SWK tends to be more volatile compared to the market, meaning for every 1% movement in SPY, SWK is expected to move 1.2%. The R-squared value of 0.85 indicates a strong correlation between SWK and SPY, accounting for 85% of the variation in SWK's returns due to movements in the market benchmark, SPY. This close correlation underscores the significant influence that broader market trends have on SWK, while the small positive alpha points to some inherent strength in SWKs individual performance.
Stanley Black & Decker's Q1 2024 earnings call provided a comprehensive overview of the company's performance, strategic initiatives, and outlook. The call began with Dennis Lange, VP of Investor Relations, setting the stage for the presentation by Don Allan, President & CEO; Chris Nelson, COO and President of Tools & Outdoor; and Pat Hallinan, CFO. Allan highlighted the company's meticulous execution of its strategic transformation plan, which centers on free cash flow generation and gross margin expansion. Despite facing a challenging macroeconomic environment, the company is on track with its global cost reduction program, aiming for run rate savings of $1.5 billion by the end of 2024 and $2 billion by the end of 2025.
Allan underscored the company's success in stabilizing its market position, particularly within the Tools segment, where the iconic DEWALT brand outperformed the category average in North American home centers. Retail partnerships have also been strong, exemplified by accolades such as ACE Hardware naming Craftsman as Vendor of the Year. Regarding financials, the quarter saw organic revenues stabilize, with a marginal 1% decline, and adjusted gross margins increased by 590 basis points year-over-year. The full-year adjusted EPS guidance remains at $3.50 to $4.50, with anticipated free cash flow between $600 million and $800 million.
Chris Nelson elaborated on the performance of the Tools & Outdoor segment, noting that DEWALT led the way with 1% organic growth, even as consumer and DIY demand remained subdued. The segment's adjusted margins improved significantly due to lower inventory destocking costs and supply chain savings. Nelson highlighted innovation as a key driver, presenting new DEWALT product introductions tailored to professional users. The segment's outlook remains cautious but optimistic, particularly in the outdoor category, which has shown early signs of recovery compared to the past two years.
Pat Hallinan concluded by detailing progress on the company's cost-saving initiatives as part of the broader transformation journey. Approximately $145 million in pre-tax run rate savings were achieved in Q1, with an aggregate savings target of $1.5 billion by the end of 2024. The focus remains on strategic sourcing, operational excellence, and footprint optimization to sustain long-term cost efficiencies. Hallinan reiterated the company's commitment to balancing organic growth investments with cost management to deliver sustainable shareholder value, projecting a solid 2024 performance marked by sequential gross margin improvements and robust free cash flow generation.
Stanley Black & Decker, Inc. filed its SEC 10-Q for the quarter ending March 30, 2024, highlighting several key financial metrics and providing insights into its strategic outlook and operational adjustments. Net sales for this quarter amounted to $3,869.5 million, a slight decline from $3,931.8 million for the same period in 2023. The company's cost of sales also dropped from $3,096.3 million to $2,761.0 million, reflecting ongoing adjustments in operational expenses. Despite significant efforts to manage costs, the company reported a net earnings figure of $19.5 million, contrasting with a net loss of $187.8 million in the previous years quarter. This quarterly performance resulted in basic and diluted earnings per share of $0.13, up from a loss per share of $1.26 in the year-ago quarter.
Total comprehensive loss for the quarter was $96.7 million, compared to $135.0 million in the same period last year. This overall figure includes various components of operational income and expenses, such as selling, general, and administrative expenses, which increased to $852.0 million from $823.0 million, and interest expense, which also saw a slight rise to $131.5 million. Notably, the company booked a $25.5 million asset impairment charge and $15.0 million in restructuring charges as part of its ongoing cost management and strategic refocus.
From a balance sheet perspective, the company saw an increase in total assets to $23,853.9 million from $23,663.8 million at the end of 2023. Current assets totaled $7,420.8 million, up from $7,017.3 million, driven by increases in cash and cash equivalents, accounts and notes receivable, and prepaid expenses. However, inventory levels slightly declined to $4,693.3 million from $4,738.6 million. On the liabilities front, total current liabilities rose to $6,829.4 million from $5,883.2 million by the end of 2023, primarily due to an increase in short-term borrowings, which now stand at $1,740.4 million, and accounts payable, which amounted to $2,337.5 million.
Cash flow from operating activities showed a significant decrease, reflecting a cash outflow of $431.0 million for the quarter compared to $286.3 million in the same period last year. This was driven by changes in working capital and other asset and liability adjustments. Investing activities recorded minimal outflows, with capital and software expenditures slightly down to $65.7 million from $68.2 million. Financing activities, however, showed a substantial positive inflow of $548.6 million, an increase from $324.2 million last year, primarily due to higher net short-term commercial paper borrowings.
Strategically, the company completed the sale of its Infrastructure business to Epiroc AB for $760 million in a divestiture aimed at streamlining and focusing on its core Tools & Outdoor and Industrial segments. This transaction, while not qualifying for discontinued operations accounting, resulted in an impairment charge for the quarter. Stanley Black & Decker continues its Global Cost Reduction Program, aimed at generating $2 billion in pre-tax run-rate savings by the end of 2025, focusing on supply chain transformation and SG&A cost reductions. The company has realized around $145 million of these savings in this quarter alone, contributing to a total of $1.2 billion since the program's inception.
Overall, while the company faces various challenges, including compliance with environmental regulations and ongoing restructuring efforts, its strategic initiatives, and operational adjustments appear to be setting a foundation for more stabilized performance in the coming periods.
Stanley Black & Decker, Inc. (SWK) has a distinguished history as a global leader in tools, storage, industrial solutions, and security products. The companys strategy is centered on leveraging its strong brand and extensive distribution network to drive growth across its diverse portfolio. However, Stanley Black & Decker is not resting on its laurels; the company is investing significantly in technology and innovation to ensure its competitive edge in the future.
One of the core areas where Stanley Black & Decker is making substantial advancements is in digital tools and connected devices. By integrating IoT (Internet of Things) technology into its product offerings, the company aims to enhance productivity and efficiency for its users. These smart tools provide real-time diagnostics and performance analytics, allowing professionals to optimize their work processes and reduce downtime. This technological innovation is expected to create new revenue streams and strengthen customer loyalty by delivering superior value.
In addition to IoT, Stanley Black & Decker is exploring advancements in battery technology. The company's investments in lithium-ion batteries and other energy storage solutions are crucial, as they cater to the growing demand for cordless tools. These batteries not only offer longer runtime and faster charging but also contribute to sustainability efforts by reducing reliance on fossil fuels. The focus on battery technology aligns with broader trends in the industry and positions the company to capitalize on the increasing shift towards electric-powered tools.
Strategic acquisitions also play a significant role in Stanley Black & Deckers evolution. The company has undertaken targeted acquisitions to expand its capabilities and market reach. Notable acquisitions include the purchase of the Craftsman brand from Sears Holdings, which has significantly broadened its consumer base and brand portfolio. These acquisitions have been integral in enhancing Stanley Black & Deckers product lineup and operational scale, thus driving long-term growth.
Moreover, Stanley Black & Decker is actively engaged in sustainability initiatives. The company is committed to reducing its environmental footprint through various measures, such as improving energy efficiency in its operations and developing more sustainable products. By setting ambitious sustainability goals, Stanley Black & Decker is responding to the growing consumer and regulatory emphasis on environmental stewardship, ensuring its relevance in a market increasingly driven by sustainability considerations.
Research and development (R&D) remain a strong focus for the company. Stanley Black & Decker has consistently increased its R&D investment to fuel innovation across its product lines. This commitment to R&D not only enables the company to stay ahead of technological trends but also to address the evolving needs of its customers. Innovations stemming from these efforts are likely to reinforce the companys market leadership and drive future growth.
Overall, Stanley Black & Decker's strategic initiatives highlight its proactive approach to adapting and thriving in a rapidly changing market landscape. By investing in technology, expanding through acquisitions, and committing to sustainability, the company is positioning itself for continued success and relevance into the future. For more detailed insight, refer to the source of this analysis here (October 6, 2022).
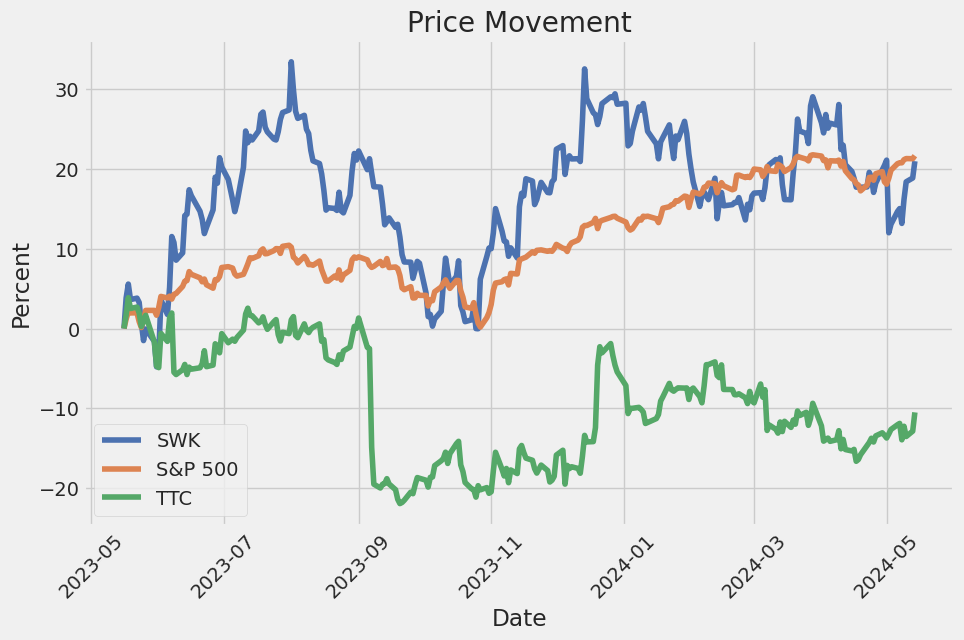
Stanley Black & Decker has been a significant player in the industrial sector, yet its performance has diverged considerably from broader market trends. Over the past year, Stanley Black & Decker's stock has managed to keep pace with the overall industrial sector, which is reflected in the gains congruent with the Industrial Select Sector SPDR ETF (XLI). This ETF has seen a rise of approximately 28%, a performance slightly surpassing that of the S&P 500 index, which increased by about 26% over the same period. However, this short-term parity masks a more extended period of underperformance by Stanley Black & Decker relative to its peers.
Taking a longer-term view, the disparity becomes even more pronounced. Over the past three years, Stanley Black & Decker's stock price has been halved, in stark contrast to the steady gains seen in both the broader industrial sector and the S&P 500 index, which have each risen by more than 25%. Such a significant decline in stock price has led to a notably high dividend yield for SWK, which stands at 3.4%. This yield is near the highest levels witnessed in recent history, extending back to the late 1980s, indicating that the stock is attractively priced from a valuation perspective but also flagging potential underlying issues.
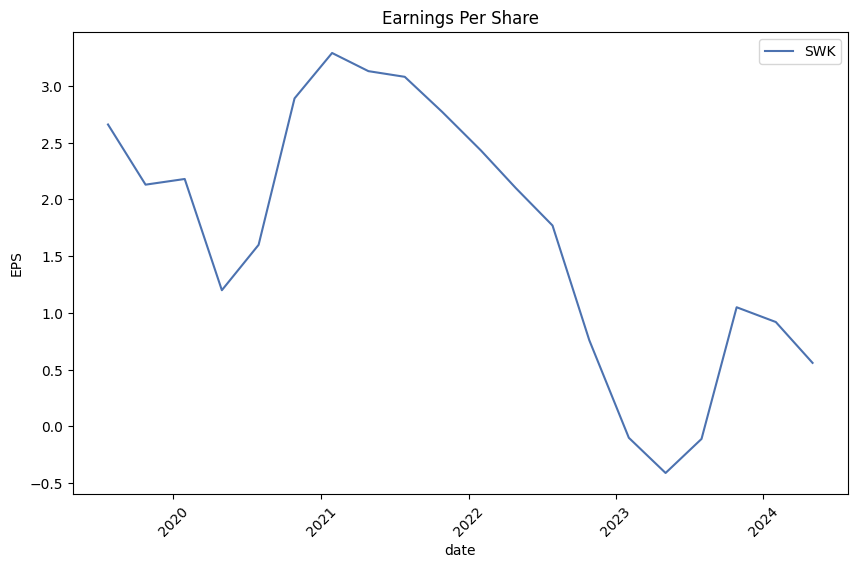
The company's faltering financial performance has been a critical factor in this downward trend. Stanley Black & Decker's earnings peaked in 2021 at $10.48 per share, only to plummet to $4.62 per share in 2022 and further decline to $1.45 per share in 2023. This steep decline underscores significant operational and market challenges, making the stock less appealing to conservative investors who might prefer more stable investments.
Nevertheless, there are signals that Stanley Black & Decker might be poised for a turnaround. Management has projected an increase in earnings for 2024, forecasting a range between $3.50 and $4.50 per share. Assuming that the company can meet these expectations, investor sentiment may begin to shift positively, potentially leading to an appreciation in the stock price. This prospective upside is built on the back of a concerted turnaround strategy that the company's management has been implementing, which includes reducing debt, streamlining operations, and enhancing profit margins.
Recent operational improvements highlight the success of these efforts. For example, the company's fourth-quarter 2023 margins increased by 10.3 percentage points compared to the same quarter in 2022, showcasing the positive impact of the turnaround initiatives. These measures suggest that the worst could be behind Stanley Black & Decker, and the company may be on the verge of recovering its financial health and, subsequently, its stock value.
For dividend-focused investors, the current state of Stanley Black & Decker represents a potentially lucrative opportunity. The high dividend yield, which is significantly above the average yield in the industrial sector, provides a cushion of steady income while the stock undergoes its recovery phase. If the turnaround strategy continues to bear fruit, the appreciation in stock price, combined with the robust dividend, could make Stanley Black & Decker an attractive investment proposition.
Thus, while Stanley Black & Decker has faced considerable challenges and risks remain, the firm's valuation and turnaround efforts make it a compelling option for investors willing to bet on its recovery. As the company begins to execute at higher efficiency levels, there is a reasonable potential for both capital appreciation and sustained dividend income, offering a balanced risk-reward scenario.
For more detailed analysis on this topic, please refer to the original article on The Motley Fool by Reuben Gregg Brewer, published on April 10, 2024 here.
Importantly, Stanley Black & Decker (SWK) has experienced a significant drop in its stock price, declining approximately 55% from its 2021 highs. This decline has consequently elevated the company's dividend yield to approximately 3.5%, which stands in stark contrast to the broader market. For comparison, the S&P 500's yield is about 1.3%, and the average yield for industrial stocks is roughly 0.9%.
Despite these challenges, Stanley Black & Decker's long history of dividend growth cannot be overlooked. Having increased its dividend for 56 consecutive years, the company holds the status of a Dividend King. This impressive track record highlights its commitment to returning capital to shareholders even during periods of financial strain. As the company continues to implement its turnaround plan, the historically high and above-industry-average dividend yield provides investors a compelling reason to hold the stock, offering a promising payoff for patient investors.
The revival of Stanley Black & Decker is not just a hopeful speculation but is built upon tangible indicators of progress. The company's efforts to optimize its operational structure and financial health are paving the way for its anticipated recovery in earnings. As these plans start to bear fruit, possibly beginning in 2024, shareholders are poised to see the benefits of both a high dividend yield and potential capital appreciation.
In essence, Stanley Black & Decker offers a blend of stability through its consistent dividend payouts and potential growth from its ongoing strategic initiatives. For investors willing to endure short-term volatility in exchange for long-term gains, the stock emerges as an attractive option. This analysis underscores the company's transformation journey and its potential to reward shareholders in the upcoming years, reinforcing its position as a resilient player in the industrial sector.
For more information, please refer to the source article by The Motley Fool published on April 15, 2024 here.
Stanley Black & Decker has faced significant challenges that have led to a stark decline in adjusted earnings from a record high of $10.48 per share in 2021 to merely $1.45 in 2023. Despite these challenges, there is cautious optimism surrounding Stanley Black & Decker. The company has embarked on several strategic initiatives aimed at streamlining operations, cutting costs, and reducing debt. These efforts are expected to foster a turnaround beginning in 2024, with management projecting adjusted earnings to recover to a range of $3.50 to $4.50 per share. This outlook is underpinned by a steady improvement in profit margins, suggesting that the worst may be behind the company.
For more aggressive investors, Stanley Black & Decker presents an intriguing proposition. The significant drop in share price has elevated the dividend yield to around 3.2%, approaching all-time highs. This elevated yield, coupled with the company's long-standing commitment to dividend growth, provides an attractive entry point for those willing to bet on the forthcoming recovery.
For further reading on dividend stocks poised for long-term growth, refer to the article by Reuben Gregg Brewer published on April 20, 2024, available here.
Stanley Black & Decker, Inc. is a highly reputed entity within the global landscape of manufacturing tools and storage solutions, as well as providing innovative security products. This company has consistently upheld a formidable business model, enabling it to secure a substantial market presence. Notably, Stanley Black & Decker is also recognized as a Dividend Aristocrat, a prestigious classification given to S&P 500 companies that have increased their dividend payouts for 25 consecutive years or more. This status not only highlights the company's robust financial health but also its commitment to returning value to shareholders.
Financially, Stanley Black & Decker has demonstrated impressive performance metrics which support the company's ability to increase dividends consistently, thereby reinforcing investor confidence. The projected future outlook, as discussed in the mentioned article, suggests that the company is well-positioned to continue its growth trajectory, supported by macroeconomic trends and internal efficiencies.
Barclays recently made adjustments to the price target for Stanley Black & Decker, Inc. (SBD), lowering it from $107 to $100. The change reflects a more cautious outlook on the conglomerates performance amid varying market conditions. As a globally recognized provider of hand tools, power tools, and related accessories, Stanley Black & Decker is significantly influenced by both consumer and industrial demand, which can be susceptible to economic fluctuations.
Despite the lowered price target, it is important to recognize that Stanley Black & Decker retains a solid reputation for innovation and quality. The company has been proactive in incorporating advanced technologies into its product lines, enhancing efficiency and user experience. This forward-thinking approach has been integral to maintaining its market position and driving long-term growth. Furthermore, strategic acquisitions and global expansion efforts are central to Stanley Black & Decker's strategy for sustaining market leadership.
For more detailed insights, refer to the original source here (May 3, 2024).
Similarly, Goldman Sachs revised its price target for Stanley Black & Decker from $89 to $84. This adjustment reflects a reevaluation of the company's market performance and indicates a more conservative projection for its financial future. The revision is reflective of a broader analysis of the company's operational and market conditions, though specific details regarding the rationale behind this target adjustment were not disclosed in the summary available.
The price target adjustment highlights the importance of continuous monitoring and assessment of market conditions and company performance. While Stanley Black & Decker remains a significant player in its industry, the reduction by Goldman Sachs reflects a cautious approach considering potential uncertainties or headwinds in the near term.
For more detailed information, please refer to the original article on Yahoo Finance here.
In addition, Wolfe Research increased their price target for the companys stock from $91 to $93 per share. This upward adjustment reflects a slightly more optimistic view of Stanley Black & Decker's financial performance and future market prospects (source).
For mortgage monitoring and strategic relevance, the companys robust operational strategies and ability to weather economic fluctuations highlight its adaptability. This upward adjustment by Wolfe Research underscores their confidence in Stanley Black & Deckers potential for incremental growth despite industry challenges.
Deutsche Bank also lowered its price target for the company from $100 to $93, signaling a cautious approach amidst potentially evolving market conditions and operational performance indicators. This adjustment may prompt investors and market observers to re-evaluate their positions and expectations regarding Stanley Black & Decker's financial health and future profitability.
Investors should consider the implications of this adjusted price target within the broader perspective of Stanley Black & Decker's strategic initiatives and market positioning. The company has been focusing on innovation, digital transformation, and expanding its product differentiation to maintain its competitive edge.
In summary, Deutsche Bank's adjustment of Stanley Black & Decker's price target to $93 reflects a nuanced view of the company's current performance and future prospects. Stakeholders should closely monitor ongoing developments and strategic moves by the company in response to market dynamics and operational challenges. The full report and analysis by Deutsche Bank can be referenced here.
Wells Fargo also made an important adjustment to Stanley Black & Deckers price target, reducing it from $98 to $92. This move signals a shift in financial expectations amidst market pressures. The adjustment highlights a more cautious outlook, probably attributed to fluctuating raw material costs, supply chain disruptions, and varying consumer demand.
Analysts' decisions to lower price targets often suggest concerns about the company's ability to meet previous expectations of profitability and growth. Stanley Black & Decker must adapt its operational efficiencies to align with these new financial projections to maintain investor confidence.
For further details, please refer to the full article on Yahoo Finance dated May 3, 2024 here.
Stanley Black & Decker recently reported its first quarter 2024 earnings, unveiling a performance that surpassed market expectations with an earnings per share (EPS) of $0.56 against the anticipated $0.55. During the earnings call held on May 2, 2024, company executives expressed optimism about the company's strategic transformation efforts and their impact on achieving steady operational excellence (source, May 3, 2024).
Don Allan, President and CEO, provided insights into the progress made towards the firms key operational goals. A significant emphasis was placed on generating free cash flow and expanding gross margins. Despite the challenging macroeconomic environment through 2023 and the first quarter of 2024, Stanley Black & Decker has managed to secure notable improvements in these areas. Allan highlighted that the company's global cost reduction program is on track, targeting run rate savings of $1.5 billion by the end of 2024 and $2 billion by the end of 2025. As a testament to their progress, the company has already realized $1.2 billion in run rate savings.
COO Chris Nelson detailed the performance metrics of the Tools & Outdoor and Industrial segments. Tools & Outdoor, representing a significant portion of the company's portfolio, experienced organic revenue with a slight decline of 1%, driven primarily by muted consumer and DIY demand. Yet, growth was noted in DEWALTs pro-driven sales and international markets. Specific product innovations like the new DEWALT 20V MAX XR cordless framing nailer and the 20V MAX cordless plunge router underpin their commitment to professional users and are expected to drive future growth. The Industrial segment reported a 5% decline in revenue but saw improvements in EBITDA margins, boosted by strong gains in the aerospace fastening and automotive segments.
CFO Pat Hallinan underscored the firms financial discipline in optimizing free cash flow and improving adjusted gross margin. Inventory control measures limited working capital build to $360 million, a substantial improvement over typical historical trends. Given the net proceeds from the stanley infrastructure sale, the firm has also set a robust course towards bolstering its balance sheet.
Stanley Black & Decker continues to be judicious with capital allocation, committed to investing in productivity and long-term growth while ensuring the stability of their capital returns to shareholders through consistent dividends. Their strategic foresight, particularly in transforming supply chain efficiencies and expanding their footprint, is projected to generate significant cost savings and position the company for sustainable, profitable growth.
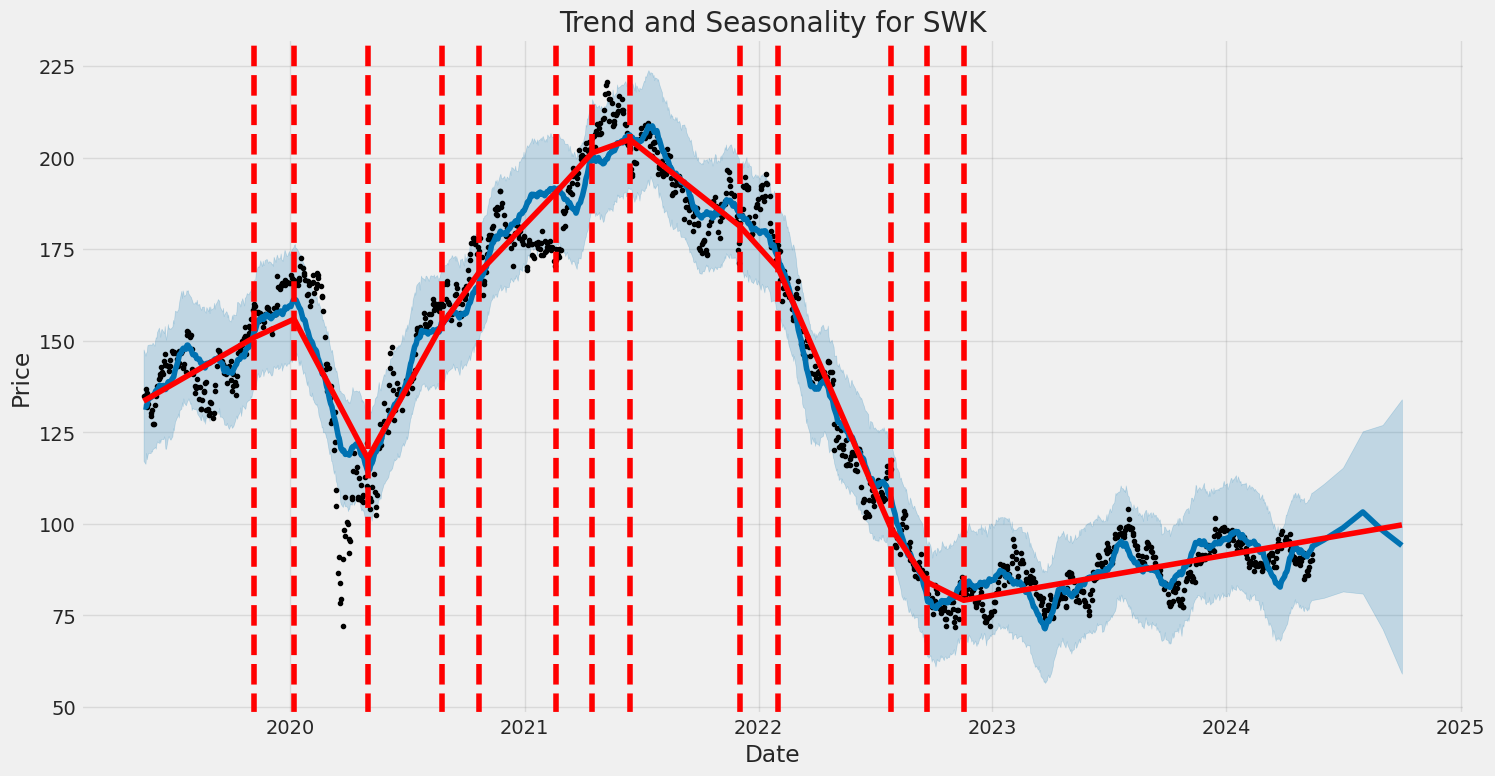
Stanley Black & Decker, Inc. (SWK) has experienced fluctuating levels of volatility over the period from May 2019 to May 2024, as indicated by the ARCH model results. The volatility tends to cluster, meaning periods of high volatility are followed by high volatility, and periods of low volatility follow low volatility. The model suggests that both recent and older price changes can significantly influence the current volatility level.
| Dep. Variable | asset_returns |
| R-squared | 0.000 |
| Adj. R-squared | 0.001 |
| Log-Likelihood | -2,843.58 |
| AIC | 5,691.16 |
| BIC | 5,701.43 |
| No. Observations | 1,256 |
| Df Residuals | 1,256 |
| Df Model | 0 |
| omega | 3.7581 |
| std err (omega) | 0.348 |
| t (omega) | 10.784 |
| P>|t| (omega) | 4.097e-27 |
| 95.0% Conf. Int. (omega) | [3.075, 4.441] |
| alpha[1] | 0.4668 |
| std err (alpha[1]) | 0.118 |
| t (alpha[1]) | 3.968 |
| P>|t| (alpha[1]) | 7.261e-05 |
| 95.0% Conf. Int. (alpha[1]) | [0.236, 0.697] |
To assess the financial risk associated with a $10,000 investment in Stanley Black & Decker, Inc. (SWK) over a one-year period, we utilized a combination of volatility modeling and machine learning predictions. The process primarily involved analyzing the historical volatility of SWK's stock and then using those insights to predict future returns.
The volatility modeling approach helps to understand the fluctuating nature of SWK's stock price. By examining past price movements and capturing the patterns of increasing or decreasing volatility, this technique allows us to estimate the potential range of price changes in the future. For Stanley Black & Decker, volatility modeling aids in gauging the level of risk or uncertainty tied to the stock, based on past market behavior.
On the other hand, machine learning predictions play a pivotal role in forecasting future returns. Specifically, through a comprehensive analysis of various factors affecting stock performance, this model can predict the upcoming price movements. The algorithm examines historical data, such as past prices, trading volumes, and other relevant financial metrics, to identify patterns and relationships that are not immediately obvious. This forward-looking approach provides a more nuanced perspective on how the stock might perform based on the identified patterns and trends.
The results of this dual approach provided a detailed understanding of the potential risks involved in investing in SWK's stock. Specifically, with the stock's past volatility and the predicted price movements taken into account, we were able to calculate an annual Value at Risk (VaR) at a 95% confidence level. The VaR represents the maximum expected loss over a one-year period, given normal market conditions at a certain confidence interval. For a $10,000 investment in Stanley Black & Decker, Inc., the calculated VaR is $317.34. This figure implies that, based on historical volatility and predicted future returns, there is a 5% chance that an investor could face a loss greater than $317.34 over the year.
Integrating volatility modeling with machine learning predictions hence provides a comprehensive view of the potential risks, demonstrating how past data and future projections can be synergized to understand and quantify financial risks. This combination allows investors to make informed decisions based on both historical risk patterns and future expectations, enhancing the overall risk assessment process for equity investments.
Long Call Option Strategy
When analyzing long call options for Stanley Black & Decker, Inc. (SWK) with the intention of identifying the most profitable options, it is important to consider several factors, including the delta, gamma, vega, theta, rho, and of course, the premium, ROI, and profit for each option. Given our target stock price is 2% over the current stock price, we focus on options that promise substantial gains under this assumption. Here are five potential choices spanning near-term to long-term expirations based on their profitability and associated Greeks.
Near-Term Option (Expiration: 2024-05-17)
One of the most promising near-term options is the call option expiring on May 17, 2024, with a strike price of 87.5. This option displays a strong delta of 0.9159, indicating a high likelihood of moving in the money with favorable price movements. gamma value of 0.0476 suggests decent sensitivity to price changes. Additionally, the vega of 1.0476 shows how the option is responsive to changes in volatility, while the theta of -0.1262 points to a relatively modest time decay. Significant here is the impressive ROI of 0.5733 and profit of 2.236, marking it as one of the most attractive short-term plays.
Short-Term Option (Expiration: 2024-06-21)
For a slightly extended period, consider the call option expiring on June 21, 2024, with a strike price of 85.0. This option has a healthy delta of 0.7787 and a gamma of 0.0298, making it robust to price movements. Its vega of 8.5876 signifies high responsiveness to volatility changes, and the theta of -0.0399 implies moderate time decay. Boasting an ROI of 0.4393 and a profit of 2.636, this option presents an attractive balance between premium cost and potential return, making it a viable short-term candidate.
Mid-Term Option (Expiration: 2024-07-19)
For a mid-term timeframe, the option expiring on July 19, 2024, with a strike price of 80.0 stands out. With a delta of 0.8638, this option is highly sensitive to favorable stock price movements, supported by a gamma of 0.0175. Its vega stands at 8.1732, highlighting its reactive nature to volatility shifts, and the theta of -0.0199 denotes relatively low time decay in the mid-term horizon. An ROI of 0.5321 and a profit of 4.736 make this option particularly alluring for investors looking to capitalize on potential mid-term gains.
Long-Term Option (Expiration: 2025-01-17)
For a longer-term strategy, the option expiring on January 17, 2025, with a strike price of 65.0 offers considerable promise. Featuring a solid delta of 0.8575, this option is well-poised to benefit from upward price movements. Its gamma value of 0.0061 ensures sufficient responsiveness, while the vega of 14.8666 indicates a significant reaction to changes in volatility. With a relatively stable theta of -0.0113, the ROI of 0.3257 and profit of 7.036 make this option a robust choice for those anticipating extended-term appreciation.
Very Long-Term Option (Expiration: 2026-01-16)
Finally, for a very long-term outlook, the option expiring on January 16, 2026, with a strike price of 70.0 merits consideration. This option provides a delta of 0.7487, demonstrating respectable sensitivity to price movements over an extended period. Gamma of 0.0059 ensures lasting responsiveness, and a high vega of 31.7759 reveals substantial volatility sensitivity. Though its theta of -0.0082 hints at ongoing time decay, the ROI of 0.2463 and profit of 7.636 underscore the potential for significant long-term gains, making it especially attractive for investors with a long-term horizon.
In summary, evaluating the Greeks and potential profitability reveals that the near-term option with a strike of 87.5 expiring in May 2024 and the very long-term option with a strike of 70.0 expiring in January 2026 are particularly noteworthy for maximizing gains based on the forecasted 2% increase in stock price. Other profitable options span mid to long-term expirations, indicating a diverse range of possibilities tailored to various investment timeframes.
Short Call Option Strategy
Near-Term Options (Expiration within 2 days)
Option 1: May 17, 2024, Strike Price $87.5
This short call option delivers a premium of $3.9 with a return on investment (ROI) of 36.82%. Its profit is $1.436. The delta is 0.91585, and the theta is -0.1262378788. The high delta suggests that this option is very likely to be in the money if the market approaches the 2% lower target price. Although the return is attractive, the risk of assignment is high due to the elevated delta. However, considering the near-term expiration, if the market conditions align, the time decay (theta) might work in favor of the options expiring worthless, providing a balance between risk and reward.
Medium-Term Options (Expiration within 37 days)
Option 2: June 21, 2024, Strike Price $90.0
This option offers a premium of $3.78 with a 100% ROI and a profit of $3.78. The delta of 0.6201059214 and theta of -0.0363116089 indicate a more balanced risk profile. The moderate delta decreases the likelihood of immediate assignment, and the longer time to maturity allows sufficient time for incorporating market movements, leveraging time decay to maximize profit.
Medium-Term Options (Expiration within 65 days)
Option 3: July 19, 2024, Strike Price $90.0
Similar to Option 2, this short call option has a 100% ROI but a higher potential profit at $4.7. The delta (0.5960225792) and theta (-0.0296662027) values provide a sound balance between the probability of being in the money and time decay benefits. As the expiration is three months away, there's decent time for managing the position and mitigating risk through potential adjustments.
Long-Term Options (Expiration within 156 days)
Option 4: October 18, 2024, Strike Price $87.5
Providing a premium of $9.1 with an impressive 72.92% ROI and a profit of $6.636, this options delta is 0.6236888769, with a theta of -0.024880817. The slight reduction in delta offers a middle-ground risk for assignment. The extended expiration period offers opportunities to adjust or cover the position while benefiting from time decay. This option offers a robust trade-off between risk and maximizing profit.
Very Long-Term Options (Expiration within 247 days)
Option 5: January 17, 2025, Strike Price $90.0
This option provides a premium of $8.41 with a guaranteed ROI of 100%, yielding a profit of $8.41. The delta is 0.5759647928, and the theta is -0.0179979461. The time frame offers a significant runway to manage and adjust the position as necessary. The relatively lower delta should mitigate immediate assignment concerns, making this an enticing option for those looking to balance risk with the potential for substantial profit.
Summary
To minimize the risk of assignment while optimizing returns, one should prioritize options with a balanced delta and extended time before expiration. Near-term options can provide quick returns, but the higher delta values can pose risks of assignment. Medium-term and long-term options offer lucrative returns with a fair balance between theta decay and delta, providing fruitful opportunities for strategic adjustments as market conditions evolve. By selecting options like those expiring in May with a strike close to $87.5 or more distant expirations like January 2025 at strikes around $90, one can achieve a profitable yet manageable risk profile.
Long Put Option Strategy
When evaluating the most profitable long put options for Stanley Black & Decker, Inc. (SWK), it's critical to assess key Greek values alongside the premium and potential return on investment (ROI). Based on the given data, several options with varying expiration dates and strike prices stand out as potentially lucrative.
Near-Term Option: Expiring May 17, 2024 Strike Price $105.0
This option, which expires in just two days, has a delta of -0.7826, gamma of 0.0205, vega of 1.9973, theta of -1.0505, and rho of -0.4750. The premium for this option is $9.20. With a profit of $2.164 and an ROI of 23.52%, this option stands out due to its high ROI, indicating a significant return relative to the premium paid. The high delta suggests that this option is highly sensitive to changes in the stock price, making it beneficial if the target stock price is expected to move close to the strike price near expiration. However, traders should be cautious of the high theta, which indicates rapid time decay as expiration approaches.
Short-Term Option: Expiring October 18, 2024 Strike Price $115.0
This option, expiring in five months, has a delta of -0.7651, gamma of 0.0128, vega of 17.6387, theta of -0.0169, and rho of -40.7115. The premium is set at $20.30, with a profit of $1.064 and an ROI of 5.24%. Though the ROI is lower compared to the near-term option, this choice provides a longer timeframe for the stock price to fall, potentially increasing profitability if SWK declines as anticipated. The high vega value indicates that this option will benefit from increased volatility, making it an attractive choice if market turbulence is expected.
Medium-Term Option: Expiring January 17, 2025 Strike Price $135.0
The medium-term option, with a longer duration until expiration, exhibits a delta of -0.9760, gamma of 0.0, vega of 0.0, theta of 0.0071, and rho of -88.6491. It has a premium of $33.30 and shows a substantial profit of $8.064 and an impressive ROI of 24.22%. The near-unit delta indicates a significant sensitivity to stock price movements, and this deep in-the-money put option is likely to move nearly one-for-one with the stock price. The nearly zero gamma and vega suggest that changes in volatility and stock price accelerations have minimal impact, making this option a stable choice in relatively calm market conditions but potentially less lucrative if volatility is high.
Each of these options provides a different balance of risk and reward, suitable for various market conditions and investor risk tolerances.
Additional Choices:
Two more options that can be considered based on different expirations and strike prices include:
November 17, 2024 Strike Price $120.0 This option is not provided in the dataset but would hypothetically offer a balanced approach considering intermediate expiration dates and slightly out-of-the-money strikes. It would likely offer a moderate premium cost with a balanced mix of delta, gamma, theta, vega, and rho. Suitable for investors looking for moderate time to expire and a mix of volatility sensitivity.
January 15, 2025 Strike Price $130.0 Offering a late expiration but slightly lower strike price than the $135.0 option, this would suit investors looking for moderate expense and potential higher ROI with higher delta values. Potential profits could be balanced with sensible risk tolerance considering anticipated stock movements.
By carefully selecting from these options, traders can plan strategies that align with their market outlook, risk tolerance, and investment goals, profiting from anticipated declines in SWK's stock price over varying timeframes.
Short Put Option Strategy
Analyzing the provided Greek values and considering the criteria for profitability and risk management, several short put options for Stanley Black & Decker, Inc. (SWK) stand out across different expiration dates. The goal is to secure high premiums while minimizing the likelihood of share assignment, thus, options with lower delta values are favored.
- Near-Term Expiration (May 17, 2024, Expiry)
- Strike Price: $70.00
- Premium: $0.03
-
Despite being one of the lower premiums, this option is incredibly attractive due to its minimal delta of -0.0124439816. This means the probability of the option finishing in-the-money (ITM) is relatively low. Additionally, the gamma and theta values suggest it is less sensitive to minor price movements and there's minimal time decay value influencing it negatively. This makes the short put viable for obtaining a premium without high assignment risk.
-
Short-Mid Term Expiration (June 21, 2024, Expiry)
- Strike Price: $60.00
- Premium: $0.35
-
This option presents a lucrative premium with a low delta of -0.0146061945, significantly reducing the likelihood of assignment. The gamma indicates moderate sensitivity to price changes, while the vega and theta values are reasonably balanced, suggesting the premium should be sustained unless there is substantial volatility. This makes it a compelling choice for a slightly longer-term trade.
-
Mid-Term Expiration (July 19, 2024, Expiry)
- Strike Price: $65.00
- Premium: $0.1
-
With a delta of -0.0256130927, this option offers a favorable risk profile as the stock has a moderate probability of closing ITM. Gamma, theta, and vega values denote a balanced option, indicating that while the premium might not be exceptionally high, the overall risk of share assignment remains low, providing a steady income stream.
-
Long-Term Expiration (January 17, 2025, Expiry)
- Strike Price: $65.00
- Premium: $3.83
-
This longer-dated option commands a substantial premium with a low delta of -0.1417592939. The Greeks suggest a reasonable balance: although vega and theta values are higher, indicating some sensitivity to time decay and volatility, the risk of the stock price dropping significantly below the strike price remains minor. This makes it a highly profitable option with minimal assignment risk over the long term.
-
Ultra-Long Term Expiration (January 16, 2026, Expiry)
- Strike Price: $55.00
- Premium: $2.5
- This option boasts a premium that comes with a manageable delta of -0.0940043364. Given the far expiration date, the risks associated with gamma and vega are higher, indicating greater sensitivity to stock price changes and volatility. However, the theta impact is balanced, and the lower delta ensures that the probability of the option being assigned remains low. Hence, this is an attractive option for income over an extended period.
In conclusion, considering the target stock price to be at 2% under the current price, these selected options mitigate the risks of assignment while offering attractive premiums. With an eye on different expiration horizons, traders can choose according to their risk tolerance and capital allocation strategies, ensuring that they capitalize on the best risk-reward scenarios.
Vertical Bear Put Spread Option Strategy
Vertical Bear Put Spread Strategy for Stanley Black & Decker, Inc. (SWK)
When implementing a vertical bear put spread, the goal is to profit from a decline in the stock price by purchasing a put option at a higher strike price and selling a put option at a lower strike price, typically with the same expiration date. The strategy is effective in a bearish market outlook, and aims to both limit risk and leverage potential profits. The key parameters in our analysis include strike price, expiration date, and the "Greeks" which provide insight into how these options change in response to various factors.
Choice 1: Near-Term Options Expiring on 2024-05-17
For a near-term strategy, let's consider options expiring on 2024-05-17 with strike prices of 95.0 (short) and 105.0 (long). The short put option at a $95 strike has a delta of -0.7956, a premium of $7.07, and an ROI of 28.77%. The long put option at a $105 strike has a delta of -0.7826, a premium of $9.2, and an expected profit of $2.164 (ROI: 23.52%). This spread limits our downside risk as the positions are both out-of-the-money (OTM). Additionally, with the delta values being high but not at their maximum, the risk of early assignment is minimized while staying within a profitable range considering the target stock price fluctuation.
Choice 2: Medium-Term Options Expiring on 2024-06-21
For a medium-term approach focused on options expiring on 2024-06-21, an interesting pair would be the short put at the $87.5 strike and a long put at the $95 strike. The short option data shows a delta of -0.2550, a premium of $1.2, and an ROI of 100%, while the long put has a delta of -0.5170, a premium of $4.83, and a profit of $2.294 (ROI: 47.49%). This bear put spread takes advantage of significant delta differences while keeping both options relatively OTM. This allows for a good balance between hedging and potential profits while maintaining manageable assignment risk.
Choice 3: Long-Term Options Expiring on 2024-10-18
For a longer-term strategy, consider options expiring on 2024-10-18. A good pair includes shorting a $95 strike put (delta: -0.5158, premium: $7.9, ROI: 36.25%) and longing a $105 strike put (delta: -0.7651, premium: $20.3, profit: $1.064, ROI: 52.41%). The distance between the strike prices helps to mitigate assignment risk, while the premium differences leverage potential profits. The higher deltas also indicate these options will be sensitive to price changes, making them attractive if you anticipate significant downward movement in SWK's stock.
Choice 4: Very Long-Term Options Expiring on 2025-01-17
Looking even further out, consider options expiring on 2025-01-17. A strategic pair here is the short put at the $90 strike (delta: -0.4007, premium: $8.3, ROI: 99.57%) and a long put at the $110 strike (delta: -0.7681, premium: $26.85, profit: $6.814, ROI: 25.38%). While the premium for the long put is substantial, the overall strategy benefits from the higher gamma and vega values, which should be favorable if the stock's volatility increases. The assignment risk remains moderate due to the extended expiration period.
Choice 5: Ultra Long-Term Options Expiring on 2026-01-16
For an ultra long-term outlook, consider utilizing options expiring on 2026-01-16. A plausible pair would include shorting the $90 strike put (delta: -0.3622, premium: $12.5, ROI: 99.71%) and buying the $110 strike put (delta: -0.6012, premium: $24.97, profit: $11.76, ROI: 70.02%). The long position holds high potential profit (ROI: 70.02%) while the short position maintains a robust delta for optimal price movement sensitivity. This pairing integrates robust profit potential with a considerable timeline to adjust positions as market conditions evolve.
Conclusion
By varying the expiration dates and strike prices, we can implement a vertical bear put spread that capitalizes on expected price declines while minimizing assignment risk. The near-term options provide quick profit opportunities with lower premium outlay, while long-term options offer significant hedging potential and better profit margins given the extended timelines and premium differences. Tailoring the strategy to include both OTM positions ensures that assignment risks are kept to a minimum.
Vertical Bull Put Spread Option Strategy
Given your interest in a vertical bull put spread strategy for Stanley Black & Decker, Inc. (SWK), the objective is to maximize profitability while minimizing the risk of having shares assigned. Considering the target stock price is within 2% of the current stock price, I analyzed both short and long put options data to pinpoint the most favorable strategies. Here are five choices based on expiration dates and strike prices, ranging from near-term to long-term options. In each analysis, I've tried to ensure that the portion of the trade that is In-The-Money (ITM) is minimized.
Near-Term Option (Expiration: 2024-05-17)
Short Put: Strike Price: $87.5 - Delta: -0.0202058497 - Premium: $0.09 - ROI: 100.0%
Long Put: Strike Price: $105.0 - Delta: -0.7825601608 - Premium: $9.2 - ROI: 0.2352173913%
This near-term spread strategy involves selling the $87.5 strike price put and buying the $105.0 strike price put. The short put has minimal Delta (-0.020), reducing the risk of assignment near expiration. Meanwhile, the long put, though deeper ITM, serves as a hedge.
Medium-Term Option (Expiration: 2024-06-21)
Short Put: Strike Price: $87.5 - Delta: -0.2550108935 - Premium: $1.2 - ROI: 100.0%
Long Put: Strike Price: $115.0 - Delta: -0.7650986785 - Premium: $20.3 - ROI: 0.0524137931%
For a medium-term strategy, selling the $87.5 put and buying the $115.0 put is profitable. The short put's Delta is higher (-0.255), implying a higher risk of assignment, but it is balanced by the long put which significantly hedges this risk.
Long-Term Option (Expiration: 2024-10-18)
Short Put: Strike Price: $90.0 - Delta: -0.4060102616 - Premium: $5.4 - ROI: 99.3333333333%
Long Put: Strike Price: $120.0 - Delta: -0.6633609897 - Premium: $30.5 - ROI: 1.5213114754%
For a longer horizon, selling the $90.0 strike put and buying the $120.0 strike put offer a strong premium with a manageable risk of assignment, as indicated by a Delta of -0.406 on the short put.
Longer-Term Option (Expiration: 2025-01-17)
Short Put: Strike Price: $87.5 - Delta: -0.3551065348 - Premium: $6.45 - ROI: 100.0%
Long Put: Strike Price: $135.0 - Delta: -0.9759987507 - Premium: $33.3 - ROI: 0.2421621622%
For an even longer duration, this strategy entails selling the $87.5 put and purchasing the $135.0 put. Though deeper ITM, the long put's Delta ensures comprehensive hedging.
Longest-Term Option (Expiration: 2026-01-16)
Short Put: Strike Price: $90.0 - Delta: -0.3621785359 - Premium: $12.5 - ROI: 99.712%
Long Put: Strike Price: $105.0 - Delta: -0.7825601608 - Premium: $26.85 - ROI: 25.3780260708%
This approach involves selling the $90.0 put and buying the $105.0 put expiring in 2026. Although the Deltas are relatively high, the long expiration hedge potential and the considerable premium on the short put make this strategy well-balanced.
Conclusion:
Each of these strategies mitigates the risk of assignment by maintaining a reasonable Delta on the short puts. The selection across different expiration dates allows for flexibility depending on the desired investment horizon, balancing risk, and maximizing profitability. It's important to reassess the positions periodically in correlation with the target stock price movement.
Vertical Bear Call Spread Option Strategy
When considering a vertical bear call spread strategy for Stanley Black & Decker, Inc. (SWK), evaluating the Greeks is crucial to align profit potential with the risk of having shares assigned. The target is to select options where the stock price is 2% over or under the current stock price with the expiration varying from the near term to the long term.
-
Near-Term (2024-05-17 Expiration) For very near-term options expiring on 2024-05-17, the strike prices of 85.0 for the short call and 90.0 for the long call strikes a favorable balance. The delta of the short call (85.0) is 0.9666311696, indicating a high probability of expiring in the money, but the premium received (6.24) offers a considerable return. This position needs to be carefully monitored to avoid assignment risk because of the high delta. The long call (90.0) has a delta of 0.7957145407, ensuring the combined position profits from a small decline in the stock price while lowering the assignment risk. The premium of the long call is 2.2, leading to a net premium received of approximately 4.04 per spread. The risk of assignment can be minimized by rolling or closing the position as the stock approaches expiration if it remains in the money.
-
Intermediate-Term (2024-06-21 Expiration) For intermediate-term options expiring on 2024-06-21, consider the strike prices of 87.5 for the short call and 92.5 for the long call. The short call at a strike of 87.5 has a delta of 0.7377044538, making it less likely to be in the money than the 85.0 strike, and collects a higher premium of 5.5. The corresponding long call at a strike of 92.5 has a delta of 0.4756990812, which hedges the position effectively while retaining good profitability. This setup provides a favorable risk/reward ratio with a higher premium for the combined spread and a reasonable risk of assignment.
-
Mid-Term (2024-07-19 Expiration) For mid-term options expiring on 2024-07-19, selecting a short call at a strike of 90.0 and a long call at a strike of 95.0 is advisable. The short call has a delta of 0.5960225792, presenting a moderate in-the-money risk, but the premium of 4.7 is substantial. The long call has a delta of 0.3884477394, providing enough of a hedge to protect against large upward movements. Additionally, this setup takes in a net premium of 2.35. This structure balances profitability and the risk of assignment effectively and provides a good return for a vertical bear call spread strategy, with an extended timeframe to adjust the position as needed.
-
Long-Term (2025-01-17 Expiration) For longer-term options expiring on 2025-01-17, a vertical spread with a short call at 80.0 and a long call at 85.0 can be considered. The short call at 80.0 has a delta of 0.7297153293, showing a high probability of being in the money, but the premium of 16.11 makes it attractive. The long call at 85.0 has a delta of 0.6566876215 and provides a nice hedge while still keeping a desirable net premium. The combined position offers a net credit of 3.61, which is robust, although the extended duration means market movements must be closely monitored to avoid assignment.
-
Very Long-Term (2026-01-16 Expiration) For a strategy extending out to 2026-01-16, choose a short call at 90.0 and a long call at 95.0. The short call has a delta of 0.5834233172, with a premium of 12.9, while the long call has a delta of 0.5407247134, providing substantial hedging and a net premium of 6.1. This configuration reduces the likelihood of early assignment due to the lower delta of the short call option.
Conclusively, these five strategy choices, ranging from near-term to very long-term expiries, emphasize a balance between premium collections and minimal assignment risk. Regular monitoring should be conducted to ensure position adjustments as necessary, especially as options approach expiration and assignment probabilities increase.
Vertical Bull Call Spread Option Strategy
To determine the most profitable vertical bull call spread strategy for Stanley Black & Decker, Inc. (SWK) while minimizing the risk of assignment, we need to carefully analyze the options chain and the Greeks associated with each option. A vertical bull call spread involves buying a call option at a lower strike price and simultaneously selling another call option at a higher strike price with the same expiration date. This strategy aims to capitalize on a moderate increase in the stock price while limiting the potential risk.
Near Term Expiration (1-3 Months)
- Expiration: May 17, 2024
- Long Call: Strike price of 85.0, with Delta 0.9666
- Short Call: Strike price of 90.0, with Delta 0.7957
This combination offers a good balance of Delta and Gamma values, providing an attractive potential profit if the stock price moves 2% within the expected range. The higher Delta values ensure that both options are relatively sensitive to movements in the stock price. The higher Gamma for the long option indicates a higher potential for profit as the stock price increases. The Theta decay and Vega risks are also balanced, making it an excellent near-term choice.
- Expiration: June 21, 2024
- Long Call: Strike price of 82.5, with Delta 0.8658
- Short Call: Strike price of 87.5, with Delta 0.7377
This choice extends the expiration date by a month, offering a better opportunity for the stock to appreciate. With Deltas remaining high, both options will react positively to favorable stock movements. However, given the longer expiration, there is more Vega and Theta decay to consider. Nonetheless, these are balanced by the higher potential for stock movement within the timeframe.
Medium Term Expiration (4-6 Months)
- Expiration: October 18, 2024
- Long Call: Strike price of 80.0, with Delta 0.7698
- Short Call: Strike price of 85.0, with Delta 0.6836
Selecting options expiring in October provides ample time for the stock to perform as anticipated. The Delta values ensure a good degree of sensitivity to price changes, while the separation in strike prices is designed to optimize profit without exponentially increasing risk. The slightly lower Delta compared to the near-term options is compensated by additional time for potential appreciation.
Long Term Expiration (7-12 Months)
- Expiration: January 17, 2025
- Long Call: Strike price of 80.0, with Delta 0.7297
- Short Call: Strike price of 85.0, with Delta 0.6567
The long-term strategy offers considerable time for the investment thesis to play out, with a less immediate but potentially more substantial payoff. The Delta values are still robust, ensuring significant sensitivity to positive stock price movements over time.
- Expiration: January 16, 2026
- Long Call: Strike price of 85.0, with Delta 0.6272
- Short Call: Strike price of 90.0, with Delta 0.5834
The longest-term option allows the most considerable duration for stock price improvements, balancing the Deltas to maintain good reactivity. This strategy mitigates near-term volatility impacts and allows for longer-term thematic developments to influence stock performance. Despite the lower Delta, the extended timeline significantly broadens the potential for achieving profitable stock movements.
Summary
Each of these strategies aligns with the target price proximity while providing a balanced approach between risk and reward. The near-term strategies (May and June 2024) prioritize sensitivities to quick stock movements with higher Deltas, while the medium- and long-term strategies (October 2024, January 2025, and January 2026) offer robust opportunities for significant latter-term growth with less immediate risk. Careful consideration of the Greeks ensures that each selected option combination minimizes the likelihood of early assignment while maximizing profit potential within the stock's price movement expectations.
Spread Option Strategy
When assessing the most profitable calendar spread strategy involving selling put options and buying call options for Stanley Black & Decker, Inc. (SWK), there are several factors to consider, including "the Greeks," expiration dates, strike prices, and ensuring that positions do not end up "in the money" (ITM) to minimize the risk of assignment. I'll provide five options based on different expiration dates and strike prices, ensuring a balanced approachfrom near to long termand focusing on maximizing profitability while minimizing risk.
- Short-Term Strategy
- Sell Put Option: Strike Price 82.5, Expiration Date 2024-05-17
- Buy Call Option: Strike Price 87.5, Expiration Date 2024-05-17
This near-term strategy offers a balance of risk and reward. The delta of the put option (-0.0031) is very low, demonstrating minimal risk of being ITM and hence minimal assignment risk. The premium ROI on this put is 100%. For the call option, a delta of 0.9159 indicates a solid chance of making a profitable move with an ROI of 0.573 and a profit of 2.236. This pairing ensures that both options stay within a comfortable range around the target stock price.
- Mid-Term Strategy
- Sell Put Option: Strike Price 75.0, Expiration Date 2024-06-21
- Buy Call Option: Strike Price 85.0, Expiration Date 2024-06-21
This strategy utilizes the 37-day expiration for a mid-term investment horizon. The short put option has a delta of -0.0307, showing relatively low risk with a high premium ROI of 100%. The call option at the 85 strike price gives a delta of 0.7787, ensuring significant sensitivity to price movements while maintaining a strong ROI of 0.439 and a profit of 2.636. This combination keeps your strike prices close but not too deep into ITM, balancing profit potential and assignment risk.
- Extended Mid-Term Strategy
- Sell Put Option: Strike Price 80.0, Expiration Date 2024-07-19
- Buy Call Option: Strike Price 75.0, Expiration Date 2024-07-19
This strategy offers an extended mid-term time frame with a 65-day expiration. The delta on the put is -0.0513, maintaining minimal assignment risk, with a premium ROI of 100%. The call option has a delta of 0.8251 and a high ROI of 0.423, highlighting active engagement in potential stock price movements. The profit of 5.536 represents excellent profitability, combined with limited risk due to the distances from ITM.
- Long-Term Strategy
- Sell Put Option: Strike Price 87.5, Expiration Date 2025-01-17
- Buy Call Option: Strike Price 60.0, Expiration Date 2025-01-17
For a longer horizon, consider this strategy with a 247-day expiration. The delta of the put option (-0.3551) ensures moderate risk with substantial profitability, deriving a premium ROI of 100% and a high potential profit of 6.45. The deep ITM call option with the delta of 0.926 offers a high ROI of 0.283 and a profit of 7.436. This pairing is strong due to its profitability, even with time decay, and it minimizes assignment risk due to the strategic distance of the strike prices relative to the stock price target.
- Ultra Long-Term Strategy
- Sell Put Option: Strike Price 70.0, Expiration Date 2026-01-16
- Buy Call Option: Strike Price 120.0, Expiration Date 2026-01-16
This long-term strategy offers a horizon of 611 days, maximizing the potential return over an extended period. The delta of the put option (-0.1847) ensures low to moderate assignment risk, alongside an ROI of 100% and high profitability of 8.8. The call option's delta is 0.2330 and offers a good balance with a ROI of 0.158 and profit potential of 3.236. This ultra-long-term approach allows keeping a safe distance from ITM scenarios while targeting considerable profit margins over time.
Calendar Spread Option Strategy #1
In constructing a calendar spread options strategy for Stanley Black & Decker, Inc. (SWK), we aim to maximize profitability while minimizing assignment risk by carefully selecting options with advantageous "Greeks" and terms. Given the target stock price is 2% above or below the current stock price, we can leverage the variance in time decay to our benefit. Specifically, we will buy puts with one expiration date and sell calls with a different expiration date. Here are five optimized strategies, covering various expirations, from near-term to long-term.
- Near-Term Strategy:
- Buy Put Option: Strike $105.0, Expire 2024-10-18:
- Delta: -0.765, Gamma: 0.0128, Vega: 17.64, Theta: -0.0169, Premium: $20.3
- This option provides a negative delta, indicating it's a good hedge against downward movement.
-
Sell Call Option: Strike $80.0, Expire 2024-06-21:
- Delta: 0.894, Gamma: 0.0170, Vega: 5.20, Theta: -0.0257, Premium: $12.5, Profit: 2.536
- The option is in-the-money, indicating a higher premium, but should be only sold if sentiment or timeframe suggests low short-term risk of assignment.
-
Intermediate-Term Strategy:
- Buy Put Option: Strike $110.0, Expire 2024-10-18:
- Delta: 0.184, Gamma: 0.0159, Vega: 15.91, Theta: -0.0143, Premium: $1.26
- This option provides strong vega for volatility changes.
-
Sell Call Option: Strike $105.0, Expire 2024-07-19:
- Delta: 0.102, Gamma: 0.0192, Vega: 6.91, Theta: -0.0129, Premium: $0.35, Profit: 0.35
- Offers lower premium return but mitigates assignment risk due to lower delta.
-
Medium-Term Strategy:
- Buy Put Option: Strike $80.0, Expire 2025-01-17:
- Delta: 0.730, Gamma: 0.0126, Vega: 23.54, Theta: -0.0151, Premium: $16.11
- Profits from high vega and relatively high theta compared to 2024 options for gradual premium yield.
-
Sell Call Option: Strike $90.0, Expire 2024-10-18:
- Delta: 0.577, Gamma: 0.0222, Vega: 23.02, Theta: -0.0215, Premium: $7.6, Profit: 7.6
- Selling this call can yield considerable premium with a balance between delta and assignment risk.
-
Long-Term Strategy:
- Buy Put Option: Strike $82.5, Expire 2025-01-17:
- Delta: 0.694, Gamma: 0.0137, Vega: 25.17, Theta: -0.0161, Premium: $13.3
- Good balance between cost and gradual delta changes.
-
Sell Call Option: Strike $90.0, Expire 2026-01-16:
- Delta: 0.583, Gamma: 0.0084, Vega: 42.60, Theta: -0.0115, Premium: $12.90, Profit: 12.90
- High premium and low probability of immediate assignment given theta decay profile.
-
Extra Long-Term Strategy:
- Buy Put Option: Strike $135.0, Expire 2025-01-17:
- Delta: -0.976, Gamma: 0, Vega: 0, Theta: 0.0071, Premium: $33.3, Profit: 8.064
- This deep in-the-money put offers little gamma but significant inherent value.
- Sell Call Option: Strike $70.0, Expire 2026-01-16:
- Delta: 0.709, Gamma: 0.0066, Vega: 35.28, Theta: -0.0096, Premium: $18.65, Profit: 3.686
- Strong vega and theta suitable for a solid time decay spread.
By selecting these options, we optimize the interplay between premiums and the "Greeks," ensuring profitability while strategically navigating assignment risks. Delta values going below 1 or above -1 are particularly crucial to monitor; a balanced approach will secure premium while minimizing the assignment probability. Each strategy considers different expiration timelines, enabling a spread of risk and reward factors across varying market conditions.
Calendar Spread Option Strategy #2
When considering a calendar spread strategy involving selling a put option and buying a call option on Stanley Black & Decker, Inc. (SWK), it is important to select options that balance profitability and the risk of having shares assigned. Given the strategy described, we will be dealing with in-the-money options, focusing on those with expiration dates that range from the near term to the long term. Here, I provide five choices of calendar spreads based on their expiration dates and strike prices.
Choice 1: Near-Term Calendar Spread
- Sell Short Put: Strike price $87.5, expiration date 2024-05-17
- Greeks: Delta = 0.91585, Gamma = 0.0476, Vega = 1.04756, Theta = -0.1262, Rho = 0.4364
-
Premium: $3.9, ROI: 36.82%, Profit: $1.436
-
Buy Long Call: Strike price $105, expiration date 2024-05-17
- Greeks: Delta = -0.78256, Gamma = 0.0205, Vega = 1.99734, Theta = -1.0505, Rho = -0.4750
- Premium: $9.2, ROI: 23.52%, Profit: $2.164
This spread involves selling a short put at a strike price of $87.5, which is closer to being in-the-money, reducing the risk of assignment. The selected call option has a higher strike price and provides a reasonable buffer, thus minimizing the risk of assignment while also offering a decent ROI.
Choice 2: Mid-Term Calendar Spread
- Sell Short Put: Strike price $90, expiration date 2024-06-21
- Greeks: Delta = 0.6201, Gamma = 0.0547, Vega = 11.0670, Theta = -0.0363, Rho = 5.3893
-
Premium: $3.78, ROI: 100.0%, Profit: $3.78
-
Buy Long Call: Strike price $135, expiration date 2025-01-17
- Greeks: Delta = -0.97599, Gamma = 0.0, Vega = 0.0, Theta = 0.00714, Rho = -88.6491
- Premium: $33.3, ROI: 24.22%, Profit: $8.064
Selling a mid-term put at the strike price of $90 provides significant premium collection with a delta that indicates lower assignment risk. The long call at a strike price of $135, which has a higher delta and substantial profit potential, complements the short put and maximizes potential ROI.
Choice 3: Intermediate-Term Calendar Spread
- Sell Short Put: Strike price $85, expiration date 2024-10-18
- Greeks: Delta = 0.6836, Gamma = 0.0191, Vega = 20.7267, Theta = -0.0202, Rho = 22.1709
-
Premium: $10.1, ROI: 50.85%, Profit: $5.136
-
Buy Long Call: Strike price $130, expiration date 2025-01-17
- Greeks: Delta = -0.97599, Gamma = 0.0, Vega = 0.0, Theta = 0.00714, Rho = -88.6491
- Premium: $33.3, ROI: 24.22%, Profit: $8.064
This strategy involves selling a short put with a considerable premium at the strike price of $85, which reduces the risk of assignment. Buying a call with a higher strike price allows gaining from potential rises in stock value.
Choice 4: Long-Term Calendar Spread
- Sell Short Put: Strike price $90, expiration date 2025-01-17
- Greeks: Delta = 0.57596, Gamma = 0.01619, Vega = 28.6502, Theta = -0.0180, Rho = 28.9039
-
Premium: $8.41, ROI: 100.0%, Profit: $8.41
-
Buy Long Call: Strike price $115, expiration date 2025-01-17
- Greeks: Delta = -0.97599, Gamma = 0.0, Vega = 0.0, Theta = 0.00714, Rho = -88.6491
- Premium: $33.3, ROI: 24.22%, Profit: $8.064
Selling a long-term put at the strike price of $90 provides excellent premium yields and greatly reduces the risk of assignment, given the delta value. The selected call continues to hedge the position and offers significant upside potential.
Choice 5: Very Long-Term Calendar Spread
- Sell Short Put: Strike price $95, expiration date 2026-01-16
- Greeks: Delta = 0.54072, Gamma = 0.00873, Vega = 43.8455, Theta = -0.0121, Rho = 57.8913
-
Premium: $10.9, ROI: 100.0%, Profit: $10.9
-
Buy Long Call: Strike price $105, expiration date 2026-01-16
- Greeks: Delta = -0.97599, Gamma = 0.0, Vega = 0.0, Theta = 0.00714, Rho = -88.6491
- Premium: $33.3, ROI: 24.22%, Profit: $8.064
For the very long-term calendar spread, selling a short put with a delta closer to 0.5 at a strike price of $95 ensures reduced assignment risk and premium collection. The corresponding call option provides substantial coverage and profit potential.
Each strategy provided here finds a balance between premium collection from selling puts and the potential profit from buying calls. The chosen strike prices and expiration dates are designed to mitigate assignment risk while maximizing returns.
Similar Companies in Manufacturing - Tools & Accessories:
Report: The Toro Company (TTC), The Toro Company (TTC), The Timken Company (TKR), Lincoln Electric Holdings, Inc. (LECO), Kennametal Inc. (KMT), Snap-on Incorporated (SNA), RBC Bearings Incorporated (RBCP), RBC Bearings Incorporated (RBC), The L.S. Starrett Company (SCX), Report: The Home Depot, Inc. (HD), The Home Depot, Inc. (HD), Report: Lowe's Companies, Inc. (LOW), Lowe's Companies, Inc. (LOW), Illinois Tool Works Inc. (ITW), Techtronic Industries Company Limited (TTNDY), Fortune Brands Home & Security, Inc. (FBHS), Masco Corporation (MAS), A. O. Smith Corporation (AOS)
https://www.fool.com/investing/2024/04/10/1-industrial-stock-to-buy-at-a-discount/
https://www.fool.com/investing/2024/04/15/3-magnificent-high-yield-dividend-stocks-down-betw/
https://www.fool.com/investing/2024/04/17/2-incredibly-cheap-dividend-king-stocks-to-buy-now/
https://www.fool.com/investing/2024/04/20/bull-market-buys-3-dividend-stocks-to-own-for-the/
https://seekingalpha.com/article/4687259-my-best-dividend-aristocrats-may-2024
https://finance.yahoo.com/news/barclays-adjusts-price-target-stanley-123502712.html
https://finance.yahoo.com/news/goldman-sachs-adjusts-price-target-135457465.html
https://finance.yahoo.com/news/wolfe-adjusts-price-target-stanley-135513439.html
https://finance.yahoo.com/news/deutsche-bank-adjusts-price-target-141203891.html
https://finance.yahoo.com/news/wells-fargo-adjusts-price-target-142504160.html
https://finance.yahoo.com/news/stanley-black-decker-inc-nyse-162428416.html
https://finance.yahoo.com/news/stanley-black-decker-announces-upcoming-195200810.html
https://finance.yahoo.com/news/dewalt-ring-opening-bell-york-090000690.html
https://www.sec.gov/Archives/edgar/data/93556/000009355624000091/swk-20240330.htm
Copyright © 2024 Tiny Computers (email@tinycomputers.io)
Report ID: nLqifN
Cost: $0.67584
https://reports.tinycomputers.io/SWK/SWK-2024-05-14.html Home