Target Corporation (ticker: TGT)
2024-01-18
 Target Corporation (TICKER: TGT) is a well-established retailer in the United States, known for its combination of quality goods at competitive prices, with a focus on a convenient and pleasant shopping experience. As of the most recent fiscal year, Target operates over 1,900 stores across the United States, offering a wide range of products from clothing and electronics to groceries and home furnishings. The company also has a significant online presence, with a rapidly growing e-commerce platform that has become increasingly central to its business strategy in the face of stiff competition from other retailers and online giants like Amazon. Target is known for its innovative practices such as designer partnerships, private label brands, and a strong supply chain management. Financially, TGT has demonstrated consistent growth in revenues and earnings, maintaining a stable dividend payment to shareholders, and showing resilience in adapting to the evolving retail landscape. The dedication to sustainability and community involvement are also integral parts of Targets corporate identity, further solidifying its position as a major player in the retail sector.
| Address | 1000 Nicollet Mall | City | Minneapolis | State | MN |
| Zip Code | 55403 | Country | United States | Phone Number | 612 304 6073 |
| Website | corporate.target.com | Industry | Discount Stores | Sector | Consumer Defensive |
| Full Time Employees | 440,000 | Previous Close | $138.74 | Open | $138.63 |
| Day Low | $135.67 | Day High | $139.12 | Dividend Rate | $4.4 |
| Dividend Yield | 3.17% | Payout Ratio | 55.29% | Five Year Avg Dividend Yield | 2.27% |
| Beta | 1.118 | Trailing PE | 17.503 | Forward PE | 15.099 |
| Volume | 4,153,709 | Average Volume | 4,467,772 | Average Volume (10 days) | 3,381,410 |
| Market Cap | $63,432,359,936 | Fifty Two Week Low | $102.93 | Fifty Two Week High | $181.7 |
| Price to Sales (TTM) | 0.5934 | Enterprise Value | $81,065,328,640 | Profit Margins | 3.398% |
| Shares Outstanding | 461,662,016 | Shares Short | 8,536,810 | Held Percent Insiders | 0.188% |
| Held Percent Institutions | 79.637% | Short Ratio | 2.29 | Short Percent of Float | 1.85% |
| Book Value | $27.107 | Price to Book | 5.069 | Last Fiscal Year End | 1674864000 |
| Next Fiscal Year End | 1706400000 | Most Recent Quarter | 1698451200 | Earnings Quarterly Growth | 36.4% |
| Net Income to Common | $3,632,000,000 | Trailing EPS | $7.85 | Forward EPS | $9.10 |
| PEG Ratio | 0.82 | Total Cash | $1,910,000,000 | Total Cash Per Share | $4.137 |
| Total Debt | $19,542,999,040 | Quick Ratio | 0.089 | Current Ratio | 0.865 |
| Total Revenue | $106,888,003,584 | Debt to Equity | 156.169 | Revenue Per Share | $231.761 |
| Return on Assets | 5.798% | Return on Equity | 30.867% | Free Cash Flow | $2,222,000,128 |
| Operating Cash Flow | $8,798,000,128 | Earnings Growth | 36.4% | Revenue Growth | -4.2% |
| Gross Margins | 26.765% | EBITDA Margins | 7.443% | Operating Margins | 5.536% |
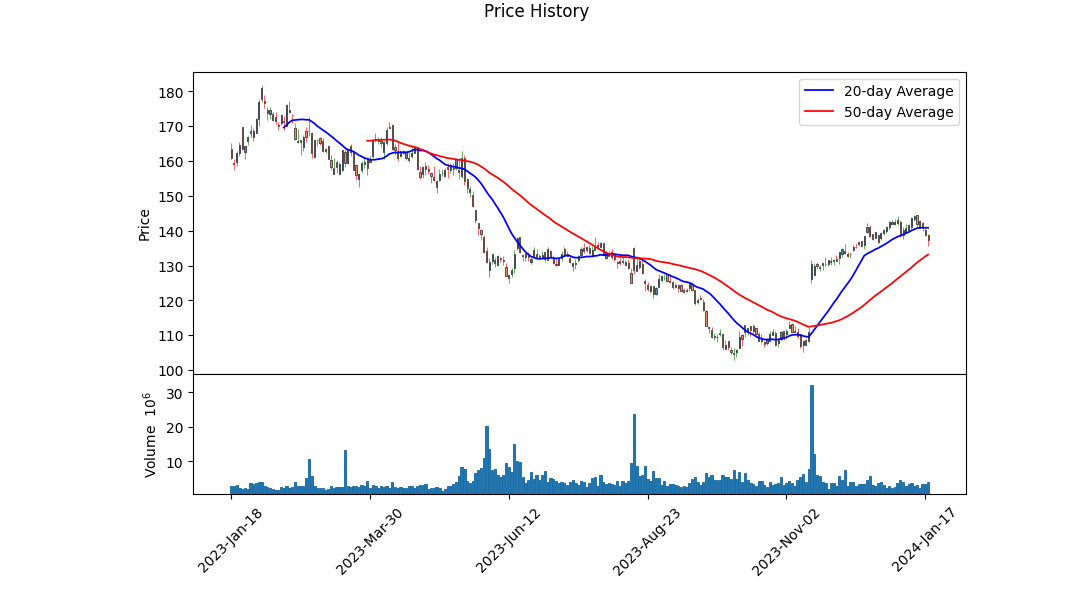
 Technical Analysis:
The recent price action of Target Corporation (TGT) indicates a tentative recovery trajectory, as evidenced by the shift from a downtrend with lower highs and lower lows in the late third and early fourth quarters of the previous year to more stable price levels since the turn of the year. The Parabolic SAR (PSAR), a trend-following indicator, suggests that the downtrend has been somewhat arrested, with the tentative establishment of a new uptrend as of the last reported trading day. However, this is still in the early stages, as indicated by a PSAR value which flipped to the bullish case by the end of the period. A reserve in trend would require caution.
The On-Balance Volume (OBV) metric illustrates a significant increase in volume alongside price improvement over the last few months, signaling robust buying pressure which can be interpreted as a positive sentiment among market participants. This trend can be correlated with rising prices if the demand continues to outstrip supply.
The Moving Average Convergence Divergence (MACD) histogram is showing a decrease in positive momentum, which may suggest a potential consolidation or pullback in the near future. Watching the MACD's crossover between its signal line in subsequent trading days would provide further clarification on the nature and strength of the stock's momentum.
Fundamental Analysis:
Analyzing the fundamentals of TGT, it is noticeable that the company has faced a decline in net income over the past years, but key margins like gross and operating margins remain relatively healthy. The recent contraction in EBITDA, accompanied by a decline in net income, raises caution despite robust revenue figures.
TGT's balance sheets reveal a growing amount of net debt, which could be a concern in terms of financial stability and interest expense. However, ample tangible book value suggests assets do remain to cushion this liability.
Regarding cash flows, a negative free cash flow and substantial repurchases of capital stock indicate that the company is leveraging its cash to provide shareholder returns, which can be viewed positively in the context of strong earning reports but also poses questions on reinvestment for growth.
Market Expectations:
Analyst expectations show optimism for the next quarters and years with both earnings and revenues expected to grow. The trend in EPS revisions and earnings surprises also points towards a positive outlook among analysts regarding TGT's future performance.
Conclusion:
Incorporating the aforementioned technical and fundamental analysis, TGT's prospects for the subsequent few months seem to be underpinned by market optimism. While certain concerns remain, notably the growing net debt and a recent dip in net income, healthy margins could stabilize sentiment. The affirmative analyst outlook reinforces a constructive view.
For the medium term, a cautious approach would be warranted, paying heed to the developing trends both on technical fronts (PSAR developments and MACD trends) and fundamental fronts (EBITDA trends, margin performance, and debt levels).
The strength in OBV could suggest further price appreciation if the buying pressure persists, necessitating monitoring of volume trends and market sentiment. Conversely, a shift in momentum as indicated by MACD would require reassessment of the bullish thesis.
Overall, the combination of improving price action, steady market demand, healthy margins, and positive analyst outlook suggest a potential for gradual price rise over the next few months assuming continuation of these trends. However, vigilance is advised as the market absorbs new information and as the technical indicators fully develop their narratives.
| Statistic Name | Statistic Value |
| R-squared | 0.257 |
| Adj. R-squared | 0.256 |
| F-statistic | 432.7 |
| Prob (F-statistic) | 8.34e-83 |
| Log-Likelihood | -2,591.0 |
| AIC | 5,186 |
| BIC | 5,196 |
| Const | 0.0337 |
| Coef | 0.8494 |
| Std Err | 0.041 |
| t | 20.802 |
| P>|t| | 0.000 |
| [0.025 | 0.769 |
| 0.975] | 0.930 |
| Omnibus | 491.258 |
| Prob(Omnibus) | 0.000 |
| Jarque-Bera (JB) | 61,762.409 |
| Skew | 0.759 |
| Kurtosis | 37.320 |
| Cond. No. | 1.32 |
The linear regression model reveals that Target Corporation (TGT) has a positive but moderate relationship with the S&P 500 (SPY), with an R-squared value of 0.257. This suggests that approximately 25.7% of the variation in TGT's stock price can be explained by movements in the SPY. The alpha value of 0.0337 implies a small positive intercept, suggesting that, on average, TGT could be expected to outperform the market by 3.37% if SPY's return were zero. The positive beta coefficient of 0.8494 indicates that TGT tends to move in the same direction as the market but less than one-for-one; for every 1% change in the SPY, TGT's return changes by approximately 0.85%.
Despite the observed relationship, the relatively low R-squared indicates that other factors, not captured by SPY, contribute significantly to TGT's price movement. Additionally, the const (alpha) has a p-value of 0.532, which is not statistically significant at common confidence levels, suggesting that there may not be sufficient evidence to conclude that the alpha is different from zero. However, the model has a strong F-statistic with a virtually zero probability, indicating that the overall regression is statistically significant, even though the predictive power is moderate. The t-statistic for the coefficient is large and its p-value is very close to zero, providing strong evidence that the beta coefficient is significantly different from zero.
Summary of Target Corporation's Q3 2023 Earnings Call:
Introduction:
- The call was hosted by John Hulbert, VP of Investor Relations.
- Participants included CEO Brian Cornell, Chief Growth Officer Christina Hennington, COO John Mulligan, and CFO Michael Fiddelke.
- The team discussed Q3 performance, outlook, and priorities for Q4, followed by a Q&A session.
Performance Overview:
- Despite challenges, Target has achieved over $100 billion in annual revenue and improved profitability, with EPS 40% higher than last year.
- Comparable sales were down 4.9%, with the decline driven by discretionary categories and partially offset by sales growth in frequency categories.
- Digital channel sales were weaker than store sales, with notable growth in same-day services like Drive-Up.
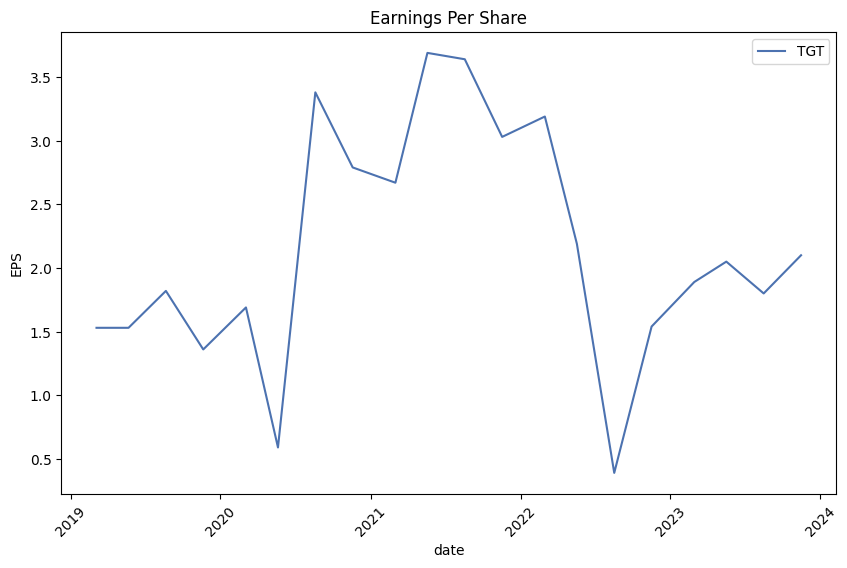
- The company's bottom line EPS of $2.10 exceeded expectations, mainly due to lower freight costs, disciplined inventory management, and efficiency enhancements.
Future Outlook and Strategies:
- Target aims to drive sustainable top-line and bottom-line growth amidst a challenging environment marked by persistent inflation and competitive pressures.
- The company is focusing on being a "happy place" for guests while investing in stores, supply chain, workforce, digital capabilities, and merchandise assortment, maintaining a cautious inventory stance.
- There is a renewed emphasis on value during the holiday season, with efforts to address high inflation in essentials, heightened energy prices, and discretionary spending shifts.
- Target is hiring nearly 100,000 seasonal employees to meet holiday demand.
Industry and Consumer Trends:
- Consumer resilience is evident, but budget constraints and inflation are influencing purchasing decisions, with a trend of delaying spending.
- The retail industry sees dollar sales driven by higher prices, with a consistent reduction in unit purchases.
- The market has had seven quarters of discretionary spending declines, challenging the industry as a whole.
Operational Excellence and Efficiency:
- The COO discussed efforts to optimize inventory, resulting in improved profitability and operational efficiency.
- Inventory management led to better in-stocks and reduced markdowns, positioning the company well for the holiday season.
- Investments in retail fundamentals and team training have improved the in-store experience, with a focus on execution and guest satisfaction.
Financials and Guidance:
- CFO Michael Fiddelke broke down the financial details, such as a decrease in total revenue and specifics around the gross margin rate and SG&A expenses.
- The capital deployment strategy focuses on investing in projects, supporting dividends, and share repurchases.
- The fourth quarter guidance anticipates a mid-single-digit decline in comparable sales, with a wide range for EPS due to promotional seasonality.
- The company is working towards improving ROI while maintaining a strategic focus on long-term growth.
Closing Remarks:
- CEO Brian Cornell acknowledged John Mulligan's impactful career and upcoming retirement.
- Mulligan ensured smooth operations and succession planning for his role, with his advisory role continuing until February 2025.
- The Q&A session addressed concerns like traffic trends, inventory levels, market share, promotions, and the outlook for the coming year.
Note to the Reader:
This summary is a condensed version of the earnings call and does not include every detail discussed during the session. For a complete understanding of Target Corporation's financial position and strategies, the full call transcript or recordings should be referred to.
The 10-Q filing report for Target Corporation (TGT) for the third quarter of 2023 reveals a mixed financial performance with some notable strengths and challenges. During this period, Target reported a total revenue of $25.4 billion, marking a 4.2% decrease compared to the same period last year. The decline in revenue reflects a decrease in both sales, which fell by 4.3%, and other revenue streams that shrank by 0.6%. Comparable sales dipped by 4.9%, attributed to a decrease in traffic by 4.1% and a 0.8% reduction in average transaction amounts. Specifically, comparable sales within stores declined by 4.6% and digital sales fell by 6.0%.
Despite reduced sales, Target's gross margin rate improved to 27.4% from 24.7% in the comparable prior-year period, primarily due to lower freight costs, reduced clearance and promotional markdown rates, and decreased digital fulfillment and supply chain costs. However, the company continues to experience higher inventory shrink rates, which are affecting its operations and leading to store closures and asset impairments.
Operating income for the quarter was $1.317 billion, indicating a significant increase of 28.9% over the prior year, while net interest expense decreased from $125 million to $107 million, largely due to an increase in interest income. For the nine-month period ended October 28, 2023, operating income reached $3.842 billion, up 42.9% from the previous year.
Target's liquidity and capital resources remain strong, with $1.9 billion in cash and cash equivalents as of October 28, 2023. The company's capital allocation priorities are to invest in growth opportunities, maintain competitive dividends with goals of annual growth, and buy back shares while adhering to credit rating targets. No share repurchases were conducted during the nine-month period.
Dividend payments remained consistent with Target's history of returning value to shareholders, with $507 million (or $1.10 per share) paid in Q3 and $1.5 billion (or $3.26 per share) for the nine-month period. These dividend amounts represented an increase from the previous year.
Target's financial and operational strategies are driven by a focus on long-term profitability and growth. Management's actions, including adjustments to inventory levels and supply chain enhancements, demonstrate a responsive and disciplined approach to market changes and operational challenges.
Importantly, the company assesses its capital allocation effectiveness through after-tax return on invested capital (ROIC), which stood at 13.9% for the trailing twelve months, compared to 14.6% for the prior period.
Overall, while Target faces headwinds in the form of decreased sales and higher shrink rates, proactive measures to improve margins, manage inventory, and maintain liquidity position the company to navigate the current retail environment. The 10-Q report underscores Target's commitment to strategic investments, operational efficiency, and shareholder value creation despite these industry-wide challenges.
Target Corporation (NYSE: TGT), a renowned entity in the Retail - Discount Stores sector, has long stood as a favored destination for both everyday essentials and discretionary items, catering to a diverse customer base. The company's business model, underpinned by an extensive product assortment and a commitment to value, has proven to be resilient, particularly when navigating the nuanced preferences of consumers across various demographics, including the influential millennial and Gen Z audiences.
Understanding the company's positioning within the market becomes imperative for investors seeking value, and this can be assessed through multiple analyses from trusted financial sources. For instance, Zacks Equity Research reports have frequently provided investors with insights by examining crucial valuation metrics, including the price-to-earnings (P/E) ratio, the price-to-earnings-growth (PEG) ratio, and the price-to-book (P/B) ratio.
On December 13, 2023, Zacks Equity Research highlighted Target's favorable prospects, with a Zacks Rank of #2 (Buy) and a compelling Value grade of A in the Style Scores system. This underscored an optimistic earnings outlook for Target, which was further bolstered by its forward P/E of 16.27 and a PEG ratio of 1.15 figures that indicated a potentially undervalued stock. Target's P/B ratio stood at a reasonable level, augmenting the narrative of an attractive value investment relative to its growth expectations and book value.
Further reinforcing this perspective was Target's recognition as a probable outperformer in earnings, as reported by Zacks.com on December 8, 2023. The company's consistent history of positive earnings surprises, combined with an average earnings surprise of 30.84% for the past four quarters and anticipation of meaningful EPS growth over the next 3-5 years, positioned it among the top five stocks poised for an earnings beat, suggesting latent potential for stock appreciation.
Additionally, an article by Daniel Foelber with The Motley Fool, dated December 16, 2023, underscored Target's identity as one of three "Passive Income Powerhouses." Target's status as a Dividend King, with over 50 years of consecutive dividend increases, marked its reliability as a source of steady income. Despite notable challenges, such as inflation and shifting consumer spending patterns, the company's strategic initiatives in adapting its rewards program and enhancing e-commerce have been pivotal in steering growth. A lean inventory approach, aimed at mitigating discounting pressures, complemented Target's enduring appeal as an investment opportunity that balances income generation and potential capital gains.
As the GARP (growth at a reasonable price) investment strategy gains favor, it's clear that investors should consider the price/earnings to growth (PEG) ratio in combination with more conventional valuation metrics. Zacks' analysis has indicated that Target Corporation, with its strong financials and projected long-term growth rate of 14.2%, offers potential as a value stock. Moreover, the transitioning retail environment invites investors to recognize the importance of companies like Target, which has not only embraced but excelled in the digital domain. The acquisition of Shipt exemplifies Target's strategic foresight, enabling it to offer coveted same-day delivery services.
Target's response to external pressures such as crime and inventory management issues has been notable. Despite the closure of several stores in 2023, which CNBC scrutinized for inconsistencies in the crime rates rationale, the company has continued to invest and open new stores. Indeed, the need for optimization and refinement amid operational challenges is a natural stride in Target's growth narrative.
Looking at its financial footing, Target has evidently prioritized efficient inventory and expense management, witnessing a 30% increase in net income and substantial operating cash flow in the trailing twelve months (TTM) reported as of January 2023. Further, Target's valuation metrics relative to the industry peers suggest that the company might be undervalued, with a forward P/E and PEG ratio indicating untapped earnings potential and growth prospects.
The varied analyses by reputable financial commentators, from Zacks Equity Research to The Motley Fool and Seeking Alpha, invariably suggest that Target Corporation harbors several attributes that make it a compelling stock for investors' portfolios. It's characterized by robust earnings revisions, a strong dividend history, digital evolution, and fundamental operational strength, all fashioned within a framework of a larger strategy that adeptly balances challenges with consumer-oriented innovation.
Given the diversity of Target's strengths, there is a cohesive narrative forming around its status as an investment with potential for both value and growth. This makes the case for investors to consider Target as a vital component in the realm of retail investments, as it continues to display a marked ability to evolve, reinvent, and capitalize on opportunities for expansion and efficiency in the ever-shifting commercial environment.
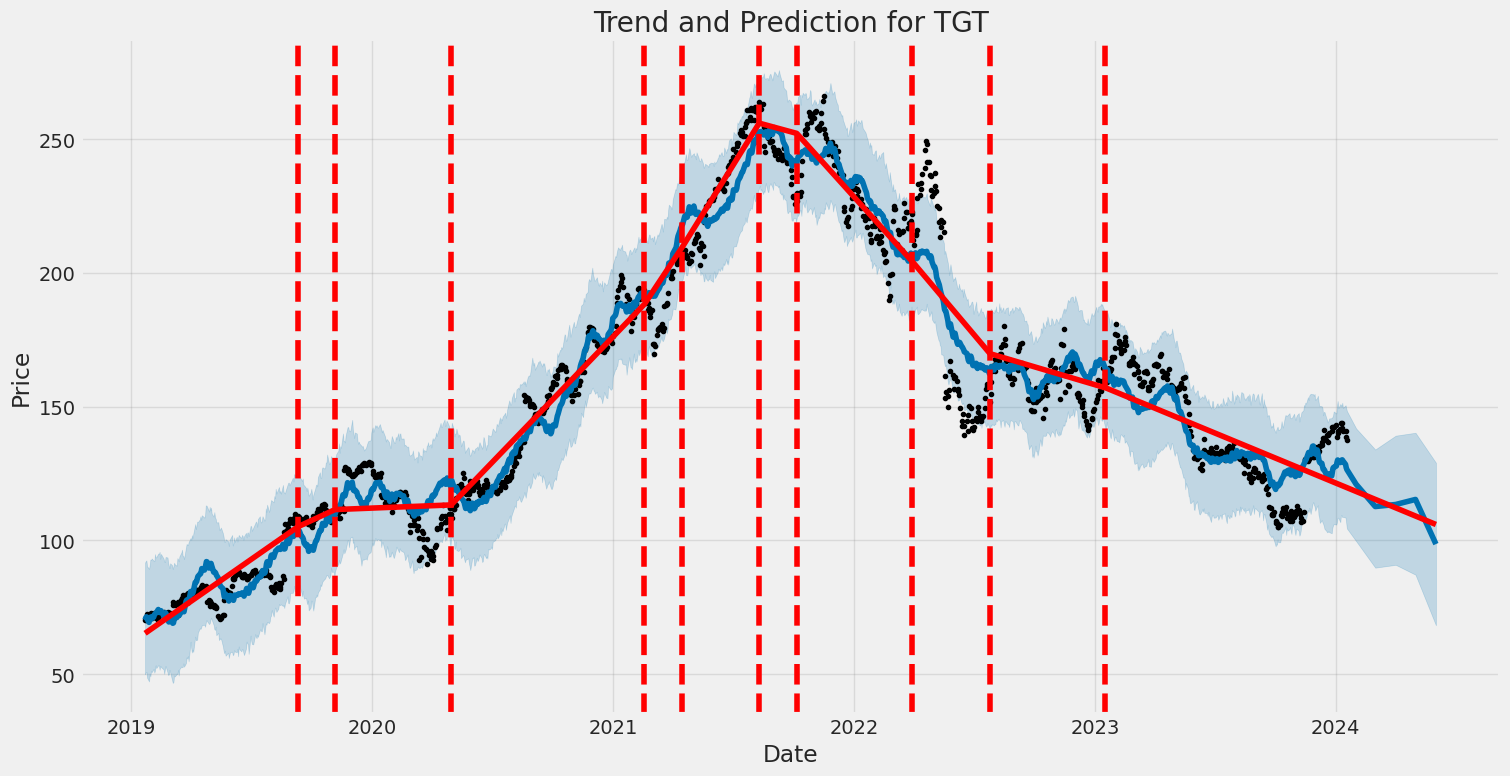
Target Corporation (TGT) experienced volatility between January 22, 2019, and January 18, 2024, that can be briefly summarized as follows: The ARCH model used to analyze the volatility indicates there is no significant average trend in the asset returns over time. The volatility, according to the omega parameter, was notably high, which suggests that there were periods of substantial variability in the stock's returns. Lastly, the alpha parameter, though not statistically significant at traditional levels, suggests some persistence in volatility, meaning that large swings in stock returns would often be followed by more large swings.
In simpler terms, the fluctuations in Target Corporation's stock price did not follow a clear upward or downward trend during the specified period. There were times when the stock price movements were quite large, indicating a less stable stock price. Although the pattern of these large movements did not consistently predict future volatility, there is some indication that big jumps in stock price might be followed by more big jumps.
Here's the requested HTML table:
| Statistic | Value |
|---|---|
| Log-Likelihood | -2,732.96 |
| AIC | 5,469.92 |
| BIC | 5,480.19 |
| No. Observations | 1,256 |
| Df Residuals | 1,256 |
| omega | 3.3310 |
| alpha[1] | 0.5156 |
To analyze the financial risk associated with a $10,000 investment in Target Corporation (TGT) over the span of a year, a multifaceted approach that integrates volatility modeling with machine learning predictions is employed.
Volatility modeling, in this case, serves as a tool to quantify and anticipate the magnitude of fluctuations in the stock price of Target Corporation. This method is particularly adept at capturing the "clustering" effect of volatility, a common phenomenon in financial time series where high-volatility events tend to be followed by more high-volatility events, and similarly for low-volatility periods. By fitting the volatility model to historical data, it can provide an estimate of the expected volatility of stock returns over the one-year horizon.
In conjunction with the volatility assessment, machine learning predictions are harnessed to forecast future stock returns of TGT. The algorithm chosen for this task is a sophisticated ensemble learning technique that operates by constructing a multitude of decision trees at training time and outputting the average predictions of the individual trees. This approach captures complex, non-linear relationships within the data that can significantly impact the prediction of stock returns.
When combined, these two models can offer a robust prediction of stock returns, taking into account both the average expected return and the uncertainty surrounding this return, as informed by the estimated volatility.
Turning to the assessment of risk, the calculated Value at Risk (VaR) is a widely recognized risk measure representing the worst expected loss over a given time frame with a certain confidence level. In this instance, utilizing the interplay between the volatility model and the machine learning predictions, the annual VaR for a $10,000 investment in TGT, at the 95% confidence interval, is computed to be $324.68. This implies that there is a 95% probability that the investor will not lose more than $324.68 over the next year, under normal market conditions.
This VaR figure crystallizes the potential risks in equity investment and demonstrates the value of a combined analytical framework that leverages both volatility patterns and sophisticated return forecasts. By so doing, investors can gain a comprehensive view of the financial risks associated with their investment in the stock market, facilitating more informed decision-making.
Similar Companies in Discount Stores:
Report: Costco Wholesale Corporation (COST), Costco Wholesale Corporation (COST), BJ's Wholesale Club Holdings, Inc. (BJ), Dollar Tree, Inc. (DLTR), Dollar General Corporation (DG), Walmart Inc. (WMT), Big Lots, Inc. (BIG), Walmart Inc. (WMT), Report: Costco Wholesale Corporation (COST), Costco Wholesale Corporation (COST), Dollar General Corporation (DG), Dollar Tree, Inc. (DLTR), Report: The Home Depot, Inc. (HD), The Home Depot, Inc. (HD), Report: Lowe's Companies, Inc. (LOW), Lowe's Companies, Inc. (LOW), Best Buy Co., Inc. (BBY), Kohl's Corporation (KSS), Macy's, Inc. (M), Nordstrom, Inc. (JWN)
https://www.zacks.com/stock/news/2194689/is-trending-stock-target-corporation-tgt-a-buy-now
https://www.zacks.com/stock/news/2195227/play-potential-earnings-beat-with-5-top-ranked-stocks
https://www.zacks.com/stock/news/2197476/tgt-vs-rost-which-stock-is-the-better-value-option
https://www.zacks.com/stock/news/2197766/4-best-peg-based-garp-stocks-for-investors
https://www.fool.com/investing/2023/12/16/3-passive-income-powerhouses-to-buy-before-2024/
https://seekingalpha.com/article/4658332-add-target-to-your-holiday-shopping-list
https://www.cnbc.com/2023/12/19/target-store-closures-theft-and-crime-higher-nearby.html
https://www.fool.com/investing/2023/12/20/3-stocks-youll-be-glad-you-bought-at-these-prices/
https://www.zacks.com/stock/news/2201552/are-investors-undervaluing-target-tgt-right-now
https://seekingalpha.com/article/4659246-target-multiple-reasons-for-optimism
https://seekingalpha.com/article/4659759-my-best-dividend-aristocrats-for-january-2024
https://www.zacks.com/stock/news/2204178/tgt-or-rost-which-is-the-better-value-stock-right-now
https://www.zacks.com/stock/news/2205008/why-target-tgt-is-a-top-value-stock-for-the-long-term
https://seekingalpha.com/article/4661001-target-corporation-strong-cash-flow-and-stronger-margins
https://www.zacks.com/commentary/2205450/4-retail-discount-store-stocks-to-watch-in-the-year-ahead
https://www.sec.gov/Archives/edgar/data/0000027419/000002741923000052/tgt-20231028.htm
Copyright © 2024 Tiny Computers (email@tinycomputers.io)
Report ID: ARRsf1i
https://reports.tinycomputers.io/TGT/TGT-2024-01-18.html Home