Vodafone Group Public Limited Company (ticker: VOD)
2024-02-04
 Vodafone Group Public Limited Company, known by its ticker symbol VOD, stands as a prominent player in the global telecommunications sector. With its roots tracing back to 1984 in the United Kingdom, Vodafone has evolved into a multinational giant, offering a wide array of services including voice, messaging, data, and fixed broadband. The company has a significant footprint, operating in numerous countries across Europe, Asia, Africa, and Oceania. Vodafone's strategy focuses on digital innovation, connectivity, and enhancing customer experience, aiming to be at the forefront of the industry's technological advancements. Financially, VOD is noted for its robust revenue streams, strategic acquisitions, and partnerships that have bolstered its market position. The company is also recognized for its commitment to corporate social responsibility, particularly in areas like education, health, and environmental sustainability. As the telecommunications landscape continues to evolve, Vodafone Group PLC aims to navigate these changes strategically, leveraging its expansive network and expertise to maintain its status as a leading global provider.
| Country | United Kingdom | Full Time Employees | 104,000 | Group CEO & Executive Director Pay | 2,676,721 |
| Previous Close | 8.73 | Market Cap | 23,667,044,352 | Volume | 5,963,105 |
| Dividend Rate | 0.97 | Dividend Yield | 0.1109 | Payout Ratio | 0.243 |
| Beta | 0.435 | Trailing PE | 2.1317074 | Forward PE | 11.5 |
| 52 Week Low | 8.11 | 52 Week High | 12.53 | Price to Sales | 0.5293101 |
| Enterprise Value | 291,656,433,664 | Profit Margins | 0.23587999 | Shares Outstanding | 2,707,899,904 |
| Book Value | 2.236 | Price to Book | 3.9087656 | Net Income | 10,547,000,320 |
| Trailing EPS | 4.1 | Forward EPS | 0.76 | Total Revenue | 44,713,000,960 |
| EBITDA | 10,636,999,680 | Total Debt | 67,342,999,552 | Revenue Growth | -0.043 |
| Gross Margins | 0.31682 | Operating Margins | 0.07485 | Return on Equity | 0.18404 |
| Sharpe Ratio | -0.5046658194427388 | Sortino Ratio | -8.169743644744056 |
| Treynor Ratio | -0.21786732879106263 | Calmar Ratio | -0.43175640785543246 |
Analyzing the technical, fundamental, and balance sheet data of Vodafone (VOD), alongside the risk-adjusted performance metrics, reveals an intricate picture of the company's current market standing and provides insight into its potential future movements in stock price.
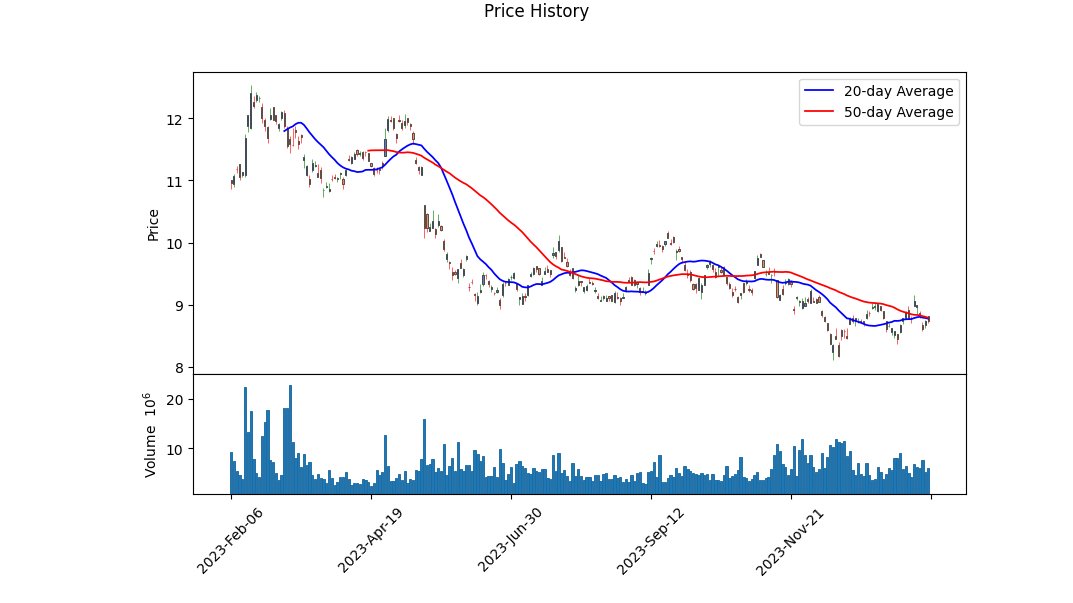
Technical Indicators suggest a bearish trend over the last monitored period, with a general decline in the stock's price, as evidenced by the closing prices moving from above 9 units to below 9. This trend is complementaried by a decreasing On-Balance Volume (OBV) indicator, which signifies that volume is following the price downward, a bearish sign. Although the MACD (Moving Average Convergence Divergence) histogram values near the period end are positive, their declining value indicates that the bearish momentum is still in place but may be slowing.
Fundamentals reveal a company with substantial operating and gross margins, indicating efficient management of costs and operations. However, without direct values on revenue or profit growth, the assessment relies heavily on market sentiment and broader industry performance. The financial data show solid EBITDA figures but it's crucial to note the operational margins which may indicate how effectively the company is converting its revenue into operational profit.
Balance Sheets and Cash Flows offer a perspective on the company's financial health. The notable net debt is a point of concern, indicating leveraged positions that could affect its future financial stability, especially under market or operational stresses. However, a strong cash position and positive free cash flow are promising indicators of the firm's liquidity and its capacity to cover short-term obligations.
Risk-adjusted Performance Metrics across Sharpe, Sortino, Treynor, and Calmar ratios present a somewhat negative outlook, highlighting that the returns of VOD haven't sufficiently compensated for the risks undertaken by investors relative to various benchmarks. This could signal potential investors that while the stock offers opportunities, it comes with above-average risk that hasn't been adequately offset by its recent returns.
Analyst Expectations and Growth Estimates lack concrete data for the current and next quarters, reflecting uncertainty or a lack of consensus among market analysts about VOD's immediate future. Nonetheless, the noted five-year growth estimate offers a glimmer of optimism, suggesting some analysts project long-term growth potential.
In conclusion, VOD's stock price movement in the next few months may remain under pressure given the bearish trend confirmed by technical indicators and the risk metrics signaling higher-than-desirable risk without commensurate returns. However, its strong cash flow and solid fundamental base could provide a counterbalance, presenting a potential for recovery or stabilization, especially if market conditions improve or if the company effectively leverages its assets and operational efficiencies. Investors looking at VOD should weigh these factors alongside broader market trends and sector-specific dynamics. Careful monitoring of upcoming financial reports and market sentiment will be crucial in assessing the stock's trajectory.
In our analysis of Vodafone Group Public Limited Company (VOD), we've completed a thorough evaluation of key financial metrics to assess its investment potential in accordance with the principles outlined in "The Little Book That Still Beats the Market." A critical look at VOD's financial performance reveals a Return on Capital (ROC) of 12.11%. This figure is indicative of the firm's efficiency in allocating its capital to profitable investments, suggesting that for every dollar invested in the company, it generates over 12 cents in profit. This level of ROC is generally considered favorable, as it showcases VOD's capability to generate value for its investors beyond the cost of its capital.
Equally compelling is VOD's Earnings Yield, which stands at an impressive 48.97%. Earnings yield, which is the inverse of the Price-to-Earnings (P/E) ratio, provides a direct measure of the return on investment. A 48.97% earnings yield indicates that VOD is generating nearly $49 in earnings for every $100 invested at its current share price, highlighting the company's potential for providing substantial returns to its shareholders. Together, these metrics position Vodafone Group as a potentially strong candidate for investment, offering both efficient capital utilization and attractive returns relative to its market value.
Based on the calculated metrics for Vodafone Group Public Limited Company (VOD) and how they stack up against Benjamin Graham's investment criteria, let's delve into an analysis:
-
Price-to-Earnings (P/E) Ratio: The company has a P/E ratio of 5.06, which is substantially below what is generally considered a high P/E ratio, indicating the stock could be undervalued based on its earnings. This aligns with Graham's preference for stocks with low P/E ratios, suggesting potential for value investment.
-
Price-to-Book (P/B) Ratio: VOD's P/B ratio stands at 0.152, which is quite low and suggests that the stock is trading at a price significantly below its book value. This would be highly attractive by Graham's standards, as he advocates for stocks trading below their book value to provide a margin of safety.
-
Debt-to-Equity Ratio: VOD shows a negative debt-to-equity ratio of -0.565. This unconventional negative value typically arises when a company has negative shareholders' equity, which might be a red flag for Graham. However, it's crucial to understand the specific reasons behind this figure for a comprehensive analysis, as Graham preferred companies with low debt levels to mitigate financial risk.
-
Dividend Record: VOD has consistently paid dividends for more than two decades, showcasing a strong dividend history. This would meet Graham's criterion favoring companies that have a consistent history of paying dividends, as it reflects the company's ability to generate and distribute profits to shareholders.
-
Current Ratio and Quick Ratio: Both the current and quick ratios of VOD are 0.886, indicating that the company might struggle slightly to cover its short-term liabilities with its short-term assets. Graham typically looked for higher ratios here as a sign of financial stability, though it's worth remembering that ideal figures can vary by industry.
Summary: Overall, Vodafone Group Public Limited Company appears to be a potentially attractive investment based on Benjamin Graham's principles. Its low P/E and P/B ratios indicate the stock might be undervalued, providing a margin of safety. Additionally, its strong dividend history is a positive sign of financial health and shareholder focus. However, the debt-to-equity ratio poses questions that warrant further investigation, and the liquidity ratios suggest room for improvement in short-term financial stability. As with all investments, it's crucial to consider these metrics as part of a comprehensive analysis, taking into account the overall industry context and specific company circumstances.
| Statistic Name | Statistic Value |
| R-squared | 0.303 |
| Adj. R-squared | 0.302 |
| F-statistic | 544.4 |
| Prob (F-statistic) | 2.59e-100 |
| Log-Likelihood | -2399.0 |
| No. Observations | 1257 |
| AIC | 4802 |
| BIC | 4812 |
| Alpha | -0.0630 |
| Beta | 0.8159 |
The linear regression model examining the relationship between VOD (Vodafone) stock performance and SPY (an ETF that represents the S&P 500, hence the overall market) suggests a certain level of dependency of VOD on the movements of the broader market. The model's alpha, captured at -0.0630, essentially indicates the expected return of VOD when the SPY is static. This negative alpha suggests that VOD, on its own, might underperform the market slightly, assuming no change in the market (SPY's performance). The relationship's strength, as denoted by the beta of 0.8159, implies that for every 1% increase in the SPY, VOD is expected to increase by approximately 0.816%. This level of beta indicates VOD is somewhat less volatile than the market but still significantly correlated with its movements.
Reviewing the model's diagnostics further reinforces the connection between VOD and SPY. The R-squared value of 0.303 means that around 30.3% of VOD's movement can be explained by the movements in SPY. While not a complete explanation of VOD's price variability, it's a significant portion that underscores the interconnectedness of individual stock performance with broader market trends. Additionally, the F-statistic and its associated probability highlight the statistical significance of this model, reinforcing the belief that the relationship between VOD and SPY is not due to chance. In conclusion, the data suggests a robust link between VOD's performance and broader market trends as represented by SPY, with the established alpha indicating VOD's tendency to underperform slightly in a static market scenario.
During Vodafone Group Public Limited Company's half-year results conference call, CEO Margherita Della Valle and new CFO Luka Mucic outlined several strategic actions and priorities defining the company's ongoing transformation. Valle emphasized Vodafone's commitment to changing by focusing on customer experience, simplifying the business, and accelerating growth. Significant steps include improving the Net Promoter Score (NPS) relative to competitors in most markets and partnering with Accenture to accelerate transformation. Additionally, Vodafone has experienced service revenue growth in Germany, supported by reengineering efforts and broadband price actions, and has seen growth in 14 of 17 markets. Valle also highlighted the strategic decision to exit the Spanish market to focus on regions where Vodafone can grow sustainably and deliver returns above the cost of capital.
Financial strategies and priorities were discussed in response to a question from Maurice Patrick of Barclays on capital allocation. Valle mentioned reevaluating capital allocation in response to changes within the group, particularly noting the sale of Vodafone Spain for 4.1 billion with a review of capital allocation set for the first half of calendar 2024. Mucic added that the focus is on sustainable growth and cash flow through operational excellence. He provided insights into the companys investment approach, comfort with the current levels of capital intensity, and the strength of Vodafone's balance sheet, emphasizing a strategic balance between investments, balance sheet management, and shareholder returns.
The call featured detailed discussions on operational strategies, particularly in the German market and broadband services. Valle provided confidence in broadband performance improvement and addressed the strategy around cable TV revenues and MDU (multi-dwelling unit) transitions projected to commence in January 2024. Vodafone aims to maintain competitive service offerings, leveraging technical advancements in cable technology such as high split DOCSIS and DOCSIS 4 trials in the Netherlands. These initiatives indicate Vodafone's approach to navigating challenges and capitalizing on technological advancements in dense markets.
The discussion also steered towards efficiency and cost savings, highlighting the transformation in shared operations towards a more commercially viable model facilitated by agreements such as the one with Accenture. This strategic shift aims not only to simplify operations but to leverage Vodafone's scale for efficiencies. Valle reiterated the focus on customer satisfaction as a central theme of operational changes, with NPS improvement efforts being a priority across markets. The conversation further touched on broader market strategies, including capital allocation post Spains market exit and adjustments to operational expenditures to reinvest in customer experiences. CFO Luka Mucic provided reassurance about the company's projected cash flow and addressed specific financial considerations, reflecting Vodafone's careful balance between growth, operational efficiency, and shareholder value.
In an exploration of Vodafone Group Public Limited Company's operations and strategic initiatives, multiple insights emerge, reflecting the telecom giant's positioning in the global market and influences across sectors, including healthcare and technology. Vodafone, recognized for its significant dividend yield and valuation, has been undergoing substantial transformations with asset sales amounting to $10 billion in 2023. This repositioning signals Vodafone's agility in navigating the telecom industry's dynamic landscape, focusing on optimizing its portfolio and enhancing investor value.
Despite the allure of significant dividends and its categorization among inexpensive British large-cap stocks ideal for investment in 2024, Vodafone faces challenges. The telecom market's competitive pressures and the necessity for continual technological advancements require strategic foresight. Vodafone's response includes diversifying its revenue streams and targeting high-growth potential markets to maintain financial stability and growth.
External factors also shape Vodafone's strategic direction. The proposed merger with Three UK, undergoing investigation by the Competition and Markets Authority (CMA), underscores the complexities of consolidating within the UK's telecommunications sector. This merger, aimed at creating a more formidable competitor within the market, reflects Vodafone's ambitions to enhance its infrastructure investment capacity, particularly in 5G and broadband services.
However, the government's scrutiny of foreign investments, particularly the concern over the United Arab Emirates' acquisition of a significant stake in Vodafone, illustrates the delicate balance between welcoming foreign capital and safeguarding national interests. The British government's intervention, mandating a special committee within Vodafone to oversee any national security concerns, highlights the geopolitical intricacies influencing corporate operations in sensitive sectors like telecommunications.
Vodafone's decision to reject a merger proposal from Iliad for its Italian operations, opting to explore alternatives, manifests the company's strategic considerations beyond immediate financial incentives. This decision, amid declining performance in Italy, underlines Vodafone's broader evaluative process in choosing partnerships and mergers that align with its long-term strategic goals and market positioning.
Internationally, Vodafone's influence extends into the healthcare sector, with the company's capabilities in telecommunications being recognized for their potential to contribute to healthcare advancements. The intersection of telecommunications and healthcare underscores a trend towards integrated solutions that harness technology to improve healthcare delivery and access. Vodafone's acknowledgment in discussions on healthcare innovations exemplifies the broader applicability of its services and infrastructure, opening avenues for involvement in sectors beyond traditional telecommunications.
Collectively, these developments paint a picture of a telecommunications heavyweight exploring strategic avenues for growth, while navigating regulatory, competitive, and geopolitical landscapes. Vodafone's maneuvers, from rejecting mergers to engaging in significant market consolidations and exploring roles in cross-sectoral advancements, highlight its aspirations to remain a leading force in the telecommunications industry. The company's strategies and decisions offer a lens into both the challenges and opportunities presented in the current global market, positioning Vodafone as a key player to watch in the complex interplay of telecommunications, technology, and healthcare sectors.
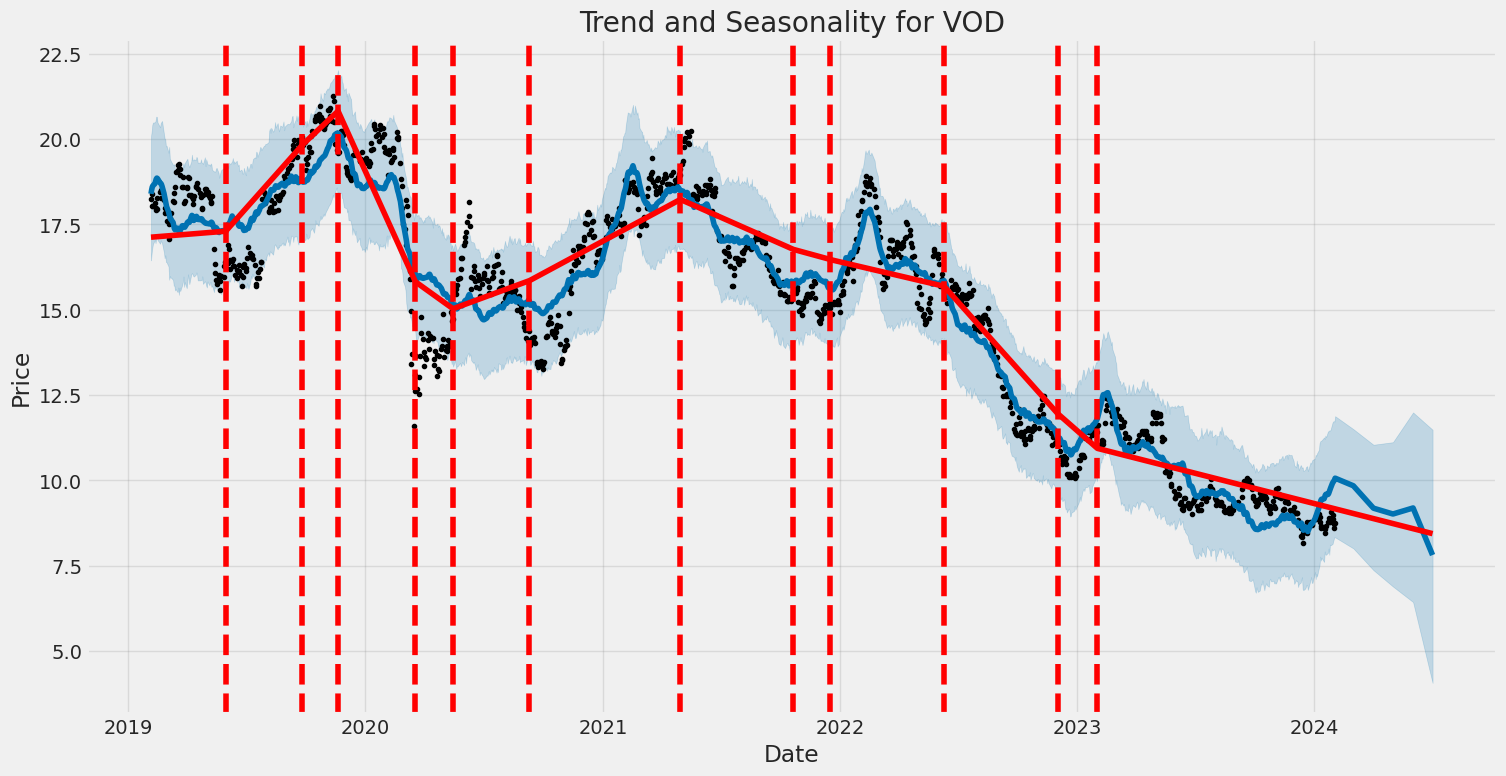
The Vodafone Group Public Limited Company (VOD) has experienced periods of significant volatility from 2019 to 2024, as analyzed through a Zero Mean - ARCH model. The model indicated a constant volatility level (omega) at 3.1781, with an additional component of volatility (alpha[1]) at 0.1933, illustrating that past returns significantly influence future volatility. The statistical analysis demonstrates how VOD's volatility isn't static but adjusts over time in response to market movements and past performance.
| Statistic Name | Statistic Value |
|---|---|
| Log-Likelihood | -2607.51 |
| AIC | 5219.01 |
| BIC | 5229.29 |
| No. Observations | 1,257 |
| omega | 3.1781 |
| alpha[1] | 0.1933 |
When analyzing the financial risk of a $10,000 investment in Vodafone Group Public Limited Company (VOD) over a one-year period, it is crucial to employ a robust analytical framework. This analysis integrates volatility modeling with machine learning predictions to offer a comprehensive understanding of potential investment risks.
Volatility modeling, particularly with the framework that captures the autocorrelation of stock returns and volatility clustering, serves as an essential tool in understanding Vodafone Group Public Limited Company's stock volatility. By leveraging historical price data, this model can quantify the extent of price fluctuations that the company's stock might experience in the future. This forms the base of the analysis as understanding and quantifying risk associated with volatility is fundamental in financial risk management.
Subsequently, the incorporation of machine learning predictions, specifically utilizing an ensemble learning method that aggregates multiple decision trees to improve prediction accuracy, plays a pivotal role in forecasting future stock returns of Vodafone Group Public Limited Company. By analyzing historical data and extracting features that potentially influence the stock's future price, this approach provides a forecast of returns, which is instrumental in assessing investment risks.
Combining these two analytical strands allows for a nuanced view of potential risks by capturing both the inherent volatility of the stock and providing an educated forecast of its future price movement.
The calculated Annual Value at Risk (VaR) at a 95% confidence interval for a $10,000 investment in Vodafone Group Public Limited Company stands at $273.96. This figure represents the potential loss in value that the investment could experience over a one-year period with a 5% probability of occurrence. In simpler terms, there is a 95% confidence that the investor would not lose more than $273.96 on their $10,000 investment over the next year due to price fluctuations in the company's stock, under normal market conditions. This VaR calculation is informed by the results from both the volatility modeling and machine learning predictions, demonstrating how the combination of these methods can provide a detailed picture of potential financial risk.
The analysis here leverages volatility modeling to capture the dynamic nature of stock price movements and integrates it with machine learning predictions to forecast returns, culminating in a calculated VaR that quantifies risk. Through this approach, the potential risks associated with an equity investment in Vodafone Group Public Limited Company are not only highlighted but also quantified, showcasing the efficacy of integrating different analytical methods to assess investment risks comprehensively.
Analyzing the provided options chain for Vodafone Group Public Limited Company (VOD) and focusing on call options, we notice several intriguing options based on the Greeks and their potential profitability. When considering profitable options, one should balance risk (represented by delta and gamma), with the potential rate of return, taking into account theta (time decay), vega (sensitivity to volatility), and rho (sensitivity to interest rate changes). Moreover, the return on investment (ROI) and profit figures guide us in identifying those options that stand out for a target stock price increase of 5%.
Starting with options that have shorter days to expiration (DTE), an option with a strike price of $8.0, expiring on 2024-02-16, presents a very high ROI of approximately 50.89% and a modest profit. Remarkably, this option exhibits significant gamma and vega, indicating high sensitivity to the stock's price and volatility movements, respectively, although it also comes with a higher risk due to its gamma value. The relatively low theta suggests that time decay will not erode its value too rapidly as we approach expiration.
Moving to options with medium-term expiration, specifically those expiring on 2024-04-19, we notice an interesting option at a $5.0 strike. It has a relatively high delta of 0.875, low theta, indicating minimal time decay, and significant gamma and vega values suggesting sensitivity to the underlying price and volatility swings. Its ROI of about 26.57% and profit potential make it an attractive medium-term investment for those betting on a rise in VOD's stock price.
For longer-term considerations, an option expiring on 2025-01-17 with a strike price of $5.0 catches the eye. It features a delta of 0.777, indicating a strong movement with the underlying stock, a very low theta, ensuring that time decay is minimal over its longer life, and a high rho value, which means it will benefit from any rises in interest rates. With a moderate ROI and a potential profit, this option offers a blend of appreciation potential and hedging against time decay and interest rate changes over a more extended period.
Lastly, for those with a long-term investment horizon, an option expiring on 2026-01-16 with a $5.0 strike shows a promising balance. The delta is 0.661, indicating a positive but not excessive sensitivity to stock price movements, and it has the highest vega among the options, making it highly responsive to volatility shifts. This is paired with a significantly high rho, which could considerably boost its price if interest rates rise. Its ROI is notable, backed by a substantial profit potential, illustrating its long-term attractiveness.
In summary, selecting the most profitable call options requires balancing immediate profit potential with risk factors associated with the Greeks. Shorter-term options may provide quick profits but at higher risk, while medium to long-term options offer a blend of growth potential and protection against volatility, time decay, and interest rate changes. Investors should align their selections with their risk tolerance, investment horizon, and expectations of market movements.
Similar Companies in Telecom Services:
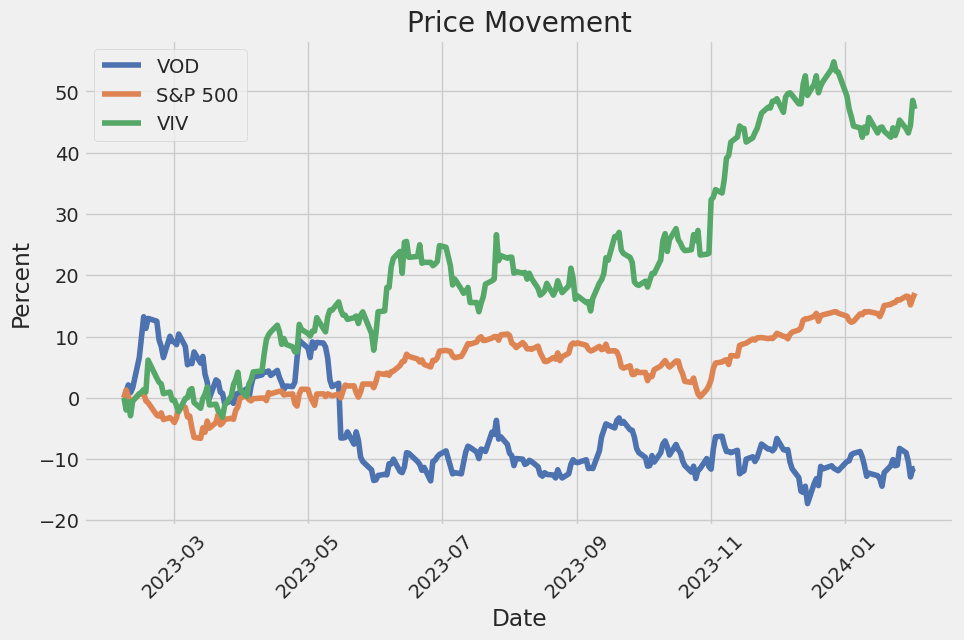
Telefonica Brasil S.A. (VIV), Orange S.A. (ORAN), Grupo Televisa, S.A.B. (TV), America Movil, S.A.B. de C.V. (AMX), Telefonica, S.A. (TEF), SK Telecom Co.,Ltd (SKM), Report: AT&T Inc. (T), AT&T Inc. (T), T-Mobile US, Inc. (TMUS), Report: Comcast Corporation (CMCSA), Comcast Corporation (CMCSA), Lumen Technologies, Inc. (LUMN), DISH Network Corporation (DISH), Report: Verizon Communications Inc. (VZ), Verizon Communications Inc. (VZ), Charter Communications, Inc. (CHTR)
https://seekingalpha.com/article/4661507-46-ideal-2024-fortune-and-barrons-dividogs
https://finance.yahoo.com/m/8ccbe996-76fc-33e7-ae87-f0b625cdbe09/3-ridiculously-cheap-british.html
https://finance.yahoo.com/m/26f8a8a0-4e03-30b1-8874-c788717d5e43/uae-stake-in-vodafone-is-a.html
https://www.cnbc.com/2024/01/26/vodafone-and-three-uk-merger-under-investigation-by-cma.html
https://finance.yahoo.com/news/uk-regulator-launches-investigation-vodafone-100952271.html
https://finance.yahoo.com/news/iliad-says-vodafone-rejects-proposal-075742922.html
https://finance.yahoo.com/m/d3349ebd-9759-3487-a7ab-2663143f09a6/vodafone-shares-fall-after.html
https://finance.yahoo.com/m/a42f418f-dc83-3914-baf3-71ec11994d9d/tech%2C-media-%26-telecom.html
https://finance.yahoo.com/m/05095795-3b9c-3779-9926-4d5d04de0732/health-care-roundup%3A-market.html
Copyright © 2024 Tiny Computers (email@tinycomputers.io)
Report ID: U3LcWw
Cost: $0.47229
https://reports.tinycomputers.io/VOD/VOD-2024-02-04.html Home