Energy Select Sector SPDR Fund (ticker: XLE)
2024-01-27
 The Energy Select Sector SPDR Fund (ticker: XLE) is a sector-focused exchange-traded fund (ETF) that aims to provide investment results that correspond generally to the price and yield performance of the Energy Select Sector Index. This index seeks to provide an effective representation of the energy sector of the S&P 500 Index. The ETF encompasses companies from various segments within the energy sector, including oil, gas, and consumable fuels, as well as energy equipment and services industries. Major holdings within the XLE portfolio often include top industry players such as Exxon Mobil, Chevron, and ConocoPhillips, reflecting the funds focus on large-cap energy corporations. The fund's investment approach is passive in nature, tracking the index with a goal of providing broad exposure to the energy sector, which can be crucial for investors looking to diversify their portfolio or gain specific exposure to the performance of the energy market. It is traded on the New York Stock Exchange Arca and is widely used by both institutional and individual investors as a tool for their investment strategies, including hedging, precise positioning within the energy sector, or for longer-term investment purposes. It is important for potential investors to consider the inherent volatility of the energy market due to fluctuations in energy prices, geopolitical risks, and the impact of environmental policies when considering an investment in XLE.
| Previous Close | 83.63 | Open | 83.54 | Day Low | 82.925 |
| Day High | 84.28 | Trailing P/E | 7.799583 | Volume | 18,125,318 |
| Average Volume | 18,930,142 | Average Volume (10 days) | 17,623,010 | Bid | 84.2 |
| Ask | 84.25 | Bid Size | 1,300 | Ask Size | 1,100 |
| Yield | 3.55% | Total Assets | $36,179,456,000 | 52 Week Low | 75.36 |
| 52 Week High | 93.69 | 50 Day Average | 83.4644 | 200 Day Average | 84.59495 |
| Trailing Annual Dividend Rate | 2.16 | Trailing Annual Dividend Yield | 2.5828054% | NAV Price | 81.80646 |
| YTD Return | -2.44513% | Beta (3 Year) | 0.71 | Three Year Average Return | 30.01663% |
| Five Year Average Return | 11.16801% | ||||
| Sharpe Ratio | -18.494642732718685 | Sortino Ratio | -286.5631338649568 |
| Treynor Ratio | -0.008470447589124587 | Calmar Ratio | -0.13889449559259112 |
Based on the provided technical, fundamental, and balance sheet data for the Energy Select Sector SPDR Fund (XLE), a comprehensive analysis can provide an informed prognosis on the possible stock price movement for the next few months.
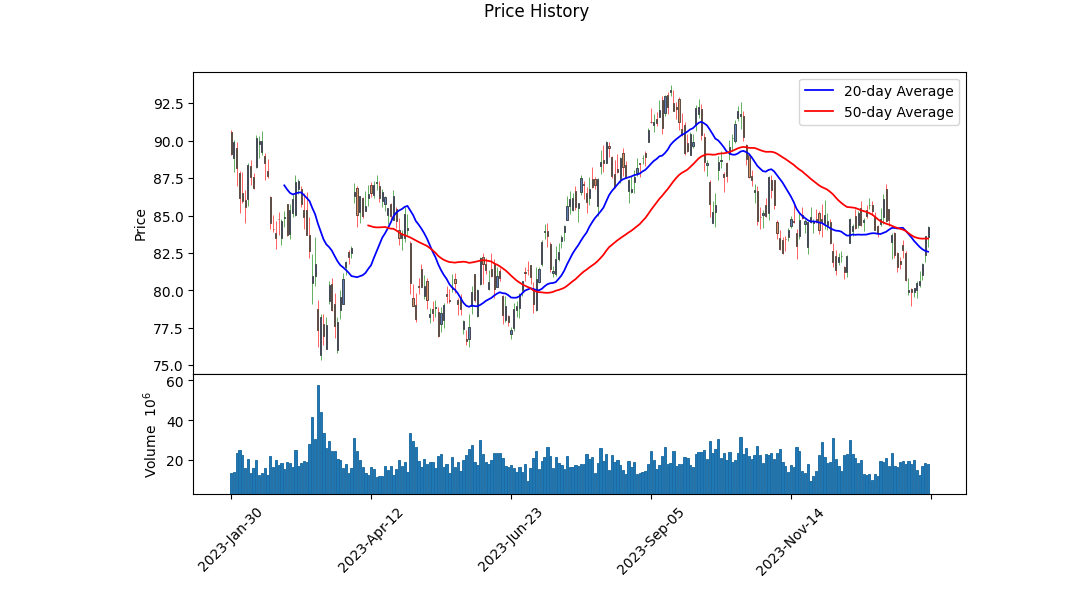
Technically, the movement of XLE has shown a recent uptick in price from the open to close, signified by the positive MACD histogram values. The MACD, a momentum indicator, suggests that the stock may be coming out of a bearish phase and entering a potentially bullish trend. This is reinforced by the OBV (On-Balance Volume) which, despite its decline over the period, shows a reduced rate of volume outflow, possibly indicating abating selling pressure.
Fundamentally, XLE has a low trailing PE ratio of 7.80, indicative of an undervalued status relative to earnings which might be attractive to value investors. Furthermore, the ETF maintains a healthy dividend yield of 3.55%, which could lure in income-focused investors. However, the significant assets under management, coupled with a negative YTD total return and a low beta value, suggest that while the fund is less volatile than the broader market, it may also not fully capture the upside during market rallies.
The robustness of the fund is questioned, however, by the risk-adjusted return ratios provided. The extraordinarily negative Sharpe and Sortino ratios signal that the fund has provided poor risk-adjusted returns over the past year. Both these ratios consider volatility and downside volatility, respectively, which means XLE's performance has not compensated for its risks efficiently. Similarly, the negative Treynor and Calmar ratios further highlight this inefficiency, considering market risk and prolonged drawdown periods.
Weighing technical indicators with the fundamentals and risk-adjusted returns, there might be a cautious optimism for XLE in the upcoming months. The MACD histogram's positive trend signals a potential turnaround while the high total assets and PE ratio suggest a strong foundation and undervaluation. However, potential investors must consider the concerning risk-adjusted return ratios.
In conclusion, while the preceding analysis delineates a budding positive technical outlook, the alarmingly negative risk-adjusted measures warrant prudence. Investors should monitor XLE's performance against market trends and be attentive to changes in the energy sector's environment which can greatly affect the ETF. Analyst expectations, reflecting a conservative position due to the subdued yield and beta, underpin this cautionary stance. As with all investments, particularly in sector-focused funds, diversification and vigilance remain prudent strategies.
| Statistic Name | Statistic Value |
| R-squared | 0.383 |
| Adjusted R-squared | 0.383 |
| F-statistic | 779.0 |
| Prob (F-statistic) | 9.25e-134 |
| No. Observations | 1,257 |
| AIC | 5,056 |
| BIC | 5,067 |
| Alpha | 0.0015 |
| Beta | 1.0805 |
The relationship between the Energy Sector SPDR (XLE) and the S&P 500 ETF (SPY) is quantitatively expressed through a linear regression analysis. This model estimates the sensitivity of XLE returns to the movements in SPY, which is considered to represent the broad stock market index. The alpha () value of the regression is 0.0015, which implies that on an average daily basis, XLE outperforms the estimated benchmark by 0.15%. In understanding the significance of alpha, it is important to recognize that a positive alpha indicates that XLE generates a premium return over and above what is predicted by the model after accounting for the market's returns. The beta () of XLE to SPY is 1.0805, suggesting that for every 1% change in SPY, XLE is expected to change by 1.0805% in the same direction.
This model's strength is partly indicated by the R-squared value, which at 0.383, signifies that approximately 38.3% of the variability in XLE's return is explained by the changes in SPY's return. Further diagnostic tests, including the F-statistic, demonstrate the overall significance of the model, while the p-values associated with beta show that the coefficient is statistically significant, supporting the predictive power of SPY for XLE returns. However, the alpha's p-value suggests that its coefficient is not significantly different from zero, which would indicate that over the period in question, XLE does not consistently earn a return above or below the predicted outcome after accounting for market movements.
The Energy Select Sector SPDR Fund (XLE) reflects a broad overview of the energy sector's performance and is representative of key players within this market. Known for its focus on energy-related companies, XLE offers an investment vehicle that captures the shifts and movements within this dynamic industry. In recent market discussions and reports, there has been a variety of views expressed about the viability and prospects of investing in energy through instruments like the XLE.
One argument put forth is the undervaluation of energy sector components. This perspective considers the energy sector as an "underloved space," suggesting that despite being overlooked by some investors, there may be value opportunities. The XLE fund, which provides diversified exposure to the energy sector including giants in oil, gas, and various services, could be an advantageous pick for those scrutinizing overlooked market sectors for potential investments.
This opinion resonates with some market participants who see XLE as a means to gain comprehensive exposure to the sector without the risks associated with picking individual energy stocks. As the energy sector experiences its cyclical nature, tracking broader economic trends, strategic investment in funds like XLE during favorable market conditions could lead to significant gains.
Its important to note the top holdings within the XLE portfolio, which consist of some of the heavyweight companies in the energy industry. Below is a table titled 'Top Ten Holdings', which outlines the companies that constitute a major part of the funds investments:
| company | symbol | percent |
|---|---|---|
| Exxon Mobil Corp | XOM | 22.32 |
| Chevron Corp | CVX | 17.45 |
| ConocoPhillips | COP | 9.18 |
| EOG Resources Inc | EOG | 4.70 |
| Schlumberger Ltd | SLB | 4.64 |
| Phillips 66 | PSX | 3.93 |
| Marathon Petroleum Corp | MPC | 3.78 |
| Pioneer Natural Resources Co | PXD | 3.52 |
| Valero Energy Corp | VLO | 2.97 |
| Williams Companies Inc | WMB | 2.84 |
The performance of the XLE tends to be closely linked to the strategic management of oil reserves by the U.S. government. The recent actions to refill the Strategic Petroleum Reserve (SPR) could potentially provide a stabilizing effect on oil prices, creating a "soft floor" that benefits the energy sector. For XLE, which tracks companies involved in the production and supply of oil, this government policy acts as a supportive backdrop for its holdings.
On the geopolitical front, escalating tensions in the Red Sea, particularly involving Yemeni Houthi rebels, have demonstrated the sensitivity of crude oil prices to conflict, which can influence the performance of XLE. The security concerns following coordinated airstrikes by the U.S. and UK on Iran-backed forces have considerable implications for oil transportation, and, by extension, the energy sector investments.
Mergers and acquisitions (M&A) activity in the energy sector has also gathered pace, as seen with Chesapeake Energy's strategic move to acquire Southwestern Energy. This all-stock transaction signals a consolidation trend that could lead to operational efficiencies and synergies. Chesapeake is expected to emerge as a significant player in natural gas production post-acquisition, impacting the market landscape in which XLE operates.
Conversely, some analysts have projected an oversupply in the oil market, suggesting a cautious approach to investments in the traditional energy sector. The imbalance between supply and demand could dampen the growth prospects for oil-related stocks. Nevertheless, recent developments at the UN Climate Change Conference, COP28, have indicated a global shift away from fossil fuels, further substantiating the diversification of large energy firms into renewables, which could affect XLEs longer-term strategy and composition.
Market commentators point to the potential boom in the nuclear energy sector, citing increasing investment opportunities and recognizing the shift in global energy consumption patterns. However, traditional energy holdings like those within XLE could face headwinds, given the risks and volatility associated with geopolitical disputes.
In the context of such developments, whether its considering the macro-impacts of government oil reserve strategies or micro-movements resulting from M&A activities, XLE represents an investment option that requires careful observation in light of shifting market dynamics and energy policies. The balance between traditional oil and gas companies and emerging renewable and nuclear energy sources is critical to the fund's potential success.
As methodologies and strategies for the energy sector evolve, the Energy Select Sector SPDR Fund continues to offer a snapshot of this transformation, residing at the epicenter of discussions and decisions geared towards the future of energy investments.
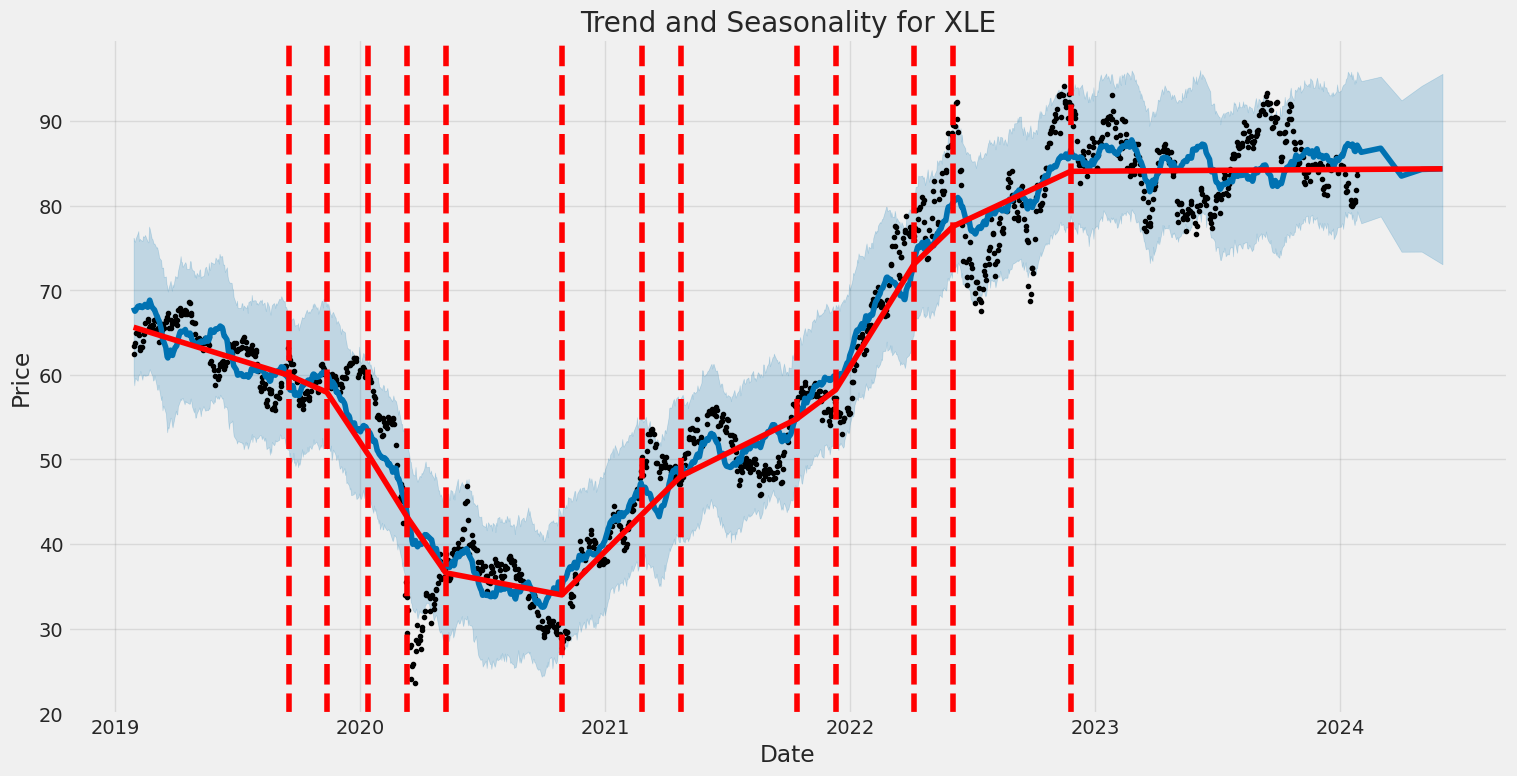
The Energy Select Sector SPDR Fund (XLE) exhibited notable volatility from January 2019 to January 2024. The Zero Mean - ARCH model, a statistical method used to understand this volatility, suggests that the variance of XLE returns (a measure of volatility) changed over time rather than being constant. Two key parameters, 'omega' and 'alpha[1]', show that there was a significant base level of volatility and that past volatility spikes were likely to influence future volatility, indicating a persistence in the fluctuation of prices.
Here's the HTML table representing the statistics without the date or time:
| Statistic Name | Statistic Value |
|---|---|
| R-squared: | 0.000 |
| Adj. R-squared: | 0.001 |
| Log-Likelihood: | -2,741.15 |
| AIC: | 5,486.29 |
| BIC: | 5,496.57 |
| No. Observations: | 1,257 |
| Df Residuals: | 1,257 |
| Df Model: | 0 |
| omega: | 3.5274 |
| alpha[1]: | 0.3246 |
Remember that these are simplified explanations and results generated from a statistical model that may have its own limitations and assumptions.
Analyzing the financial risk of a $10,000 investment in the Energy Select Sector SPDR Fund (XLE) over a one-year period requires a deep understanding of its stock volatility and future returns. To obtain a clearer picture of stock volatility, volatility modeling techniques are employed, particularly the one known for capturing time-varying variance. This approach is instrumental in appreciating the inherent instability of the fund's returns over time, considering the fluctuation in energy prices, market sentiment, and economic factors that could affect the energy sector.
For future returns prediction, a machine learning algorithm with an ensemble of decision trees, known for its ability to handle nonlinear relationships and interactions between features, can be used to predict future stock prices or returns. Unlike linear models, this machine learning algorithm does not assume that the relationship between input variables and the target variable is linear, making it more adaptable to the complex behavior of financial markets.
By combining the strengths of both models, we get a powerful assessment of risk and return. The volatility model's output is crucial for predicting future volatility, which is instrumental in the estimation of the Value at Risk (VaR). This figure is vital for investors because it gives an estimation of the maximum expected loss with a certain confidence level, in this case, 95%. VaR is a commonly used risk metric in finance, enabling investors to gauge the level of financial risk they are exposed to over a certain period here being one year.
An example result from this analysis could indicate that for a $10,000 investment in the XLE, there is a 95% chance that the investor will not lose more than $237.03 over the course of the upcoming year, under normal market conditions. It acknowledges that while market performance and volatility can never be predicted with complete certainty, the investor can be 95% confident that their maximum loss would not exceed this calculated threshold based upon the historical and predictive analyses conducted.
The overall integration of volatility modeling and machine learning predictions offers a comprehensive view of potential risks in equity investment, serving to inform investors of possible outcomes based on historical and predicted performance, within the confines of the constructed models' assumptions and accuracy. This robust approach provides a more nuanced understanding of financial risk compared to traditional assessments that may not account for the dynamic nature of stock market volatility and potential non-linear interactions in future stock returns.
Similar Companies in None:
Report: Financial Select Sector SPDR Fund (XLF), Financial Select Sector SPDR Fund (XLF), Health Care Select Sector SPDR Fund (XLV), Technology Select Sector SPDR Fund (XLK), Utilities Select Sector SPDR Fund (XLU), Industrial Select Sector SPDR Fund (XLI), Exxon Mobil Corporation (XOM), Chevron Corporation (CVX), ConocoPhillips (COP), EOG Resources, Inc. (EOG), Report: Schlumberger Limited (SLB), Schlumberger Limited (SLB), Report: Marathon Petroleum Corporation (MPC), Marathon Petroleum Corporation (MPC), Phillips 66 (PSX), Valero Energy Corporation (VLO), Pioneer Natural Resources Company (PXD), Halliburton Company (HAL)
https://finance.yahoo.com/video/buy-atlanta-braves-skip-energy-225144434.html
https://finance.yahoo.com/video/cop28-agreement-details-behind-pledge-175948439.html
https://seekingalpha.com/article/4658751-xle-short-term-bear-long-term-bull
https://finance.yahoo.com/m/0ccf7735-55be-39cc-9d4b-e5cba8df731d/refilling-the-u.s.-strategic.html
https://finance.yahoo.com/video/us-energy-outlook-american-oil-213042931.html
https://seekingalpha.com/article/4661272-equity-etfs-start-2024-with-14th-straight-weekly-inflow
https://seekingalpha.com/article/4661344-equity-cefsetfs-top-picks-for-2024-part-ii
https://finance.yahoo.com/video/nuclear-power-entering-boom-era-224258104.html
https://finance.yahoo.com/video/oil-price-volatility-increases-red-151325863.html
https://finance.yahoo.com/video/chesapeake-buy-southwestern-energy-7-153026550.html
https://finance.yahoo.com/video/oil-prices-spike-us-uk-151552538.html
https://www.youtube.com/watch?v=gfINumMD_V4
https://www.youtube.com/watch?v=O-OSmxptZ6U
Copyright © 2024 Tiny Computers (email@tinycomputers.io)
Report ID: 6sgax1
Cost: $0.40980
https://reports.tinycomputers.io/XLE/XLE-2024-01-27.html Home