Air Products and Chemicals, Inc. (ticker: APD)
2024-03-21
 Air Products and Chemicals, Inc. (APD) operates as one of the leading global suppliers of industrial gases and related equipment. The company specializes in serving a diverse range of industries including technology, energy, healthcare, and food services, providing essential products like oxygen, nitrogen, hydrogen, and various specialty gases. With a strong focus on sustainable solutions, APD has increasingly invested in technologies that support the hydrogen economy and carbon capture efforts, positioning itself as a key player in the transition towards cleaner energy sources. Its global footprint is marked by strategic expansions, acquisitions, and joint ventures, aimed at enhancing its production capabilities and reaching emerging markets. Financial performance highlights include a robust revenue stream and a consistent dividend payout, reflecting its operational efficiency and commitment to shareholder value. The company's innovative approach and strategic investments in growth markets underscore its adaptability and potential for continued success in the evolving global industrial landscape.
| Address | 1940 Air Products Boulevard | City | Allentown | State | PA |
| Zip | 18106-5500 | Country | United States | Phone | 610 481 4911 |
| Website | https://www.airproducts.com | Industry | Specialty Chemicals | Sector | Basic Materials |
| Full Time Employees | 23,000 | Previous Close | 238.95 | Open | 239.18 |
| Day Low | 235.41 | Day High | 239.45 | Dividend Rate | 7.02 |
| Dividend Yield | 0.0294 | Payout Ratio | 0.6692 | Five Year Avg Dividend Yield | 2.19 |
| Beta | 0.821 | Trailing PE | 22.491882 | Forward PE | 17.54769 |
| Volume | 1,881,978 | Average Volume | 1,796,813 | Market Cap | 52,349,661,184 |
| Fifty Two Week Low | 212.24 | Fifty Two Week High | 307.71 | Price To Sales Trailing12Months | 4.2140326 |
| Profit Margins | 0.18815 | Enterprise Value | 64,934,535,168 | Shares Outstanding | 222,300,992 |
| Book Value | 66.905 | Price To Book | 3.519767 | Net Income To Common | 2,329,900,032 |
| Trailing EPS | 10.47 | Forward EPS | 13.42 | Peg Ratio | 2.9 |
| Total Cash | 2,243,500,032 | Total Debt | 12,803,099,648 | Total Revenue | 12,422,700,032 |
| Sharpe Ratio | -0.36183830100417896 | Sortino Ratio | -4.409065714381922 |
| Treynor Ratio | -0.11959409602029968 | Calmar Ratio | -0.33397670629871123 |
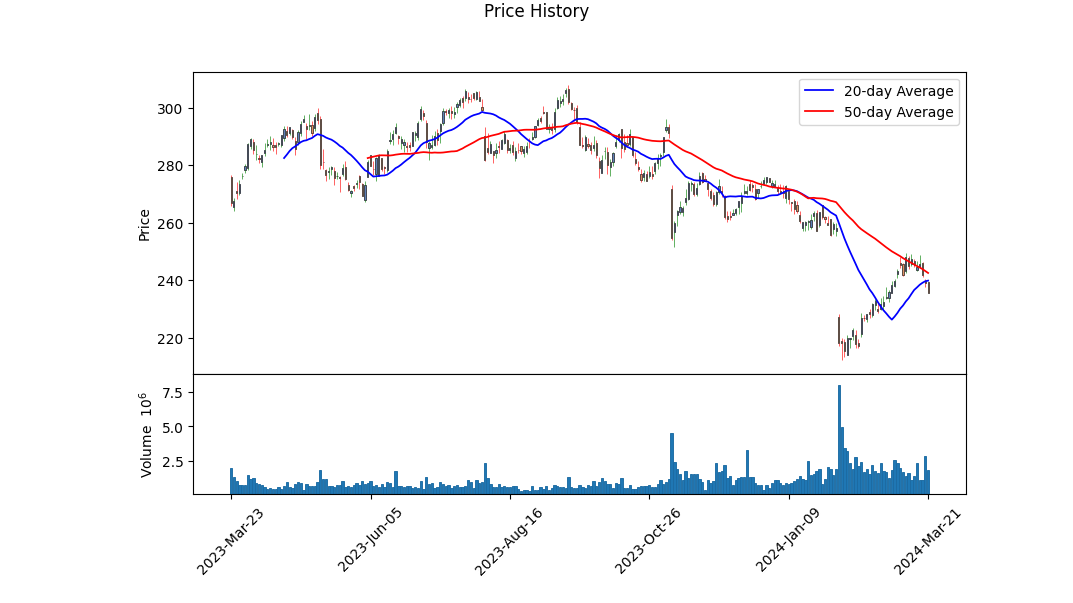
Analyzing the recent market trends with various technical indicators, APDs stock price has shown significant movements. Beginning the analysis period with a modest uptick in price, the stock entered a trend of gradual decline. This decline in price was accompanied by an increasing volume as denoted by the OBV indicator, suggesting that the recent price movements were backed by significant trading activity, likely indicative of institutional transactions. The MACD histogram, notable for its late appearance in the analysis period, transitions from positive to negative territory, signaling a bearish momentum towards the end of our observation window. This momentum shift suggests that the stock could face downward pressure in the short term.
From the fundamental analysis perspective, APD exhibits solid fundamentals with notable financial highlights such as a gross margin of 0.30547 and an EBITDA margin of 0.32608, indicating efficient operation and profitability. Moreover, operational margins stood at 0.21522, reflecting a strong operational efficiency relative to the revenue generated. The trailing PEG ratio of 1.4002 suggests that the stock might be slightly overvalued relative to its earnings growth, thus warranting cautious optimism.
Further scrutiny of the financial health through balance sheet analysis reveals increased net debt to $8,688,800,000 as of September 30, 2023, from $2,654,800,000 on September 30, 2020, indicating a significant rise in borrowings. This uptick in leverage could be a concern if not managed adequately but may also reflect growth-oriented investments or acquisitions.
The cash flows exhibit a mixed picture with a negative free cash flow of -$1,420,100,000 for the period ending September 30, 2023, which could indicate substantial investments or lower operating cash flow. However, a robust operating cash flow of $3,206,300,000 signifies healthy operational earnings capacity.
Analysis of analyst expectations and growth estimates suggests a positive outlook, with analysts projecting an earnings growth of 8.80% next year, and revenue growth estimates indicating a 7.20% year-on-year increment. This optimism is reflected in the analysts' average earnings estimate for the next year (2025) at 13.42, highlighting expectations of continued profitability and growth.
Given the technical and fundamental analysis, and despite the observed short-term bearish momentum indicated by the MACD histogram and potential concerns over increased leverage, APD possesses solid fundamentals that could support its recovery and growth in the medium to long term. However, investors should remain cautious of potential risks such as further increases in leverage or any shifts in industry dynamics that could impact profitability. The slightly overvalued stance indicated by the PEG ratio also calls for careful consideration of entering at current levels for those looking at long-term investment. Overall, assuming the company manages its debt levels effectively and continues to exhibit strong operational performance, APDs stock price could experience growth in the next few months, tempered by volatility in the short term due to current technical indicators and market sentiment.
In our analysis of Air Products and Chemicals, Inc. (APD) applying the principles outlined in "The Little Book That Still Beats the Market," we have calculated two critical financial metrics: the Return on Capital (ROC) and the Earnings Yield. The Return on Capital (ROC) for APD stands at 11.76%, which signifies how effectively the company utilizes its capital to generate profits; this is a measure of operational efficiency and profitability that is pivotal for assessing the company's performance. On the other hand, the Earnings Yield for APD is calculated at approximately 4.40%. The Earnings Yield provides insight into the return investors can expect on their investment from the company's earnings, inversely related to the P/E ratio. It is a valuable metric for investors looking to gauge the relative attractiveness of a company's stock, especially when compared to other investment opportunities. In summary, APD exhibits a solid Return on Capital, denoting efficient capital use, alongside a reasonable Earnings Yield, potentially marking it as an attractive investment based on the principles advocated in "The Little Book That Still Beats the Market."
Based on Benjamin Graham's value investing criteria, let's evaluate how Air Products and Chemicals, Inc. (APD) stands in comparison to his principles for stock screening and selection.
-
Margin of Safety: This fundamental criterion is not directly quantifiable from the given metrics. However, the margin of safety principle emphasizes buying stocks priced significantly lower than their intrinsic value. This concept primarily relies on an investor's valuation analysis, which isn't provided here. Nonetheless, a low P/E or P/B ratio could indicate that a stock is undervalued, thus potentially providing a margin of safety.
-
Debt-to-Equity Ratio: Graham preferred a low debt-to-equity ratio to limit financial risk. APD's debt-to-equity ratio is 0.7641288627741408, which indicates that the company has a moderate level of debt relative to its equity. While not exceedingly low, this ratio suggests that APD does not overly rely on debt financing, aligning acceptably with Graham's principles.
-
Current and Quick Ratios: Both these ratios assess the company's ability to cover its short-term obligations. For APD, the current ratio and quick ratio are both 1.3348991221315263. This indicates that APD can cover its short-term liabilities with its short-term assets, implying liquidity and financial health that Graham would approve of.
-
Earnings Growth: Although specific earnings growth figures are not provided, Graham looked for companies showcasing consistent earnings growth over the years. Prospective investors should examine APD's earnings track record for steady growth to meet Graham's recommendation.
-
Price-to-Earnings (P/E) Ratio: APD's P/E ratio is 23.564709806537696. When comparing this to industry P/E ratios, it's essential to find a relevant comparison. For instance, if we consider the closest relevant industry to APD's operations - "Chemicals," which unfortunately has a negative P/E (reflecting overall industry struggles or differences in accounting), making a direct comparison challenging. Nonetheless, APD's P/E ratio appears high, particularly in the context of Graham's preference for stocks with low P/E ratios. This discrepancy might indicate that APD's stock is overvalued according to Graham's criteria, especially without considering its growth prospects or other qualitative factors.
-
Price-to-Book (P/B) Ratio: APD's P/B ratio is 1.6357990971355363. Graham often sought stocks trading below their book value. While APD is above this threshold, its P/B ratio is not excessively high, suggesting that the company's market valuation is somewhat in line with its book value, although not strictly within Graham's most conservative criterion.
Conclusion: Air Products and Chemicals, Inc. shows moderate alignment with Benjamin Graham's value investing principles. Its debt-to-equity, current, and quick ratios suggest financial stability and relatively low financial risk. However, its P/E ratio, when compared to the broader industry averages, suggests that the stock might not be the undervalued opportunity Graham typically sought, unless justified by exceptional growth prospects or other factors not covered in this analysis. The P/B ratio also signals a valuation that does not strictly meet Graham's preference for stocks trading below book value. Investors aiming to follow Graham's investment philosophy should weigh these factors carefully, possibly looking into additional qualitative and quantitative analyses to assess the company's true intrinsic value and growth potential.Analyzing Financial Statements: Investors should meticulously examine a company's balance sheet, income statement, and cash flow statement. Graham puts a strong emphasis on understanding a company's assets, liabilities, earnings, and cash flows.
The financial data provided spans multiple periods and covers a wide array of financial metrics for AIR PRODUCTS AND CHEMICALS, INC., including revenues, cost of goods sold, operating income, net income, comprehensive income, assets, liabilities, equity, and cash flows among others. It also includes specific details such as depreciation, amortization, interest expense, tax expenses, share-based compensation, and dividends per share.
Key Observations:
-
Growth: There has been a notable growth in revenues over the analyzed periods, indicating a positive trend in sales and business expansion. For example, revenues have increased from $2,994,200,000 in Q1 2021 to $7,481,900,000 in Q3 2021. This suggests an upward trajectory in the company's operations and market demand for its products or services.
-
Profitability: The data reveals a pattern of solid operating and net incomes, indicative of effective cost management and operational efficiency. For instance, operating income progressed from $523,000,000 in Q1 2021 to $1,664,700,000 in Q3 2021, alongside comparable growth in net income.
-
Asset and Liability Management: AIR PRODUCTS AND CHEMICALS, INC. maintains a substantial level of assets compared to liabilities, contributing to a strong balance sheet position. Assets have grown significantly, from $26,252,100,000 in Q3 2021 to over $26.8 billion by the end of FY 2021. The company also prudently manages its debt levels, evident from the long-term debt figures and the management of current liabilities.
-
Investment in Growth: Capital expenditures, as a proxy for investment in growth, show considerable investment in property, plant, and equipment. This is coupled with strategic investments in affiliates, subsidiaries, associates, and joint ventures, reflecting the company's commitment to future growth and diversification.
-
Cash Flow Health: The cash flow statements present a healthy cash flow from operations, sufficient to cover investing and financing activities. Even with substantial capital expenditures, the company has managed to maintain positive cash and cash equivalents, demonstrating strong liquidity.
-
Equity and Shareholder Value: The company has been actively managing share-based compensation, dividends, and treasury stock, indicating a focus on creating shareholder value. Details such as dividends per share and share repurchases provide insights into the company's shareholder distribution policies.
-
Tax Management and Liabilities: The company shows competent management of its tax liabilities and benefits, with effective tax rates and unrecognized tax benefits being disclosed. This indicates robust tax planning and compliance strategies.
-
Comprehensive Income: The comprehensive income figures include foreign currency translation gains and losses, pension plan adjustments, and cash flow hedges, offering a broader perspective on the company's total income beyond net income. This showcases the company's exposure to various financial risks and its strategies to manage such risks.
Conclusion:
Based on the analysis of AIR PRODUCTS AND CHEMICALS, INC.'s financial statements, the company exhibits strong financial health characterized by revenue growth, profitability, solid asset base, and effective management of liabilities. Additionally, its investments in growth and strategic financial management practices highlight the company's potential for sustained success. However, investors should also consider market conditions, industry trends, and macroeconomic factors when making investment decisions.Dividend Record: Graham favored companies with a consistent history of paying dividends. The extensive list of dividends provided, spanning several years with steady and, in some cases, increasing dividend amounts, showcases a company that could potentially align well with Benjamin Graham's investment philosophy as outlined in "The Intelligent Investor." Focusing on the stability and growth in dividends, we observe a pattern of reliability and commitment to shareholder returns, which could indicate a financial strength and a management policy geared towards investor interests aspects highly valued by Graham. Through the detailed dividend records from 1983 to beyond, investors can analyze the company's historical performance in terms of dividend payouts, providing a foundation for assessing its potential as a prudent investment choice.
| Statistic Name | Statistic Value |
| Alpha | -0.0152 |
| Beta | 0.9327 |
| R-squared | 0.431 |
| Adj. R-squared | 0.431 |
| F-statistic | 951.0 |
| Prob (F-statistic) | 6.70e-156 |
| Log-Likelihood | -2217.1 |
| No. Observations | 1257 |
| AIC | 4438 |
| BIC | 4449 |
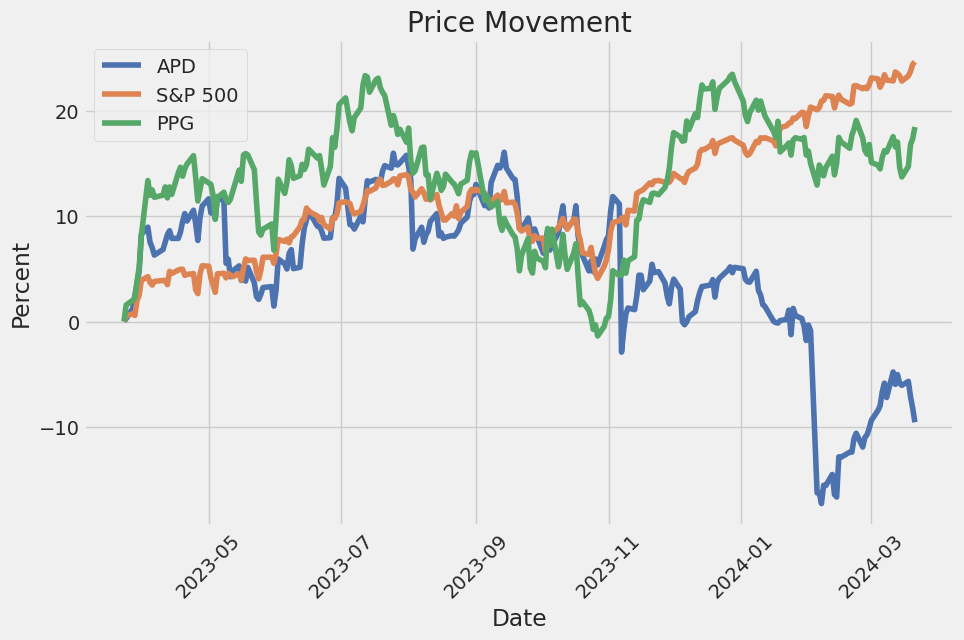
Analyzing the linear regression model between APD (Air Products and Chemicals, Inc.) and SPY (SPDR S&P 500 ETF Trust), which aims to capture the entirety of the market's movements, reveals a specific type of relationship. Alpha, represented in the model as -0.0152, essentially indicates the expected change in the value of APD when the SPY is stationary. Essentially, it gives us a perspective on APD's performance independent of the market's movement. A negative alpha, as seen here, might suggest that APD is expected to underperform the market slightly when the market's return is zero.
Moving forward, the beta coefficient, calculated as 0.9327 in this model, portrays APD's volatility in relation to the market. A beta value close to 1 indicates that APD's price is likely to move with the market. However, the unique focal point here is alpha. Despite a fairly strong correlation with the market, as indicated by a beta close to 1, the negative alpha value hints at a minor underperformance against the market baseline. Coupled with other statistical values like an R-squared of 0.431, the model sheds light on a significant but not overwhelmingly strong relationship between APD and the market's movements, with a slight inclination towards underperformance when market effects are neutralized.
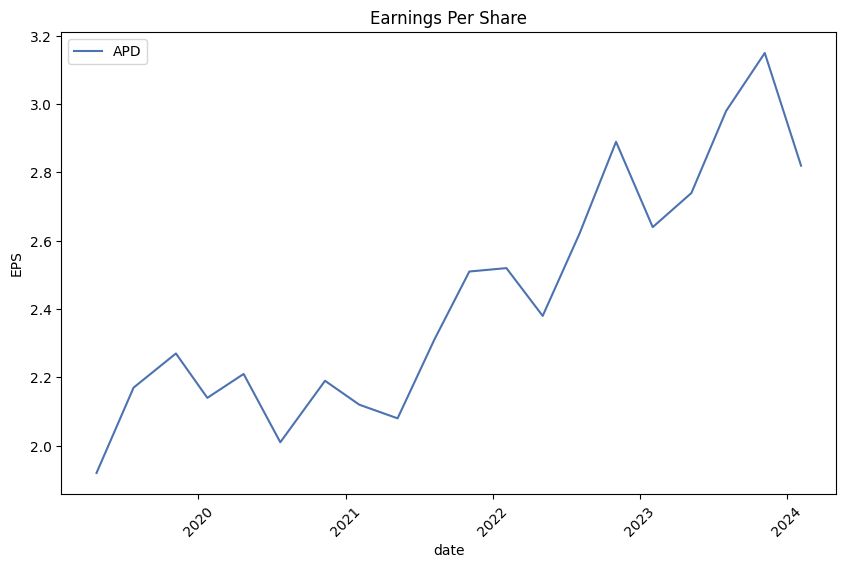
Air Products and Chemicals, Inc. (APD) conducted its first quarter earnings call for fiscal year 2024, revealing a mixed bag of results influenced by diverse global economic conditions, operational challenges, and strategic successes. Sidd Manjeshwar, Vice President of Investor Relations and Corporate Treasurer, introduced the session, highlighting that adjusted earnings per share (EPS) rose by 7% year over year to $2.82. This increase was attributed to several positive factors such as strong conversion margins, robust on-site activities in the Americas and Europe, and higher-quality affiliate income globally. However, these gains were somewhat offset by challenges, including larger-than-anticipated volume headwinds from economic slowdowns, particularly in China, and decreased helium demand in the electronics sector worldwide.
During the call, management revised its full-year guidance, now expecting adjusted EPS to range between $12.20 and $12.50. This adjustment reflects the impact of first-quarter events, evolving geopolitical developments and uncertainties, continued weakness in Asia, and helium volume reductions. Seifi Ghasemi, Chairman, President, and CEO of Air Products, emphasized the company's ongoing commitment to investment in high return projects and highlighted a recent increase in the quarterly dividend, underscoring the company's balanced approach to capital allocation and shareholder value creation.
On operational fronts, Melissa Schaeffer, Chief Financial Officer, detailed the quarter's financials, indicating an 8% improvement in EBITDA despite higher costs driven by maintenance activities and inflation. She also highlighted the EBITDA margin, which jumped more than 500 basis points, aided largely by lower energy cost pass-through. Seasonal factors and sale of equipment headwinds had unfavorable impacts sequentially.
Looking at geographic performance, the Americas and Europe segments demonstrated strong growth, while the Asia segment faced pressures from the challenging economic landscape in China and the weak electronics market. The Middle East and India's performance was notably improved due to contributions from the second phase of the Jazan project. The corporate segment saw a decline in EBITDA due to higher costs in non-LNG sale of equipment business, although LNG activities remained robust. In summary, the earnings call painted a picture of a company grappling with both predictable and unforeseen challenges while continuing to pursue a growth strategy focused on industrial gases and clean hydrogen projects, aiming to navigate the complex global market dynamics and shifting economic conditions.
ears. Income tax payments, net of refunds, were $90.1 and $88.5 for the three months ended 31 December 2023 and 2022, respectively.
Diluted Earnings per Share
Diluted EPS was $2.73 for the first quarter of fiscal year 2024, increasing by 6% or $0.16 per share from the first quarter of fiscal year 2023. The increase was primarily due to higher equity affiliates' income, favorable pricing, higher volumes, and lower energy cost pass-through to customers. These positive factors were partially offset by higher costs, including those related to planned maintenance and labor inflation. Non-service related pension costs also unfavorably impacted EPS. Adjusted diluted EPS, which excludes non-service pension costs, was $2.82, representing a 7% increase or $0.18 per share from the prior year's first quarter.
Operating Segments Performance
The Americas segment experienced an increase in operating income mainly due to higher volumes, especially in the hydrogen business, and favorable pricing actions which more than offset higher costs. The Asia segment saw a decrease in operating income primarily due to lower pricing and higher costs. In Europe, higher volumes in the hydrogen business contributed to an increase in operating income, while the Middle East and India segment's operating income increased marginally. Corporate and other segment experienced higher costs, negatively impacting operating income.
Liquidity and Capital Resources
Air Products maintained a robust liquidity position in the first quarter of fiscal year 2024, with cash and cash items increasing to $1,962.6 from $1,617.0 at the end of fiscal year 2023. This increase was primarily due to cash provided by operating activities and financing activities, including long-term debt proceeds and net increases in commercial paper and short-term borrowings, partially used for capital expenditures, dividend payments, and repayment of long-term debt. Total debt increased due to new borrowings, including for the financing of the NEOM Green Hydrogen Project.
Capital Expenditures
Capital expenditures were $1,445.5 for the three months ended 31 December 2023, primarily related to significant investments in growth projects, including the NEOM Green Hydrogen Project. This represents a significant increase from the prior year due to the timing of project construction and investments in new growth opportunities.
Outlook
Air Products continues to focus on growth through strategic investments in key markets and technologies, including green hydrogen and other sustainable energy projects. We are cautiously monitoring the impacts of global economic conditions, energy costs, and currency fluctuations on our operations and financial performance. Our strong balance sheet and focus on operational excellence position us well to navigate the challenges and capitalize on opportunities to drive long-term shareholder value.
Air Products and Chemicals, Inc. has been consistently making headlines for its contributions to various sectors, including industrial gases and renewable energy solutions. This company has carved a niche for itself by focusing not just on profitability but also on sustainable and environmentally friendly practices. Its significance is highlighted across different analyses, underscoring its strategic market positioning and financial health, appealing to a broad spectrum of investors interested in dividend yield and sustainability.
This entity's commitment to innovation and environmental stewardship is evident in its ventures into the hydrogen economy and carbon capture technologies. Such endeavors align with global efforts against climate change, showcasing Air Products' role in the industrial gas sector's shift towards sustainability. It's this forward-looking approach that positions Air Products as a key player in green technology and clean energy solutions, reflecting in its growth and profitability trajectory driven by increasing demand for such technologies.
Financially, Air Products demonstrates robust performance, underscored by its classification as a dividend aristocrat. The companys strategy to enhance shareholder value through consistent dividend growth is notable, especially in an economic landscape where investment stability is highly prized. This financial resilience and commitment to returning value to shareholders make Air Products an attractive investment vehicle, particularly given the anticipated future economic trends and their potential impact on the company.
The analysis further delves into the challenges and opportunities faced by Air Products in the context of the broader economic landscape, especially concerning its market in China. The remarks by CEO Seifi Ghasemi on the subdued outlook for China's economy and the corresponding adjustments in the company's earnings outlook highlight the nuanced approach Air Products is taking towards navigating global market fluctuations and sector-specific challenges.
Moreover, the company's strategic investments, notably in the energy transition economy, underscore its commitment to aligning with global sustainability goals. These investments not only certify Air Products' role in fostering a sustainable future but also signal strong growth prospects, making it an appealing option for investors.
Air Products' financial health and strategic market positioning are further reinforced by its performance comparisons and reactions within the investment community. For instance, the upgrade by Bank of America from "neutral" to "buy", following a valuation challenge, illustrates the markets positive reassessment of Air Products operational dynamics and future prospects. This development, along with the company's participation in industry-specific expos and conferences, highlights its proactive approach in communicating its strategic directions and innovations to the market.
In presenting at the J.P. Morgan Industrials Conference, Air Products outlined its goals and initiatives, emphasizing its contributions towards the energy transition and sustainability. Such platforms provide the company with an avenue to articulate its long-term strategies and engage with investors, further solidifying its market positioning.
In sum, Air Products and Chemicals, Inc. exemplifies a blending of financial stability, commitment to sustainability, and strategic market presence. Its endeavors in hydrogen energy and carbon capture, coupled with a solid dividend growth history, present a compelling narrative for investors prioritizing stable and sustainable investment opportunities. Through strategic investments, operational excellence, and a focus on emerging market needs, Air Products underscores its global leadership in the industrial gases sector and its pivotal role in advancing global sustainability and energy transition goals.
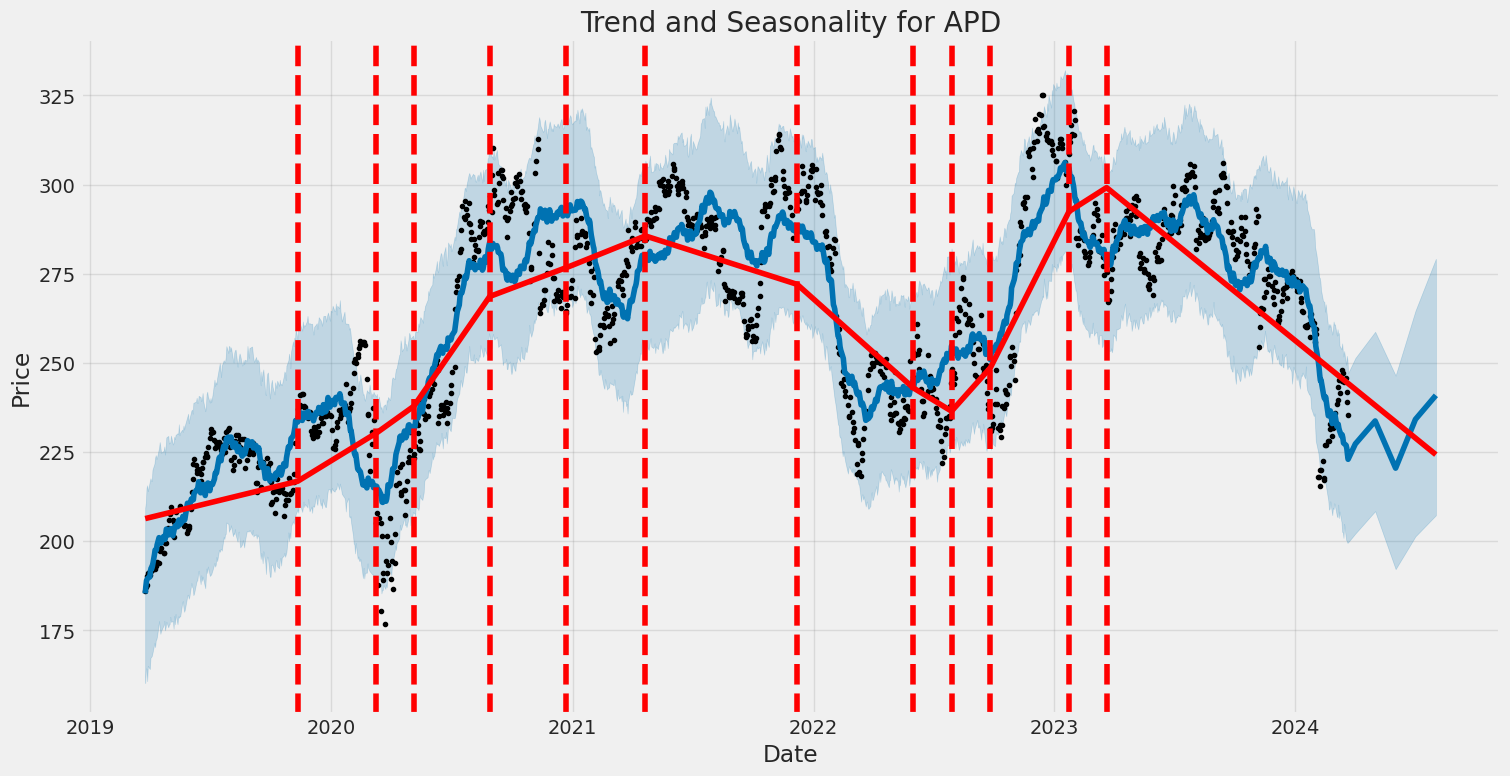
The volatility of Air Products and Chemicals, Inc. (APD) from March 2019 to March 2024 is quite evident from the ARCH model results. Firstly, the model indicates a significant level of volatility as shown by the coefficient omega at 2.4624, suggesting notable fluctuations in asset returns. Additionally, the alpha[1] value at 0.2757 further confirms the presence of volatility, indicating a responsiveness to past squared returns. These statistics highlight that APD's stock price experienced considerable fluctuations during this period, underlining the unpredictable nature of its returns.
| Statistic Name | Statistic Value |
|---|---|
| Log-Likelihood | -2482.13 |
| AIC | 4968.26 |
| BIC | 4978.53 |
| No. Observations | 1,257 |
| omega | 2.4624 |
| alpha[1] | 0.2757 |
The financial risk associated with a $10,000 investment in Air Products and Chemicals, Inc. (APD) over a one-year period can be comprehensively analyzed through a combination of volatility modeling and machine learning predictions. This integrated approach allows for a nuanced understanding of the fluctuations in the stock's price and predictive insights into its future performance.
Volatility modeling, in this context, is instrumental in capturing the dynamic nature of APD's stock volatility. By analyzing historical price data, this model identifies patterns in the price fluctuation over time. It quantifies the degree of variation in the stock price, which is crucial for assessing market risk. This method is particularly valuable for understanding how external factors and market sentiment can influence APD's stock volatility levels, which, in turn, impacts the risk profile of the investment.
On the other hand, machine learning predictions employ a sophisticated algorithm that learns from the historical stock price data of APD. By taking into account numerous variables that could affect stock performance, including past volatility, this approach forecasts future returns. The essence of this method lies in its adaptability and learning capability, which refines its predictive accuracy over time. It goes beyond traditional analysis by dynamically adjusting to new data and uncovering complex patterns that might not be apparent through conventional methods.
When these two methodologies are combined, they offer a robust framework for assessing the financial risk of investing in APD. The volatility model establishes the groundwork by delineating the stock's volatility pattern, which is essential for understanding the range of potential price movements. Concurrently, the machine learning approach forecasts future stock returns, providing a forward-looking perspective on the investment's potential yield.
The culmination of this analysis is reflected in the calculated Annual Value at Risk (VaR) at a 95% confidence level for the $10,000 investment, which is $300.60. This metric is pivotal as it quantifies the maximum expected loss over a specified timeframe, given normal market conditions. In this case, it suggests that there is a 5% chance that the investment could lose more than $300.60 over the next year. This figure is instrumental for investors in understanding the potential downside risk and in making informed decisions about their investment in APD.
By leveraging volatility modeling to delineate APD's price fluctuations and integrating it with machine learning predictions for future returns, investors gain a comprehensive view of the stock's risk profile. This combination not only highlights the potential financial risk involved with the investment but also showcases the effectiveness of using advanced analytical tools to navigate the complexities of equity investment.
Analyzing the options chain for Air Products and Chemicals, Inc. (APD) call options and focusing on various Greeksdelta, gamma, vega, theta, and rhowe can discern which options might present more profitable opportunities based on a target stock price increase of 5%. The Greeks offer insights into the sensitivity of an option's price relative to certain factors, namely the underlying stock price changes (delta and gamma), volatility (vega), time decay (theta), and interest rate changes (rho).
First, consider the options with expiration dates closer to the current date, specifically the options expiring on 2024-04-19. The call option with a strike price of $220 and 28 days until expiration stands out with a very high return on investment (ROI) of approximately 0.6229, indicating it could be more profitable in a high-growth scenario. This option has a delta of 0.7407, meaning for every dollar increase in APD's stock price, the option's price would increase by approximately 74 cents. Its high vega of 21.0105 also suggests it's quite sensitive to changes in implied volatility a useful trait if we expect market volatility to increase.
Shifting focus to mid-term options, the call option expiring on 2024-06-21 with a strike price of $150 shows an intriguing combination of high delta (0.8516) and substantial profit ($25.9645), alongside an ROI of 0.3642. This option might be particularly appealing for investors bullish on APD, expecting a significant price rise surpassing our 5% target. The high delta indicates a strong responsiveness to stock price movements, whereas its ample days to expiration allow some flexibility for the anticipated move to unfold.
For those with a longer investment horizon, the option expiring on 2025-01-17 with a strike price of $165 emerges as attractive, characterized by a notable balance between delta (0.8156) and a high ROI of approximately 0.4560, pointing to its potential profitability. Furthermore, this option displays a substantial profit of $25.7645. The blend of a relatively high delta and an appreciable ROI underscores this option's capability to capitalize handsomely on the anticipated stock price increase, benefitting from both stock price movements and time decay (as indicated by its less negative theta).
Lastly, it's crucial to examine options with notably high vega, like the one with a strike price of $195, expiring on 2025-01-17. This option presents the highest vega (65.6673) across our selection, paired with a substantive ROI of approximately 0.5454. While its delta (0.7366) is lower than some other options mentioned, the high vega suggests that an increase in market volatility could dramatically increase the option's value, potentially outperforming others if the market conditions favor volatility spikes.
In sum, while each option presents unique benefits depending on market conditions and investment horizons, the call options expiring on 2024-04-19 at a $220 strike, on 2024-06-21 at a $150 strike, and on 2025-01-17 at a $165 and $195 strike, respectively, stand out as noteworthy opportunities. These options balance the Greeks in such a way that they could offer superior returns for investors targeting a 5% rise in APD's stock price, factoring in market movements, volatility, and time decay.
Similar Companies in Chemicals - Specialty:
Report: PPG Industries, Inc. (PPG), PPG Industries, Inc. (PPG), Report: The Sherwin-Williams Company (SHW), The Sherwin-Williams Company (SHW), Ecolab Inc. (ECL), Albemarle Corporation (ALB), Report: Linde plc (LIN), Linde plc (LIN), Report: RPM International Inc. (RPM), RPM International Inc. (RPM), Eastman Chemical Company (EMN), LyondellBasell Industries N.V. (LYB), International Flavors & Fragrances Inc. (IFF), Praxair, Inc. (PX), Air Liquide (AIQUY), The Chemours Company (CC), Dow Inc. (DOW), Honeywell International Inc. (HON)
https://www.fool.com/investing/2024/02/12/top-industrial-stock-sounding-alarm-china-2024/
https://www.fool.com/investing/2024/02/15/why-air-products-stock-is-inflating-today/
https://seekingalpha.com/article/4671346-bert-dividend-stock-purchase-summary
https://seekingalpha.com/article/4673840-my-best-dividend-aristocrats-for-march-2024
https://seekingalpha.com/article/4675456-my-top-10-high-yield-dividend-stocks-for-march-2024
https://seekingalpha.com/article/4675873-air-products-and-chemicals-betting-on-tomorrows-air-today
https://finance.yahoo.com/news/air-products-chemicals-apd-9-163014595.html
https://finance.yahoo.com/news/air-products-chairman-president-ceo-170000669.html
https://finance.yahoo.com/news/air-products-highlight-freshline-food-181500837.html
https://finance.yahoo.com/news/air-products-apd-showcase-freshline-103500529.html
https://finance.yahoo.com/news/air-products-chemicals-nyse-apd-121313755.html
https://finance.yahoo.com/news/green-rush-7-renewable-energy-210000009.html
https://seekingalpha.com/article/4678023-10-buyable-dividogs-from-barrons-top-100-sustainable-list
https://www.sec.gov/Archives/edgar/data/2969/000000296924000010/apd-20231231.htm
Copyright © 2024 Tiny Computers (email@tinycomputers.io)
Report ID: 4iOYlAA
Cost: $0.93529
https://reports.tinycomputers.io/APD/APD-2024-03-21.html Home