Chevron Corporation (ticker: CVX)
2024-01-31
 Chevron Corporation, with the stock ticker CVX, is a multinational energy company that ranks among the world's largest oil companies. Established in 1879 as the Pacific Coast Oil Company, it later became Standard Oil of California and ultimately Chevron. The company operates in all sectors of the oil and gas industry, including exploration, production, refining, marketing, and transportation. Chevron also engages in chemical manufacturing and sales through its subsidiary Chevron Phillips Chemical Company. In addition to its core oil and gas operations, the company has taken steps to invest in alternative energy sources and to focus on sustainable energy practices. With headquarters in San Ramon, California, Chevron's global footprint extends to over 180 countries, reflecting its position as a leader in the energy sector. The company's financial performance, strategic initiatives, and environmental policies are closely monitored by investors and industry analysts given the evolving landscape of energy production and consumption worldwide.
| Full Time Employees | 43,846 | Previous Close | $150.12 | Dividend Rate | $6.04 |
| Dividend Yield | 4.02% | Payout Ratio | 44.17% | Five Year Avg Dividend Yield | 4.41 |
| Beta | 1.113 | Trailing PE | 10.945 | Forward PE | 11.618 |
| Volume | 10,409,666 | Average Volume | 10,464,570 | Average Volume 10 Days | 9,390,250 |
| Market Cap | $278,310,977,536 | Fifty Two Week Low | $139.62 | Fifty Two Week High | $174.39 |
| Price to Sales Trailing 12 Months | 1.373 | Fifty Day Average | $146.4556 | Two Hundred Day Average | $156.10236 |
| Trailing Annual Dividend Rate | $5.95 | Enterprise Value | $298,992,828,416 | Profit Margins | 12.56% |
| Shares Outstanding | 1,882,050,048 | Shares Short | 43,751,695 | Held Percent Insiders | 0.028% |
| Held Percent Institutions | 71.396% | Short Ratio | 4.39 | Book Value | $87.546 |
| Price to Book | 1.684 | Earnings Quarterly Growth | -41.9% | Net Income to Common | $25,462,999,040 |
| Trailing EPS | $13.47 | Forward EPS | $12.69 | Total Cash | $5,937,999,872 |
| Total Debt | $20,558,999,552 | Total Revenue | $202,701,996,032 | Debt to Equity | 12.366 |
| Revenue Per Share | $107.562 | Return on Assets | 7.394% | Return on Equity | 15.678% |
| Free Cash Flow | $18,233,624,576 | Operating Cash Flow | $35,673,001,984 | Earnings Growth | -39.8% |
| Revenue Growth | -18.2% | Gross Margins | 39.765% | EBITDA Margins | 22.662% |
| Operating Margins | 12.877% | Current Price | $147.43 | Target High Price | $194.00 |
| Target Low Price | $148.00 | Target Mean Price | $176.17 | Target Median Price | $180.00 |
| Recommendation Mean | 2.0 | Number of Analyst Opinions | 23 | Total Cash Per Share | $3.146 |
| Sharpe Ratio | -0.6441591480408331 | Sortino Ratio | -9.771940244185336 |
| Treynor Ratio | -0.2578705785404382 | Calmar Ratio | -0.7028983099812671 |
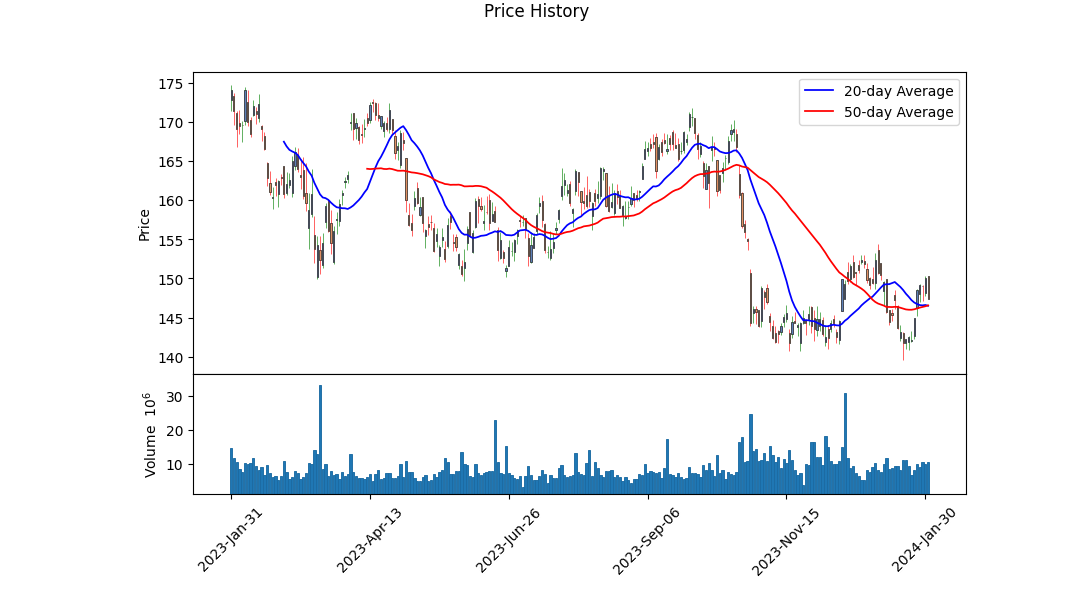
The recent technical analysis for Chevron Corp. (CVX) indicates a mixed sentiment in the market with bearish undertones. CVX has experienced a decrease in price, dropping from a high of $167.36 to $147.43 over the observed period. Volume trended negatively with OBV (On-Balance Volume) indicating a distribution phase as evidenced by the decreasing OBV from 0.616860 million to -13.385657 million.
Significant technical indicators such as the MACD (Moving Average Convergence Divergence) histogram, Parabolic SAR (Stop and Reverse), and volume suggest bearish momentum. The absence of MACD histogram values suggests a lack of trend strength, while the most recent negative indication on the indicator implies a bearish momentum. Additionally, the Parabolic SAR values transitioning from bearish to bullish signals were not enough to establish a trend reversal.
The companys fundamentals demonstrate robust financial health, with substantial growth in EBIT, net income, and a decrease in net debt over the last three years. Despite these solid fundamentals, the observed deterioration in the stock price could be attributable to market-wide factors or potentially lagging indicators not reflective of the company's sound financial position.
The negative risk-adjusted performance ratios (Sharpe, Sortino, Treynor, and Calmar) further dampen expectations for CVX's near-term performance. These ratios indicate that the stock has underperformed on a risk-adjusted basis over the past year. Analyst expectations show a consensus that earnings and revenues will dip in the coming quarters. The EPS revisions manifest a downward trend as well, signaling reduced confidence among analysts which could lead to a dampened investor sentiment.
Considering the balance of these technical and fundamental analyses, the expectation is for continued volatility and potential weakness in CVX's stock price over the next few months. A prudent approach for investors would be to monitor upcoming earnings reports, as well as macroeconomic factors that could impact the energy sector. This caution is backed by the overall market dynamics and recent analyst revisions that account for cross-sector and systemic issues that could be influencing the stock's performance negatively.
The financial health represented by the altmanZScore and piotroskiScore indicates that CVX is not facing immediate solvency or liquidity issues, suggesting that the negative price action may be more closely tied to market sentiment rather than intrinsic company problems. However, as with all stock market analyses, this is not a guarantee of future performance and should be viewed accordingly, alongside continuous monitoring of market conditions and company-specific news.
In our analysis of Chevron Corporation (CVX), we have meticulously calculated two key financial metrics that are essential when evaluating the company's performance and value proposition. The return on capital (ROC) stands at a robust 22.46%, which indicates that for every dollar Chevron invests in its capital, it generates approximately 22.46 cents of profit. This high ROC is indicative of effective management and efficient use of capital, thus reflecting a strong competitive advantage and a potentially sustainable business model in its sector.
Furthermore, the earnings yield for Chevron is at 12.86%, which is derived by inverting the price-to-earnings (P/E) ratio. This metric highlights the proportion of a company's per-share earnings relative to its share price, providing an assessment of value from an earnings perspective. An earnings yield of this level suggests that investors buying into Chevron at the current market price can expect a return of over 12% if the company's current earnings remain constant. This is quite attractive when compared to traditional fixed-income yields, making CVX a potentially appealing option for value investors seeking to capitalize on the earnings power of the company relative to its share price.
Based on the provided information, we can assess the key metrics and their alignment with Benjamin Graham's criteria for Chevron Corporation (CVX).
Margin of Safety: Not directly provided. Graham's concept of the margin of safety would require an estimation of the intrinsic value of CVX, which is not based solely on metrics. A comparison between the intrinsic value and the market price would be necessary to determine the margin of safety.
Diversification: As we are looking at a single company, this principle is not applicable. Investors must look beyond one stock to apply diversification.
Debt-to-Equity Ratio: CVX has a debt-to-equity ratio of 0.1216, which is quite low. This indicates that the company is not highly leveraged and aligns well with Graham's preference for companies with lower financial risk due to leverage.
Price-to-Earnings (P/E) Ratio: The P/E ratio is 18.32, which may not be considered low in a traditional sense, especially from Graham's conservative stand on valuations. However, this ratio must be compared to industry averages and historical values. The ratio by itself is in a higher range, and Graham would typically look for lower P/E ratios for a margin of safety.
Price-to-Book (P/B) Ratio: The P/B ratio for CVX is 1.0767, fairly close to 1. This could indicate that the stock is trading at just a slight premium above its book value, which might be attractive to Graham-minded investors, assuming other fundamentals are strong.
Dividend Record: The dividend history provided shows consistent and increasing dividend payments from CVX, with dividends growing over the years, from $0.55 in 1976 to $1.51 in 2023. This is a strong indicator of a stable and possibly shareholder-friendly company, aligning with Graham's preference for companies that have a long history of paying dividends.
Consistent Earnings Growth: While earnings growth is not directly listed, consistent dividend increases often suggest stable earnings growth. Therefore, CVX may comply with Grahams criteria in this regard.
Current and Quick Ratios: These ratios are not provided but are key to assessing a company's short-term financial health and liquidity.
Defensive and Enterprising Investor Strategies: CVX's low debt and consistent dividend history could make it suitable for defensive investors if the P/E ratio was found to be reasonable based on wider market comparisons.
Based on these metrics alone, CVX seems to exhibit some attributes of a company that may align with Graham's principles, such as a strong dividend history and low debt-to-equity ratio. However, a full assessment would also require a look into the stability and consistency of earnings, comparisons with industry P/E averages, a comprehensive review of financial statements, and an evaluation of the company's management and competitive position to arrive at a judgment that aligns closely with Graham's detailed approach to stock selection. Furthermore, the innate volatility in oil and gas prices could affect the market price of CVX and introduce elements of risk that Graham's more conservative strategies aim to mitigate.
| Statistic Name | Statistic Value |
| Alpha (const) | -0.0030 |
| Beta (0) | 1.0291 |
| R-squared | 0.368 |
| Adj. R-squared | 0.367 |
| F-statistic | 730.5 |
| Prob (F-statistic) | 3.62e-127 |
| No. Observations | 1,257 |
| AIC | 5,015 |
| BIC | 5,025 |
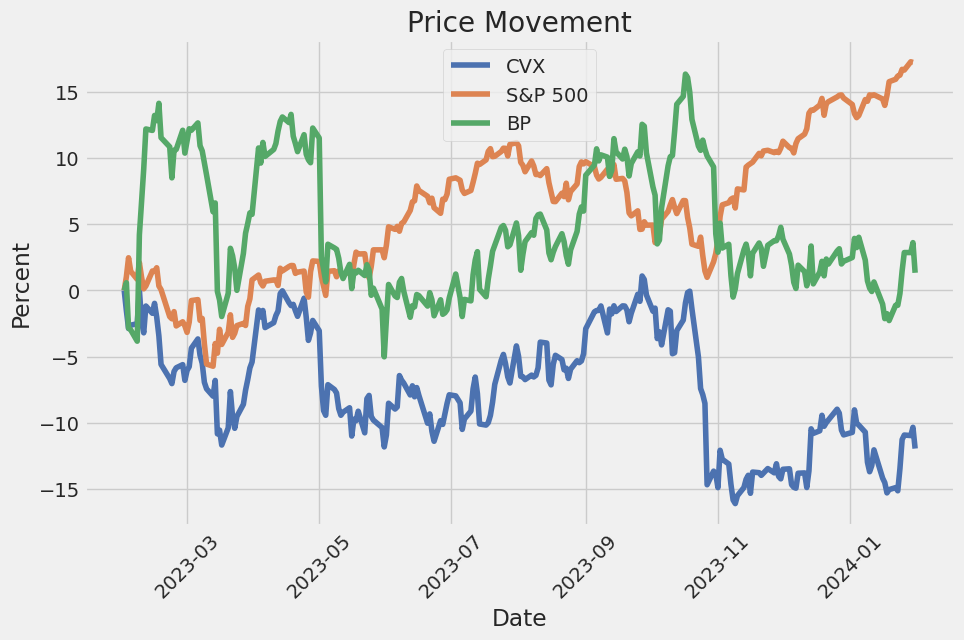
The linear regression model analyzing the relationship between Chevron Corporation (CVX) and the SPDR S&P 500 ETF Trust (SPY) indicates a beta coefficient (slope) of 1.0291, signifying that for every 1% movement in the SPY, CVX is expected to move approximately 1.0291% in the same direction. This suggests that CVX's stock price has a strong positive correlation with the movements of the S&P 500 index. The model has an R-squared value of 0.368, which means that around 36.8% of the variability in CVX's returns can be explained by the variability in the market's returns, as represented by SPY. The adjusted R-squared shows a similar level of explanatory power after adjusting for the number of variables in the model.
Focusing on alpha, the model presents an alpha value of -0.0030, which means that CVX underperforms the market's expected return, assuming the CAPM linear relationship is correct. However, the statistical significance of this alpha is very low, indicated by a P-value of 0.952. This high P-value implies that the negative alpha is not statistically different from zero, suggesting that there is no strong evidence of abnormal performance after controlling for the market's performance. This alignment is consistent with the hypothesis that markets are efficient and that stock returns are mostly driven by systematic risk as captured by the market indexhere, SPY.
Summary of Chevron Corporation's Third Quarter 2023 Earnings Call
In the latest earnings call, Chevron Chairman and CEO, Mike Wirth, and CFO, Pierre Breber, discussed the companys continued focus on delivering high returns and advancing their lower carbon business initiatives. Mike Wirth opened the call with remarks expressing sympathy for the tragic events in the Middle East, highlighting Chevron's values emphasizing employee safety and the secure delivery of natural gas. Wirth also announced the acquisition of Hess Corporation, expected to close in the first half of 2024, and the closure of the PDC Energy acquisition. Another notable announcement involved the companys investment in a green hydrogen production and storage hub in Utah, consistent with their climate-change goals outlined in the newly released Climate Change Resilience Report.
Wirth reported multiple developments at TCO (Tengizchevroil), including the completion of the Future Growth Project and the Wellhead Pressure Management Project. However, he noted that production in 2024 is forecasted to be lower due to an intense turnaround schedule and explained that free cash flow from TCO in 2025 is expected to reduce by approximately $1 billion from previous estimates.
Pierre Breber highlighted Chevrons strong financial performance, pointing out special items like a significant one-time tax benefit and pension settlement costs. Despite some constraints, Chevron has managed to maintain a solid balance sheet with a net debt ratio in the single digits. The repurchase of more than $3 billion in Chevron shares was stressed as evidence of a continued commitment to return value to shareholders.
As the call progressed, Wirth and Breber answered various questions, discussing details of production dynamics, especially within the Permian Basin and international ventures. Although Permian production saw a slight decline, largely due to non-operated joint ventures and other surface constraints, the expectations for the fourth quarter remain consistent with prior guidance. Additionally, details were provided on the implications of the new OFAC general license for operations in Venezuela and the modest cash flow impact from the current cessation of operations at Tamar due to the situation in the Middle East.
The question and answer segment also explored future project execution strategies, the integration of PDC operations and the synergy benefits expected from the Hess acquisition. The management echoed confidence in their investment choices and the strategic direction of the company, invariably aiming to deliver shareholder value.
Concluding the call, Wirth and Breber emphasized the solidity of the companys operational performance and its robust financial strategy, affirming that, despite short-term challenges like the revised TCO schedule, they are well positioned to deliver consistent value in a range of market conditions.
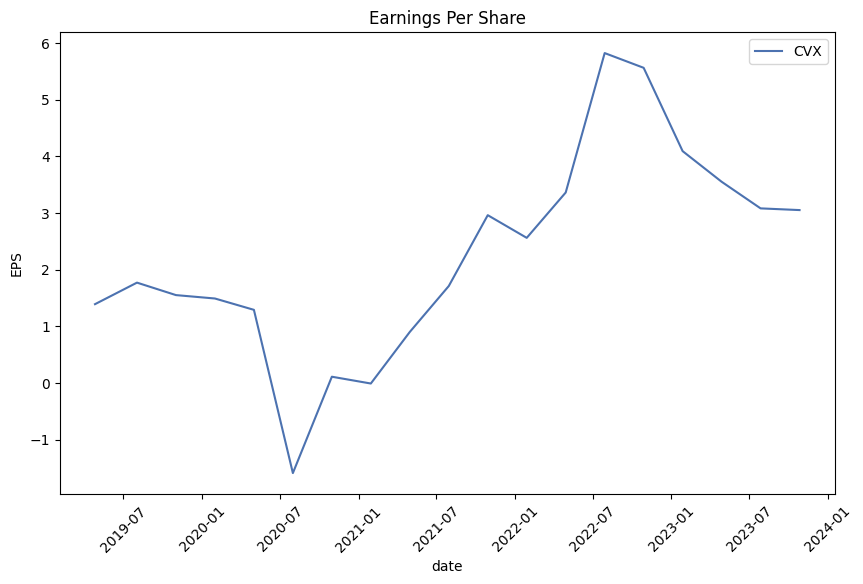
As of September 30, 2023, Chevron Corporation (Chevron), a global energy company, reported third-quarter 2023 earnings of $6.5 billion ($3.48 per share diluted), compared with the same quarter in 2022, which had earnings of $11.2 billion ($5.78 per share diluted). For the first nine months of 2023, the companys earnings were $19.1 billion ($10.14 per share diluted), a decline compared to the $29.1 billion ($14.95 per share diluted) in the first nine months of 2022.
The Upstream segment, which includes exploration, development, and production of crude oil and natural gas, experienced a decrease in earnings, from $9.3 billion in Q3 2022 to $5.8 billion in Q3 2023. The year-to-date earnings also fell from $24.8 billion in the first nine months of 2022 to $15.9 billion in the same period of 2023. The primary reason for this decline was shown to be lower crude oil and natural gas realizations. A significant one-time tax benefit occurred in Nigeria, which partially offset the impact.
In the United States, Upstream earnings decreased by $1.3 billion quarter-over-quarter and by $4.5 billion year-to-date, primarily due to reduced realizations. Chevron's U.S. net oil-equivalent production increased by 231,000 barrels per day in Q3 2023 compared to Q3 2022, attributed mainly to the acquisition of PDC Energy, Inc. and growth in the Permian Basin.
Globally, the International Upstream earnings saw a decrease of $2.2 billion quarter-over-quarter and $4.4 billion year-to-date primarily due to lower realizations and sales volumes, with a notable one-time tax benefit in Nigeria. Foreign currency effects were adverse year-to-date but favorable for Q3.
The Downstream segment's earnings are closely tied to refining and marketing margins. Earnings in this segment decreased to $1.7 billion in Q3 2023, compared to $2.5 billion in Q3 2022. Year-to-date earnings decreased from $6.4 billion in the first nine months of 2022 to $5.0 billion in the same period of 2023. The reasons cited for the decrease included higher operating expenses, lower favorable foreign currency effects, lower margins on refined product sales, and less earnings from CPChem.
The report highlights that earnings and profitability across Chevrons business segments are largely influenced by global energy market prices, which Chevron does not control. Factors such as geopolitical developments, regulatory changes, and technological progress can significantly impact these market prices. Furthermore, crude oil price fluctuations and natural gas prices derived from benchmarks like Brent and WTI influenced Chevron's revenue, as did the volume of oil-equivalent production.
Chevron's capital expenditures were $11.468 billion for the first nine months of 2023. The company discussed noteworthy developments, such as advancements in renewable energy projects and asset acquisitions in the United States, signifying Chevron's strategic moves towards energy transition and efficiency improvements.
Finally, the report also emphasizes Chevrons responses to policy changes and technology advancements concerning climate change. The company focuses on lower-carbon energy development and intends to balance growth in its conventional oil and gas business with lower-carbon initiatives. Chevron maintains flexibility in its portfolio to adapt to market and regulatory changes that may influence its business environment and outlook based on the energy transitions pace and extent.
Chevron Corporation has solidified its position as an energy powerhouse, with a track record of 36 consecutive years of dividend increases, attesting to its financial stability and reward to shareholders. This diversified energy conglomerate operates across the entire value chain and leverages its broad operational scope to cushion the blow of industry volatility. Its conservative debt management, marked by a debt-to-equity ratio of just 0.12 times, underscores Chevron's financial prudence. Currently offering a dividend yield of about 4%, Chevron appeals to income-focused investors who seek stability and consistent returns.
However, according to Bill Sarubbi's January 1, 2024, Forbes article, Chevron was tagged as a less favorable stock for the month on account of its weak monthly performance and relative strength, categorizing it as a candidate for a profitable short sell for the month. The Forbes' analysis follows a cyclical/relative strength trading strategy applied to Dow 30 stocks, with historical data suggesting a traditional strong performance for long positions, outperforming the Dow Jones Industrial Average, and underperformance for the bottom-rated stocks, often resulting in negative returns.
In the midst of potential short-term valuation concerns highlighted by Forbes, Chevron revealed its impending financial adjustments on January 2, per Proactive Investors. It forewarned a non-cash, after-tax impairment charge of up to $4 billion reflecting write-downs due to regulatory headwinds in California and decommissioning obligations stemming from bankrupt entities in the Gulf of Mexico.
The Motley Fools Justin Pope, in an analysis published on December 19, 2023, evaluated Chevron's multi-faceted investment profile. Fluctuating oil prices and Chevron's pending $53 billion acquisition of Hess Corporation pose challenges overlaid by geopolitical strain between Venezuela and Guyana. Despite these concerns, Chevrons financial foundations appear resilient, strong enough to support operations and shareholder dividends at an average oil price of $50 per barrel, indicating a capability to wither market turbulence.
Deepening its commitment to shareholder value, Chevron has tactically scaled up its dividend payouts, authorized extensive stock repurchase programs, and pursued acquisitions aimed at future earnings and growth. Notably, Chevron is expanding its renewable portfolio with the acquisition of the Renewable Energy Group, making it the second-largest producer of renewable fuels in the U.S. This focus on diversification and solid financial execution was further explored by Courtney Carlsen in "Beat the Dow Jones With This Cash-Gushing Dividend Stock," published December 29, 2023, which hailed Chevrons audacity in rewarding investors even while facing industry headwinds.
Looking forward to 2024, according to The Motley Fool article by Matthew DiLallo, Neha Chamaria, and Reuben Gregg Brewer, dated December 23, 2023, Chevrons robust financial projections and strategic growth via the upcoming Hess acquisition render its stock appealing for dividend advancement, foreseeing an 8% increase in dividend payments.
Benzinga's article by Avi Kapoor from December 22, 2023, highlighted Chevron as a feasible option for generating monthly dividend income, demonstrating that investment in a substantial number of shares can reap a consistent return despite the concerns surrounding crude oil prices and acquisition pressures involving Hess Corporation.
Chevron undertook sizable M&A activity in 2023, including the acquisition of PDC Energy, which concluded in cost synergies and improved free cash flow, as detailed in Matthew DiLallo's December 31, 2023, article "3 Beaten-Down Dow Jones Stocks That Dividend Investors Should Scoop Up in 2024". The company's stock dipped roughly 15% in 2023, much due to fluctuating oil prices, yet Chevron continued to underline its commitment to dividends, projecting an 8% increase for 2024.
Amidst these financial maneuvers, Chevron maintains its focus on achieving production efficiencies and pursuing opportunities that align with global energy market trends. An interview featured on CNBC Television highlighted the company's strategic approach to managing current assets and navigating changing regulations, especially the shift in focus from California investments to more lucrative international operations, such as the partnership in Guyana.
Finally, Chevron's resilience despite a 15.9% decline in 2023, is seen by many analysts as setting the stage for potential recovery in 2024, a narrative emphasized in Daniel Foelber's December 28, 2023, article on The Motley Fool. The acquisition of Hess is seen as a strategic complement to Chevron's free cash flow and profit profiles, and its ability to withstand the pressures of the volatile energy market positions it as an enticing option within the Dow Jones index for the coming year.
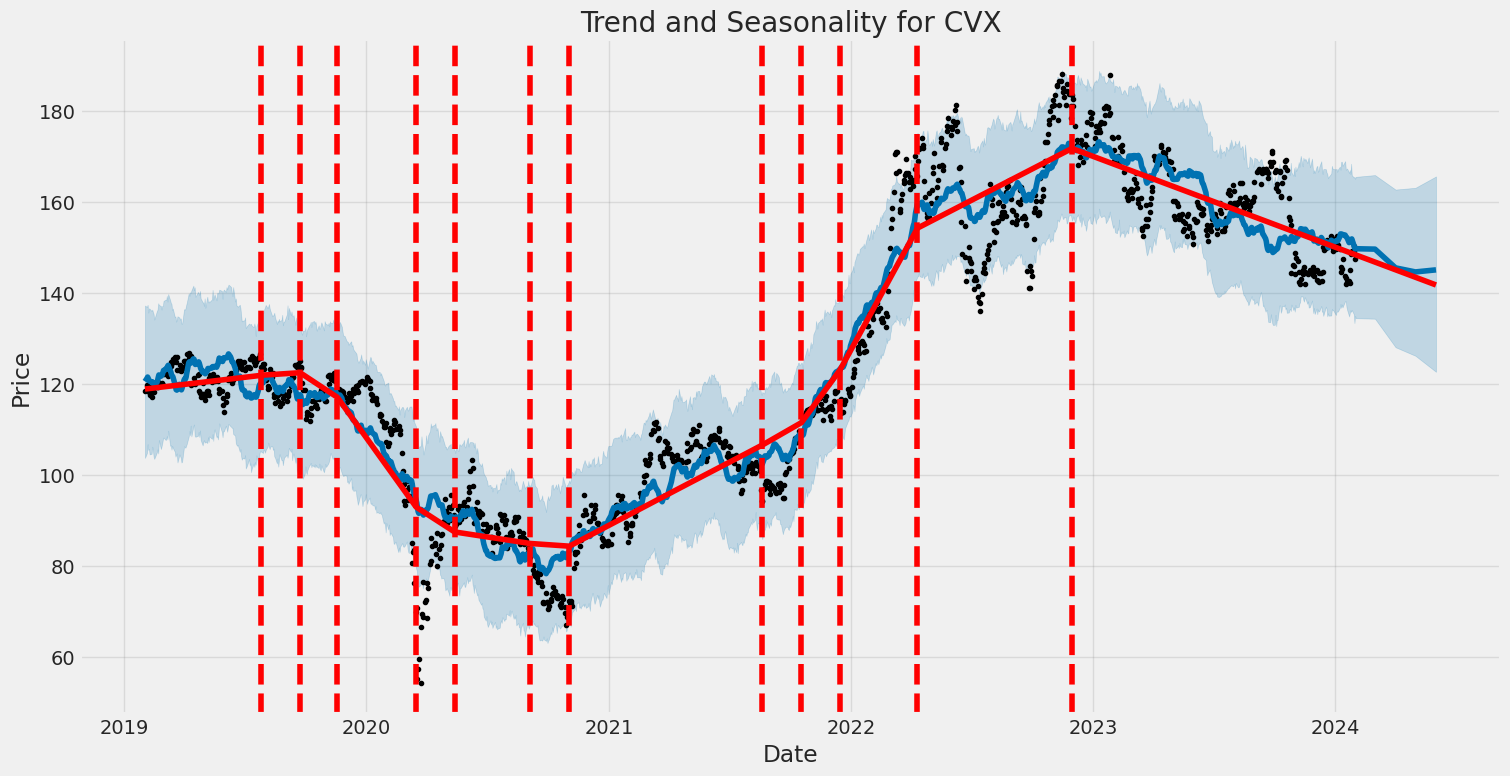
Chevron Corporation's volatility from February 2019 to January 2024 can be summarized as follows: The ARCH model used to analyze the stock's volatility suggests that there is no predictable pattern in the stock's returns as indicated by an R-squared value of 0.000. The volatility of Chevron's stock, as modeled by the ARCH process, is significantly impacted by past volatility, shown by an omega coefficient of 3.1066, indicating a baseline level of variation. Additionally, the stock's volatility presents a strong persistence over time, with an alpha[1] coefficient of 0.4124, which means that past volatility has a notable influence on current volatility.
Here is the HTML table summarizing the volatility of Chevron Corporation:
| Statistic Name | Statistic Value |
|---|---|
| R-squared | 0.000 |
| Log-Likelihood | -2,681.99 |
| AIC | 5,367.98 |
| BIC | 5,378.26 |
| No. Observations | 1,257 |
| omega | 3.1066 |
| alpha[1] | 0.4124 |
When assessing the financial risk of a $10,000 investment in Chevron Corporation (CVX) over one year, the combination of volatility modeling and machine learning predictions offers a dual approach to understanding potential market behavior and its implications on stock performance.
The volatility modeling technique is an invaluable tool for capturing the dynamic nature of Chevron's stock volatility. This model quantitively analyzes historical price data to systematically understand the changing variance in returns, which helps to forecast the future volatility of stock prices over the investment horizon. Through this statistical measure, investors gain insights into the level of risk associated with the stock based on historically observed patterns, enabling an informed assumption about future price fluctuations.
On the other hand, machine learning predictions involve deploying sophisticated algorithms to process large datasets and recognize patterns that might elude traditional statistical methods. Within this context, a machine learning model such as the ensemble learning approach is used to predict Chevron's future stock returns. By evaluating past performance alongside a myriad of market indicators, this model generates predictive insights, identifying potential trends and offering probabilistic forecasts of stock price movements.
Together, these methods present a multifaceted view of the investment landscape. While the volatility modeling anchors its predictions in the historical volatility of Chevron's stock, the machine learning predictions consider a broader set of variables and historical patterns to gauge potential future stock performance.
Applying the calculated Value at Risk (VaR) at a 95% confidence interval specifically to a $10,000 investment in Chevron provides a dollar figure of the potential downside risk. The VaR of $235.86 means that there is a 95% likelihood that the investment will not lose more than this amount over the one-year period. This suggests that under normal market conditions, the investor can be reasonably confident that the risk of a loss greater than $235.86 is relatively low, which is a critical piece of information for risk management and decision-making processes. However, it is essential to remember that the VaR does not predict losses beyond the 95% confidence level, nor does it account for extreme market events, sometimes referred to as "black swan" events, which could cause more substantial losses.
Similar Companies in Oil & Gas Integrated:
BP p.l.c. (BP), Shell plc (SHEL), Petroleo Brasileiro S.A. - Petrobras (PBR), Suncor Energy Inc. (SU), TotalEnergies SE (TTE), Exxon Mobil Corporation (XOM), Equinor ASA (EQNR), Cenovus Energy Inc. (CVE), Imperial Oil Limited (IMO), Petroleo Brasileiro S.A. - Petrobras (PBR-A), Ecopetrol S.A. (EC), YPF Sociedad Anonima (YPF), ConocoPhillips (COP), Occidental Petroleum Corporation (OXY), Report: Marathon Petroleum Corporation (MPC), Marathon Petroleum Corporation (MPC), Report: EOG Resources, Inc. (EOG), EOG Resources, Inc. (EOG), Phillips 66 (PSX), Valero Energy Corporation (VLO), Pioneer Natural Resources Company (PXD), Hess Corporation (HES), Report: Marathon Oil Corporation (MRO), Marathon Oil Corporation (MRO), Devon Energy Corporation (DVN), Report: Apache Corporation (APA), Apache Corporation (APA), Noble Energy, Inc. (NBL)
https://www.fool.com/investing/2023/12/19/is-chevron-stock-a-buy/
https://seekingalpha.com/article/4659150-29-undervalued-dividend-aristocrats-december-2023
https://www.fool.com/investing/2023/12/23/3-income-stocks-to-help-you-ring-in-the-new-year-w/
https://seekingalpha.com/article/4659788-buffett-4-dividend-buys-for-december
https://www.fool.com/investing/2023/12/28/down-big-2023-dow-jones-stock-could-recover-2024/
https://www.fool.com/investing/2023/12/29/beat-the-dow-jones-with-this-cash-gushing-dividend/
https://www.fool.com/investing/2023/12/31/3-beaten-down-dow-jones-stocks-dividend-investors/
https://www.forbes.com/sites/greatspeculations/2024/01/01/dow-stocks-to-trade-in-january/
https://www.proactiveinvestors.com/companies/news/1037287?SNAPI
https://www.fool.com/investing/2024/01/04/3-top-energy-stocks-to-buy-in-january/
https://seekingalpha.com/article/4661160-january-dogs-of-the-dow-2-buyable-6-watchable
https://www.youtube.com/watch?v=ZsHzi3ARdW0
https://www.sec.gov/Archives/edgar/data/93410/000009341023000088/cvx-20230930.htm
Copyright © 2024 Tiny Computers (email@tinycomputers.io)
Report ID: BXj9ov
Cost: $0.90194
https://reports.tinycomputers.io/CVX/CVX-2024-01-31.html Home