DuPont de Nemours, Inc. (ticker: DD)
2024-01-17
 DuPont de Nemours, Inc., commonly known as DuPont, is an American company that operates globally in a diverse array of industries, with a focus on technology-based materials, ingredients, and solutions. Tracing its origins back to 1802, DuPont has evolved through numerous transformations, most recently undergoing a complex merger and subsequent split with Dow Chemical that was completed in 2019. Listed on the New York Stock Exchange under the ticker symbol DD, DuPont's portfolio includes a variety of market segments such as electronics, transportation, construction, water solutions, and worker safety. The company is dedicated to innovation, investing substantially in research and development to address global challenges. This includes creating sustainable and high-performance materials that are integral to modern life. As of the knowledge cutoff date, DuPont remains a key player in various industries, committed to leveraging science and engineering to solve some of the world's most pressing problems.
| Full Time Employees | 23,000 | Previous Close | 73.72 | Open | 72.84 |
| Day Low | 72.72 | Day High | 73.4751 | Dividend Rate | 1.44 |
| Dividend Yield | 0.0197 | Payout Ratio | 0.7157 | Five Year Avg Dividend Yield | 2.36 |
| Beta | 1.178 | Trailing PE | 37.096447 | Forward PE | 18.501266 |
| Volume | 3,299,301 | Average Volume | 2,982,562 | Average Volume 10 days | 2,668,090 |
| Market Cap | 31,427,469,312 | Fifty Two Week Low | 62.8 | Fifty Two Week High | 78.74 |
| Price to Sales Trailing 12 Months | 2.5604913 | Fifty Day Average | 72.7234 | Two Hundred Day Average | 72.173 |
| Trailing Annual Dividend Rate | 1.41 | Trailing Annual Dividend Yield | 0.019126423 | Enterprise Value | 39,342,505,984 |
| Profit Margins | 0.38056 | Float Shares | 429,156,604 | Shares Outstanding | 430,041,984 |
| Shares Short | 5,801,773 | Held Percent Insiders | 0.00177 | Held Percent Institutions | 0.77480006 |
| Book Value | 56.259 | Price to Book | 1.2989923 | Last Fiscal Year End | 1672444800 |
| Most Recent Quarter | 1696032000 | Earnings Quarterly Growth | -0.131 | Net Income to Common | 895,000,000 |
| Trailing Eps | 1.97 | Forward Eps | 3.95 | Peg Ratio | 2.09 |
| Total Cash | 1,338,000,000 | Total Cash Per Share | 3.111 | Ebitda | 2,897,999,872 |
| Total Debt | 8,817,999,872 | Quick Ratio | 1.008 | Current Ratio | 2.152 |
| Total Revenue | 12,273,999,872 | Debt to Equity | 35.806 | Revenue Per Share | 26.586 |
| Return on Assets | 0.026600001 | Return on Equity | 0.03742 | Free Cashflow | 4,016,250,112 |
| Operating Cashflow | 1,243,000,064 | Earnings Growth | -0.039 | Revenue Growth | -0.078 |
| Gross Margins | 0.34699002 | Ebitda Margins | 0.23611 | Operating Margins | 0.14977 |
 Based on the provided technical analysis, fundamental data, and balance sheet information, here is the assessment for the possible stock price movement over the next few months:
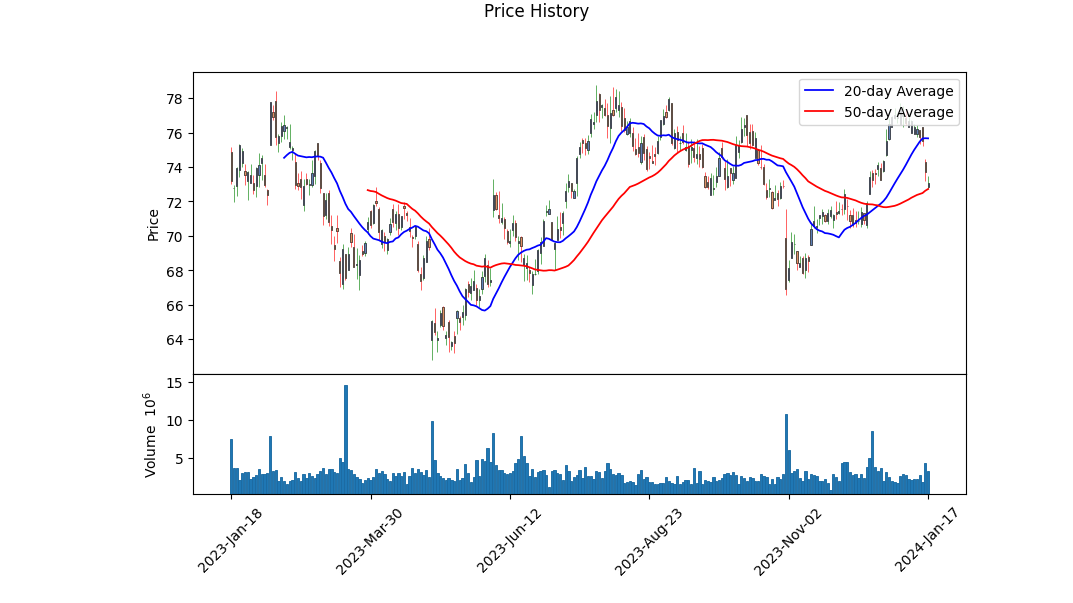
Technical Analysis: - The stock has shown significant volatility over the recent period, with a recent decline in the closing price from a high on 2024-01-10. - The On-Balance Volume (OBV) shows a decrease, signifying that volume on down days is outweighing volume on up days, indicating bearish sentiment. - Moving Average Convergence Divergence (MACD) histogram has progressively been getting more negative, underscoring increasing bearish momentum. - The Parabolic SAR (PSAR) is currently indicating a downtrend as the PSAR point is above the price.
Fundamentals: - Gross margins and EBITDA margins are relatively healthy, suggesting the company is maintaining profitability. - The balance sheet reveals increasing net debt over the past years, which is a concern and could affect future profitability due to increased interest expenses. - The company has had fluctuations in Net Income over the recent past which should be considered in understanding its financial stability. - The earnings estimate for the next quarter shows a slight dip compared to the previous period, which may influence market sentiment in the short term.
Balance Sheet: - The company's tangible book value has increased over the past year which generally indicates an underlying asset value that can support the stock price. - A high level of total debt is observed although net debt has decreased, suggesting some deleveraging which could be a positive sign as it might reduce financial risks.
Cash Flows: - Negative free cash flow indicates that the company is potentially consuming more cash than it generates, which may not be sustainable in the long term. - The repayment of debt and repurchase of capital stock suggest that the company is returning value to shareholders and attempting to improve its capital structure.
Analyst Expectations: - While there's a decrease expected in the next quarter's earnings, the following year is projected to have an increase in both revenue and earnings. - The historical earnings surprises have been predominantly positive, which could suggest that the company has a history of outperforming analyst expectations.
The confluence of these multiple factors suggests a mixed outlook in the coming months. On one hand, decreasing OBV and negative MACD histogram point to possible further price declines. The upcoming earnings expectations are lower, potentially placing downward pressure on the stock price. However, the reduction in net debt and past positive earnings surprises counterbalance some of these negative indicators.
Investors should consider the mentioned factors alongside market conditions and competitor performance. A cautiously optimistic approach would be advisable, with additional weightage on upcoming earnings to assess whether the company continues its trend of surpassing expectations.
Should the company report strong earnings and provide a positive outlook, this could act as a catalyst for the stock price. On the contrary, weaker earnings could confirm the current bearish technical signals. Investors are encouraged to monitor these key indicators alongside broader market trends to make informed decisions.
| Alpha | -0.0443 |
| Beta | 1.1307 |
| R-squared | 0.446 |
| Adj. R-squared | 0.446 |
| F-statistic | 1,009 |
| Prob (F-statistic) | 6.10e-163 |
| Log-Likelihood | -2,416.4 |
| AIC | 4,837 |
| BIC | 4,847 |
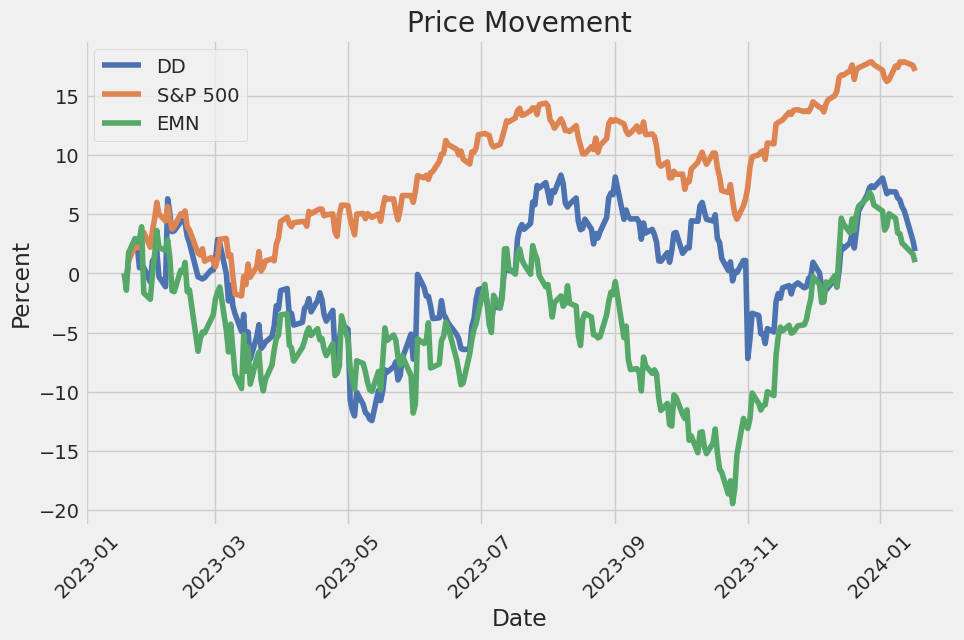
In the linear regression model analyzing the relationship between DuPont de Nemours, Inc. (DD) and the SPDR S&P 500 ETF Trust (SPY), the coefficient of determination (R-squared) is 0.446. This value indicates that approximately 44.6% of the variability in DD's returns can be explained by the variability in SPY's returns. The independent variable SPY's returns are statistically significant in predicting DD's returns as indicated by the F-statistic and its associated p-value (Prob(F-statistic) is very low, practically zero). The model's alpha, which represents the expected return on DD when SPY's return is zero, is -0.0443. However, this alpha is not statistically significant given the p-value of 0.345 associated with the constant term, implying the alpha may not differ from zero.
Moving on to beta, the estimated beta value is 1.1307, suggesting that for every one percent change in the market (SPY), the return on DD is expected to change by approximately 1.1307 percent in the same direction. This indicates a positive relationship between DD and the overall market, with DD having a tendency to move more than the market. The assessment period ends today, with the analysis reflecting the historical relationship as of the date and time specified. It's worth noting that the remaining statistics such as the log-likelihood, AIC, BIC, skewness, and kurtosis values are useful for the in-depth understanding of the model's fit and the distribution of residuals. However, since alpha is the focus here, it is understood that despite its negativity, its lack of statistical significance suggests it is not reliable as a measure to predict DD's performance independently of the market.
DuPont de Nemours, Inc. showcases a solid third quarter in 2023, delivering growth in earnings amid challenging circumstances such as volume headwinds, including channel inventory destocking and weak demand in China. Ed Breen, CEO, and Lori Koch, CFO, lead the earnings call, discussing the company's sequential operating EBITDA growth of 5% and a margin improvement of 140 basis points. They highlight strong cash flow generation, with adjusted free cash flow almost 50% higher than the previous year. DuPont's organic revenue, however, declined 10% due to channel inventory destocking and lower volumes from key sectors like semiconductor and construction.
In their Electronics portfolio, DuPont's Interconnect Solutions business experienced an 8% sales increase, signifying demand improvement and normal seasonality. They anticipate gradual semi-sequential sales improvement for the fourth quarter. The volume was below expectations, primarily due to additional channel inventory destocking, noticeable in Water Solutions and Safety Solutions. The company plans to mitigate these challenges by controlling discretionary spending and implementing further restructuring actions aimed at achieving at least $150 million in annualized run rate cost savings expected to manifest in early 2024.
On the strategic front, DuPont's third quarter was marked by significant development, such as the completion of the Spectrum acquisition and the sale of an 80% ownership interest in the Delrin business to TJC, valued at $1.8 billion. This deal included up-front cash proceeds and potential future returns, complementing DuPont's strategic priorities. The company made substantial progress in share repurchases, with an ongoing $2 billion ASR anticipated to be completed in the first quarter of 2024.
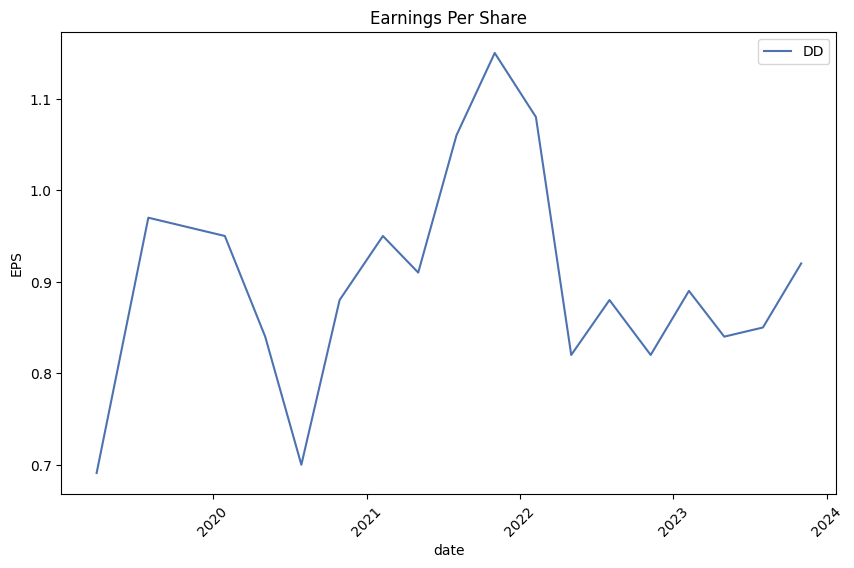
Lori Koch details the financial metrics for the third quarter, underscoring the teams' successful execution despite softer volumes due to broad-based inventory destocking. She points out the sequential margin improvements across segments and the strong cash performance in this period. Organic sales have decreased across regions. The operational EBITDA was $775 million, a 9% decrease from the previous year, but cost control measures helped cushion the impact. Adjusted EPS for the quarter was $0.92 a share, up by 12% thanks to a lower share count and net interest expense, among other factors. For the full year 2023, DuPont now expects net sales of about $12.17 billion, operating EBITDA of approximately $2.97 billion, and adjusted EPS to be about $3.45 per share.
The call concludes with a Q&A session where DuPont executives address numerous concerns and provide more insight into the company's performance and expectations. They reiterate the strategy for managing inventory levels, dealing with the current state of the market, and the prospects for recovery in key end markets going into 2024.
DuPont de Nemours, Inc. (registered as Corteva, Inc.) filed its SEC 10-Q report for the quarterly period ended September 30, 2023, reflecting varied financial activities and performance. The filing outlines the financial state of the company, highlighting key aspects such as net sales, operating expenses, earnings, and strategic business operations, including acquisitions and restructuring initiatives.
In terms of financial results for the quarter, DuPont reported net sales of $2.59 billion, which was a slight decrease from $2.777 billion for the same period in the previous year. The cost of goods sold was $1.646 billion, and the company incurred $335 million on research and development expenses, which slightly exceeded the previous year's amount. Selling, general, and administrative expenses for the quarter amounted to $670 million, with an additional $174 million in amortization of intangibles. There were also restructuring charges and a net other income expense.
For the nine months ending on September 30, 2023, the company's accumulated net income amounted to $998 million. The filing detailed the comprehensive income and expenses, including effects from foreign currency translations and derivative instruments. The document indicated the presence of performance obligations and described the breakdown of net sales by major product lines such as corn, soybean, other oilseeds, herbicides, insecticides, and fungicides.
One significant highlight of the report is the companys strategic acquisitions, which included Stoller Group, Inc. and Symborg in March 2023. The Stoller acquisition cost was $1.22 billion, including a working capital adjustment, and the Symborg acquisition was valued at $370 million. The financial impact of these acquisitions on the company's consolidated statements was not deemed material for the reported period.
The filing also indicated proceeds from sales of property and businesses, which the company engages in through its routine operational activities. Additionally, the report addressed tax provisions, revealing a mix of benefits and liabilities attributed to various factors, including changed valuations of assets and contingencies related to tax positions.
DuPont also outlined its financing activities for the quarter, which included significant transactions such as net changes in borrowings totaling $3.603 billion. Losses on sales of receivables and elements of interest income and expense were reported as part of the financial operations.
The report did not sidestep segment operations, mentioning the Seed and Crop Protection segments and addressing goodwill and intangible assets within these operational divisions. Finally, DuPont mentioned the impact of foreign currency exchange programs on its financial outcomes, with notable pre-tax losses associated with the devaluation of the Argentine Peso.
Overall, the financial picture painted in the SEC 10-Q filing provides a detailed look at DuPont de Nemours, Inc.'s financial performance, acquisitions, operational restructuring, asset management, and tax obligations for the third quarter of 2023.
DuPont de Nemours, Inc. (Ticker: DD), recognized as DuPont, has been undergoing a transformation, shaped by strategic decisions that resonate with both its historical commitment to innovation and a contemporary focus on value creation. Despite the vagaries of market environments and the complexities inherent in the materials science industry, DuPont has demonstrated resilience through a confluence of productivity initiatives, tactical mergers, and research endeavors aimed at catalyzing growth and profitability.
One of the cardinal maneuvers fortifying the company's expansion trajectory has been the acquisition of Spectrum Plastics Group, completed in August 2023. This tactical advancement has integrated Spectrum's specialized medical devices manufacturing competencies within DuPont's Electronics & Industrial segment. This $1.75 billion dollar investment is a clear indicator of DuPont's resolve to cement its stature in the healthcare sector, an arena projected to burgeon amidst technological advancements and an aging global population.
The acquisition is poised to act as a growth vector, considering Spectrum's $500 million in annual sales, contributing substantially to DuPont's revenue streams. The strategic purchase aligns with DuPont's legacy of integrating science with market foresight to yield innovations that address global challenges and generate economic returns. Furthermore, DuPont has sustained momentum in leveraging strategic pricing actions to buffer against the headwinds of cost inflation, demonstrating fiscal acumen in safeguarding profit margins.
Notwithstanding its strategic strides, the company has been contending with softening demand in certain business segments. The water solutions division, a critical component of the Water & Protection segment, has particularly felt the brunt of a decelerating Chinese industrial economy, leading to subdued sales and tightening performance parameters. Additionally, weaker consumer electronics volumes have precipitated a contraction in organic sales for the Interconnect Solutions.
However, in the face of such industry-specific challenges, DuPont shares have displayed a relative resilience, registering a 1.3% gain over the previous year, outpacing the industry's 14.5% pullback. This comparative performance, encapsulated within a Zacks Rank #3 (Hold), articulates a reserved yet cautiously optimistic investment narrative for DuPont at present.
In parallel, DuPont has unfurled new product developments, notably the introduction of novel Tedlar PVF solutions and PVF coatings. These innovations, underscored by their showcasing at the Taipei Building Show, reflect DuPont's commitment to pushing the frontiers of its market offerings. The collaboration with Coryor Surface Treatment Company Ltd. and Nippon Paint Taiwan to launch these products underscores DuPont's knowledgeable partnerships and strategic collaborations aimed at leveraging synergies and crafting superior value propositions for customers.
Another strategic lever being pulled by DuPont is restructuring, aimed at reducing operational costs and enhancing productivityan initiative intended to ripple into tangible savings from Q1 2024. These efforts speak to DuPont's agility in sculpting its operational architecture to accommodate market fluidity and preserve competitive advantage.
Amidst an inhospitable market where headwind strengths are not to be underestimated, the strategic options available within the basic materials sector come into sharp focus. Key players, such as Denison Mines Corp. (DNN), Axalta Coating Systems Ltd. (AXTA), and The Andersons, Inc. (ANDE), have been highlighted by Zacks Equity Research as potential alternatives for investors, with promising growth prospects and more favorable Zacks Ranks of #1 (Strong Buy) or #2 (Buy).
Investors, recognizing the shifting gears of the materials science industry, may also find allure in DuPont's recent standing as a blue-chip constituent, as elucidated by InvestorPlace. The chemical specialties sector, comparatively underemphasized in the spectrum of market sectors, poses a unique value proposition for contrarian investors, teased out by the company's trailing-year earnings multiple of 7.93X.
Similarly, the investor community is becoming increasingly sensitized to DuPont's strides within the sustainability domain. The introduction of Low-GWP Styrofoam Brand XPS insulation in North America delineates DuPont's alignment with ecological imperatives and its efforts in contributing to sustainable building practices. Moreover, DuPont's engagement in environmental damage control and community welfare, transpired through its agreement with the State of Ohio, embellishes its corporate social responsibility profile.
Conversely, as an investment screening tool, the DuPont analysis facilitates a granulated evaluation of a company's financial health, dissecting Return on Equity (ROE) into determinants of operational efficiency, asset utilization, and financial leverage. Our examination of DuPonts metrics through this lens could yield additional insights into the company's operational dynamics and market positioning.
In the domain of philanthropy and corporate commitment towards future generations, DuPonts rapport with the Society of Plastic Engineers (SPE) Foundation via the DuPontTM Tedlar Scholarship is commendable. This scholarship program not only recognizes academic excellence amongst students in plastics engineering and STEM but dovetails with broader educational initiatives such as the PlastiVan program aimed at kindling STEM passions amongst youth, corroborating DuPonts veneration for science as a conduit to societal progress.
While bolstered by these strategic initiatives and a robust Zacks Rank #2 (Buy), DuPont's recent market buoyancy is juxtaposed with a surprising analyst outlook, as reported by Barrons.com. BofA Securities downgraded DuPont from "Buy" to "Sell," a bold revision that insinuates inferred operational or industry hurdles warranting investor vigilance. This divestiture of confidence charts a complex picture for DuPont, crisscrossed by financial forecasts, strategic endeavors, and analyst perspectives.
Amidst this concatenation of developments, DuPont's current and future prospects command a scrupulous gaze. While the arc of progress continues to bend towards innovation and sustainability, challenges and uncertainties remain salient, mandating a nuanced approach to investment decisions in the multifaceted landscape of materials science.
Over the specified period, DuPont de Nemours, Inc. displayed notable fluctuations in its stock performance. The model used to analyze this behavior shows that on average, there was not a predictable change in the returns from one day to the next; however, the data suggests that larger than average movements tended to follow periods of other large movements, hinting at a level of clustering in the volatility. The statistical values indicate a significant level of volatility, as reflected by the positive and significant coefficients that imply that past large returns (either positive or negative) are likely to be followed by large returns.
| Statistic | Value |
|---|---|
| R-squared | 0.000 |
| Adj. R-squared | 0.001 |
| Log-Likelihood | -2713.46 |
| AIC | 5430.92 |
| BIC | 5441.19 |
| No. Observations | 1,255 |
| Df Residuals | 1255 |
| Df Model | 0 |
| omega | 3.3620 |
| alpha[1] | 0.3459 |
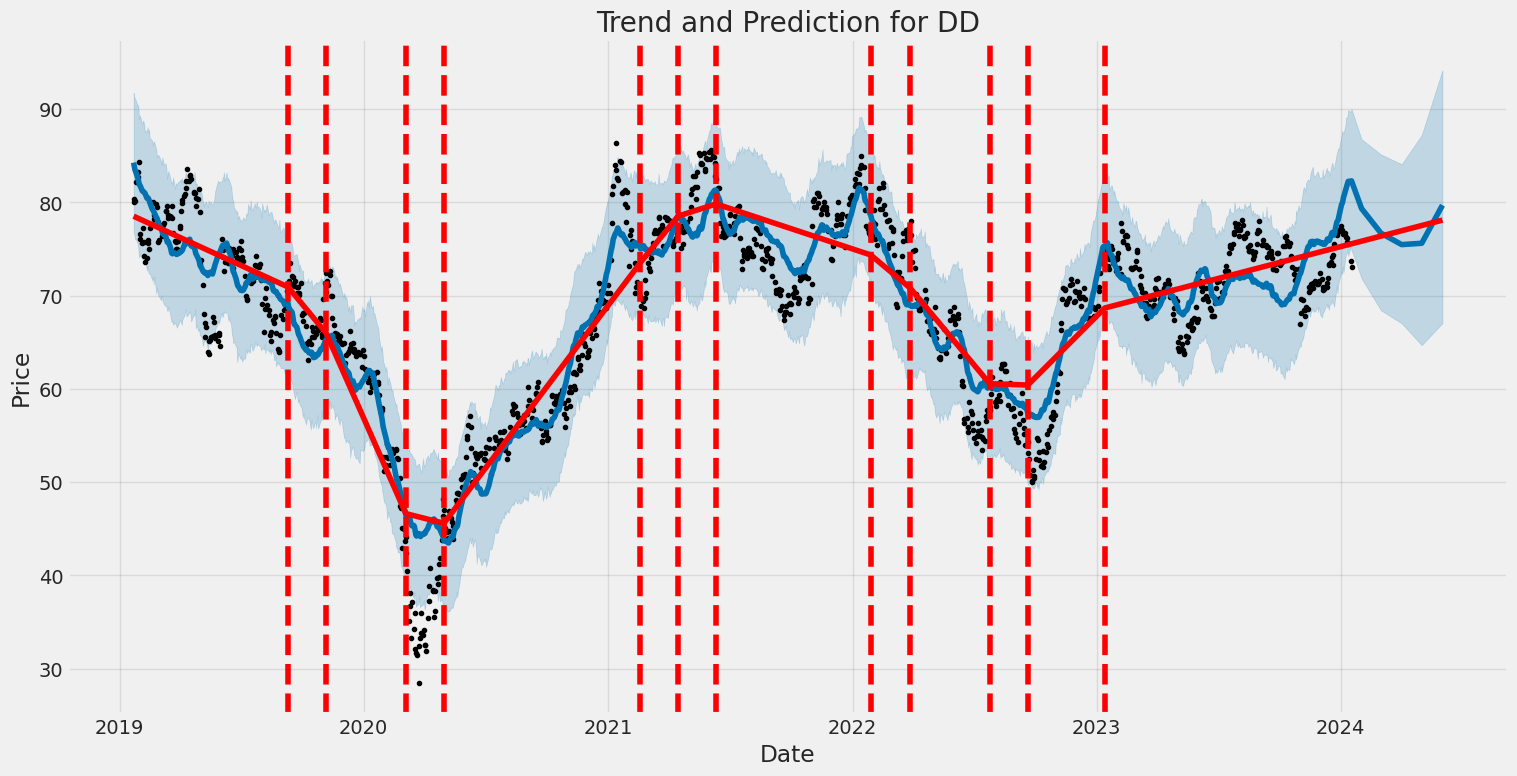
To analyze the financial risk of a $10,000 investment in DuPont de Nemours, Inc. (DD) over a one-year period, a combination of volatility modeling and machine learning predictions can provide a comprehensive assessment of the potential price movements and associated risks.
Volatility modeling techniques are used to quantify the level of risk related to the variability of DuPont de Nemours, Inc.'s stock price over time. In this context, a particular statistical approach is employed to estimate, under current market conditions, how much the stock's returns could be dispersed in the future. This model uses historical price data to calibrate a time series model, capturing both the long-term trends and short-term fluctuations in the stock's volatility. It enables an investor to gauge the expected magnitude of price swings and to determine the levels of uncertainty in the value of their holding.
Once the volatility pattern is established, the machine learning predictions approach helps to forecast future returns of DuPont de Nemours, Inc. by considering a wide array of input variables, such as past price movements, financial ratios, industry trends, and economic indicators. The machine learning algorithm used for this purpose is capable of capturing complex, non-linear relationships in the data that might be overlooked by traditional forecasting methods. By continuously learning from new data as it becomes available, the predictive model adapts and refines its forecast, aiming to provide an insight into the expected performance of the stock.
Combining the outcome of the volatility model with the machine learning forecast, the investment risk profile for DuPont de Nemours, Inc. can be better understood. Here, the Value at Risk (VaR) metric serves as a key indicator, providing an estimate of the maximum expected loss over a specified time frame and at a given level of confidence. In this scenario, with the calculated VaR at a 95% confidence interval for a $10,000 investment standing at $246.32, it means that there is a 95% chance that the investment will not lose more than $246.32 over the period of one year, under normal market conditions. This figure provides the investor with a tangible sense of the potential downside, essentially quantifying the amount of risk they are exposed to.
Overall, this analysis combines the strengths of volatility modeling to capture the dynamic nature of stock price movements, and the foresight provided by machine learning predictions, to offer an investors a quantified view into the potential financial risks associated with investing in DuPont de Nemours, Inc.
Similar Companies in Specialty Chemicals:
Eastman Chemical Company (EMN), Olin Corporation (OLN), Cabot Corporation (CBT), Kronos Worldwide, Inc. (KRO), LyondellBasell Industries N.V. (LYB), Air Products and Chemicals, Inc. (APD), Report: PPG Industries, Inc. (PPG), PPG Industries, Inc. (PPG), Report: Linde plc (LIN), Linde plc (LIN), Ecolab Inc. (ECL), Report: The Sherwin-Williams Company (SHW), The Sherwin-Williams Company (SHW), Report: RPM International Inc. (RPM), RPM International Inc. (RPM), Albemarle Corporation (ALB), BASF SE (BASFY), Dow Inc. (DOW), LyondellBasell Industries N.V. (LYB), Report: PPG Industries, Inc. (PPG), PPG Industries, Inc. (PPG), Eastman Chemical Company (EMN), 3M Company (MMM), Huntsman Corporation (HUN), FMC Corporation (FMC), Westlake Chemical Corporation (WLK), Celanese Corporation (CE)
https://www.zacks.com/stock/news/2194569/why-you-should-retain-dupont-dd-stock-in-your-portfolio
https://www.zacks.com/stock/news/2195264/dupont-dd-launches-tedlar-pvf-solutions-and-pvf-coating
https://www.zacks.com/stock/news/2196001/dupont-dd-gains-on-innovation-and-spectrum-plastics-buyout
https://www.zacks.com/stock/news/2206774/here-s-why-you-should-hold-onto-dupont-dd-stock-for-now
https://finance.yahoo.com/news/heres-why-hold-onto-dupont-121700941.html
https://finance.yahoo.com/news/7-blue-chip-stocks-snap-215952820.html
https://finance.yahoo.com/news/only-buy-one-hydrogen-stock-100000459.html
https://finance.yahoo.com/news/bet-winning-dupont-analysis-pick-124600332.html
https://finance.yahoo.com/news/dupont-tedlar-scholarship-awarded-stem-140000493.html
https://finance.yahoo.com/news/zacks-com-featured-highlights-sprouts-141700999.html
https://www.zacks.com/stock/news/2210614/here-s-why-you-should-add-dupont-dd-to-your-portfolio-now
https://finance.yahoo.com/news/heres-why-add-dupont-dd-130800183.html
https://finance.yahoo.com/m/d1c5919c-b538-3a6c-b13b-bfd7fd08d66d/dupont-gets-double-downgraded.html
https://www.sec.gov/Archives/edgar/data/0000030554/000175567223000025/ctva-20230930.htm
Copyright © 2024 Tiny Computers (email@tinycomputers.io)
Report ID: oRlwr4