Denny's Corporation (ticker: DENN)
2024-02-28
 Denny's Corporation, publicly traded under the ticker symbol DENN, is a recognizable player in the full-service restaurant industry, primarily known for its classic American diner-style offerings. Founded in 1953, Denny's has grown significantly over the decades, boasting hundreds of locations globally. The company operates under a franchise model, which not only facilitates its widespread presence but also enhances its profitability by reducing operational complexities and overhead costs. Financially, Denny's Corporation has shown resilience through various economic cycles, a testament to its strong brand loyalty among consumers and effective management strategies. Furthermore, DENN's commitment to menu innovation and customer service continues to play a critical role in its ability to attract a diverse customer base. Despite the challenging landscape marked by competition and changing consumer preferences, Denny's Corporation remains a key contender in the casual dining sector, leveraging its iconic brand and strategic initiatives to drive growth and shareholder value.
| Address | 203 East Main Street | City | Spartanburg | State | SC |
|---|---|---|---|---|---|
| Zip | 29319-9966 | Country | United States | Phone | 864 597 8000 |
| Website | https://www.dennys.com | Industry | Restaurants | Sector | Consumer Cyclical |
| CEO & Director Total Pay | 977,053 | Executive VP & CFO Total Pay | 758,056 | Executive VP, Chief Legal Officer & Secretary Total Pay | 760,880 |
| Executive VP & Chief Global Development Officer Total Pay | 651,714 | Previous Close | 9.25 | Open | 9.32 |
| Day Low | 9.215 | Day High | 9.4 | Volume | 448,698 |
| Average Volume | 534,395 | Average Volume 10 Days | 620,800 | Market Cap | 491,570,816 |
| 52 Week Low | 8.12 | 52 Week High | 12.53 | Price To Sales Trailing 12 Months | 1.059598 |
| Fifty Day Average | 10.394 | Two Hundred Day Average | 10.19545 | Beta | 1.987 |
| Market Cap | 491,570,816 | Profit Margins | 0.04299 | Shares Outstanding | 53,085,400 |
| Shares Short | 2,597,529 | Shares Percent Shares Out | 0.048899997 | Held Percent Insiders | 0.047459997 |
| Held Percent Institutions | 0.85102 | Short Ratio | 4.85 | Book Value | -1.168 |
| Trailing Eps | 0.35 | Forward Eps | 0.74 | Enterprise Value | 885,869,504 |
| Revenue Growth | -0.045 | Net Income to Common | 19,945,000 | Earnings Quarterly Growth | -0.773 |
| Revenue Per Share | 8.287 | Total Revenue | 463,921,984 | Operating Margins | 0.13796 |
| Ebitda | 75,992,000 | Total Debt | 395,263,008 | Total Cash | 6,174,000 |
| Statistic Name | Statistic Value | Statistic Name | Statistic Value |
| Sharpe Ratio | -0.6902481274913521 | Sortino Ratio | -11.281327669400413 |
| Treynor Ratio | -0.19342245443073933 | Calmar Ratio | -0.6021583291850519 |
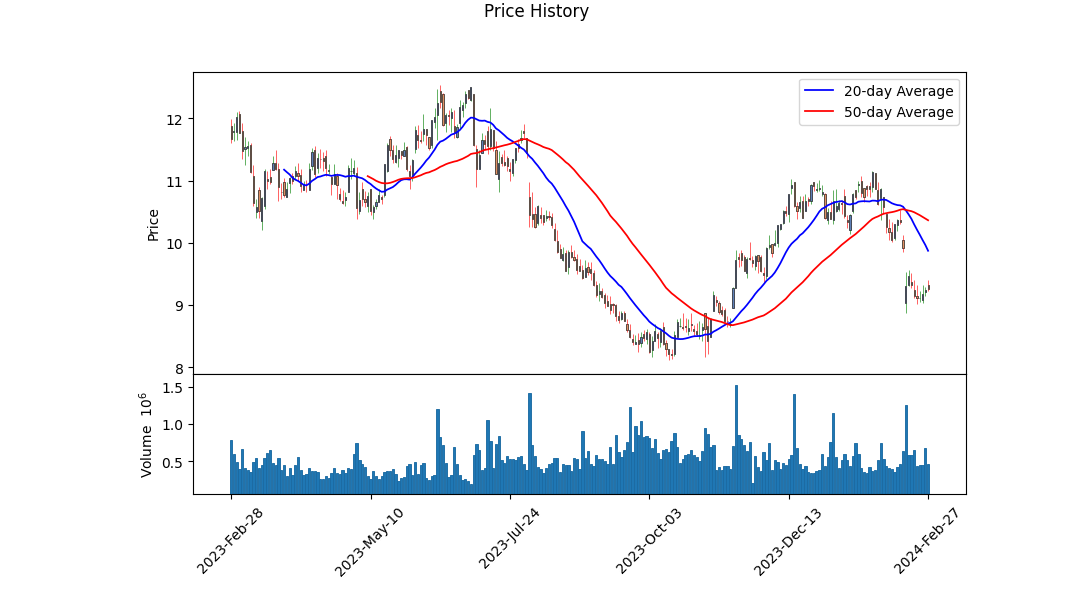
Analyzing the financial health and future stock price movement of DENN involves a multifaceted approach, integrating both technical and fundamental analysis. The technical data points to a varied performance in the stock's trajectory over the recent months, with closing rates experiencing gradual increases. Notably, the OBV (On-Balance Volume) metric, which is a cumulative indicator that uses volume flow to predict changes in stock price, underwent substantial fluctuations. These movements culminated in a negative figure by the last trading day, suggesting that selling pressure has outpaced buying pressure in the recent term. Despite this, the MACD (Moving Average Convergence Divergence) displayed a narrowing negative histogram towards the latest date, potentially indicating a slowing in the downward momentum of the stock or an incipient trend reversal.
The fundamental analysis paints a more nuanced picture. The DEC 31, 2023, financial snapshots reveal some critical insights into the company's economic standing. With an increasing net debt and total liabilities outstripping total assets, DENN shows signs of financial stress. Nonetheless, the company's gross profit does exhibit robustness, hinting at effective operational capabilities despite its leveraged position. Moreover, the positive operational incomes underscore the company's potential to sustain or even expand its profitability, which should be a signal to investors about the underlying business strength.
This juxtaposition of technical data with fundamental health suggests that while short-term market sentiment may drive volatility in DENNs stock price, the company's core financials present a backbone of stability and potential for recovery and growth. This duality underscores the importance of balancing technical indicators with fundamental analysis in forecasting future stock movement.
The figures shown by the Sharpe, Sortino, Treynor, and Calmar ratios further inform us about the risk-adjusted returns of DENN's stock. The negative values across these ratios illustrate that the stock has underperformed on a risk-adjusted basis over the past year. Particularly, the severely negative Sortino ratio indicates high downside volatility, which may deter risk-averse investors. However, these metrics also signal potential for risk-tolerant investors who seek to capitalize on the discrepancies between the company's current market perception and its fundamental business performance.
Coupled with the analyst expectations revealing optimistic projections for earnings and revenue growth in the forthcoming periods, there's a compelling case for a potential rise in DENN's stock price over the next few months. This outlook is mitigated by considerations such as the current financial leverage and the market's overall sentiment, which can significantly impact the pace and magnitude of any recovery or growth.
Thus, while the immediate future may present a mix of challenges and opportunities, a nuanced interpretation of DENN's technical and fundamental indicators, alongside external analyst expectations, suggests cautious optimism. Investors are recommended to weigh these factors thoroughly, considering both the inherent risks and the potential for gains predicated on the company's strategic financial maneuvers and market conditions.
In our comprehensive analysis of Denny's Corporation (DENN), two critical financial metrics have been calculated to assess the company's performance and attractiveness as an investment opportunity: Return on Capital (ROC) and Earnings Yield. The ROC, which stands at 17.07134914444094%, serves as a robust indicator of the efficiency with which DENN is utilizing its capital to generate profit. This figure is exceptionally revealing, suggesting that the company has adeptly managed its capital, thus outperforming many competitors in terms of operational efficiency and profitability. On the other hand, the Earnings Yield for Denny's Corporation is calculated to be 3.7796976241900646%, an essential metric for investors, as it provides insight into the potential returns on investments compared to other financial instruments or companies. Although not as high as the ROC, this earnings yield indicates a reasonable level of profitability, making DENN an intriguing option for long-term investors seeking steady returns. Together, these metrics provide a nuanced view of Denny's Corporation's financial health and potential as a valuable addition to an investment portfolio.
In evaluating Denny's Corporation (DENN) based on Benjamin Graham's investment criteria as outlined in "The Intelligent Investor," we use several key metrics to determine if DENN aligns with the principles of value investing that Graham advocates. Below is a detailed analysis of these metrics and how DENN compares to Graham's criteria.
Price-to-Earnings (P/E) Ratio
Denny's Corporation has a P/E ratio of approximately 9.99. Graham sought out companies with low P/E ratios, typically lower than the market average or the industry average, as this could indicate a undervalued stock. Unfortunately, the industry P/E ratio is not provided, making it challenging to directly compare DENN's performance against its peers. However, in a general sense, a P/E ratio below 10 could be considered low and potentially in line with Graham's criteria for value.
Price-to-Book (P/B) Ratio
The P/B ratio for DENN stands at approximately 1.06, which suggests that the stock is trading slightly above its book value. Graham often favored stocks trading below their book value, viewing them as undervalued. While DENN's P/B ratio indicates that it is trading near its book value, it does overshoot Graham's preference for a ratio less than one. Nonetheless, it's relatively close, which could still interest value investors, especially in certain market conditions.
Debt-to-Equity Ratio
DENN's debt-to-equity ratio is reported at approximately -6.31. This negative ratio is unusual and could be indicative of accounting specifics, significant equity, or other financial structuring. Generally, Graham preferred companies with a low debt-to-equity ratio, interpreting lower debt as indicative of lower financial risk. In the traditional sense, DENNs negative ratio would invite further investigation to understand its financial health and risk profile better.
Current and Quick Ratios
Both the current and quick ratios for DENN are identical at about 0.43. These ratios measure a company's ability to cover its short-term liabilities with its short-term assets, with higher values being preferable. Graham looked for strong liquidity as a sign of financial stability; typically, a current ratio of 2:1 is considered healthy. DENN's current and quick ratios are well below this benchmark, suggesting potential liquidity concerns that might not align with Graham's criteria.
Earnings Growth
While the specific earnings growth figures for DENN are not provided, Graham emphasized the importance of consistent earnings growth over several years. Investors would need to review DENN's earnings history to evaluate its performance against this criterion.
Conclusion
Based on the above analysis, Denny's Corporation presents a mixed picture against Benjamin Graham's investment criteria. The company's low P/E ratio aligns with Graham's preference for undervalued stocks. However, its slightly above-book-value P/B ratio, an unusual negative debt-to-equity ratio, and low liquidity ratios as measured by current and quick ratios may raise concerns from a pure Graham perspective. Prospective investors might see the low P/E ratio as a positive sign, but the deviations in other key metrics suggest caution and a deeper dive into the company's financial health and market position before considering an investment. Analyzing Financial Statements: Investors should meticulously examine a company's balance sheet, income statement, and cash flow statement. Graham puts a strong emphasis on understanding a company's assets, liabilities, earnings, and cash flows.
Given the extensive data for Denny's Corporation (symbol: DENN), let's break down key components of its financial statements over recent periods, focusing on the FY ending December 29, 2021, and observing notable points from quarterly reports where relevant.
Assets
By the end of FY 2021, Denny's Corporation reported total assets of approximately $435.5 million, a noticeable increase from its assets in the earlier quarters. Important components of its assets include: - Cash and Cash Equivalents: Increased significantly over the year, standing at roughly $30.6 million by FY end. - Receivables and Inventories: Essential for the restaurant's operations, showing liquidity and stock for operations. - Property, Plant, and Equipment: Valued at about $91.2 million, indicating significant investment in physical assets crucial for Denny's operations. - Goodwill and Intangible Assets: Reflecting the brand value and other non-physical assets valued at over $86.7 million.
Liabilities
Total liabilities by the end of FY 2021 were about $500.8 million, showing a substantial amount of obligations. Key liabilities include: - Long-term Debt: Standing at $170 million, a significant figure that shows the companys financial commitments. - Operating Lease Liabilities: Highlighting the costs of leasing essential property and equipment necessary for operations.
Equity
The stockholder equity by the end of FY 2021 was approximately -$65.3 million, indicating a negative equity position. This aspect requires careful analysis as it may point to financial distress or heavy leveraging by the company.
Income Statement Observations
For FY 2021, Denny's Corporation reported a net income of roughly $78.1 million, a promising figure indicating profitability. Operational revenues and the costs associated with generating those revenues, such as direct materials and labor costs, highlight the company's capacity to manage expenses effectively against its earnings.
Cash Flows
Dennys demonstrated solid cash flow from operations, totaling approximately $76.2 million for FY 2021, emphasizing its capability to generate cash from its primary business activities. However, investing activities and financing activities also reflect the company's strategic decisions, such as asset acquisitions and managing its debt and equity financing.
Other Comprehensive Income
The reporting of other comprehensive income, including gains and losses on derivative instruments and foreign exchange, provides insight into the other financial implications of Denny's operational strategies.
Key Takeaways
-
Asset Management: The increment in cash and cash equivalents over the year is a positive sign. However, the substantial holdings in physical assets and goodwill demand scrutiny on their performance and return on investment.
-
Liabilities Concern: The high level of long-term debt and lease obligations necessitates a careful evaluation of the companys leverage and its impact on financial health.
-
Profitability: Despite negative equity, Denny's Corporation manifested profitability in FY 2021, showcasing effective revenue management and operational efficiency.
-
Cash Flows: Solid operational cash flow indicates healthy business operations, but the financial structuring depicted in financing activities might require strategic reassessment.
This analysis illuminates Denny's current financial position, risks, and operational strengths as per Benjamin Graham's principles, urging a deep dive into asset performance, debt management, and long-term strategy for sustained growth and stability.Based on the information provided, it seems the stock identified by the symbol 'DENN' does not have any historical dividend records presented here. Benjamin Graham, as mentioned in "The Intelligent Investor," valued companies that consistently paid dividends. The absence of data makes it challenging to assess 'DENN' from a dividend perspective based on Graham's principles. To align with Graham's investment methodology, an investor would seek out further information regarding 'DENN's dividend history, including the consistency and reliability of its dividend payments over time.
| Statistic Name | Statistic Value |
| R-squared | 0.248 |
| Adj. R-squared | 0.247 |
| F-statistic | 413.5 |
| Prob (F-statistic) | 1.14e-79 |
| Log-Likelihood | -3202.0 |
| AIC | 6408. |
| BIC | 6418. |
| coef (const) | -0.0698 |
| coef (0) | 1.3482 |
| Std err (const) | 0.088 |
| Std err (0) | 0.066 |
| t (const) | -0.797 |
| t (0) | 20.334 |
| P>|t| (const) | 0.426 |
| P>|t| (0) | 0.000 |
| [0.025 (const) | -0.242 |
| 0.975 (const)] | 0.102 |
| [0.025 (0) | 1.218 |
| 0.975 (0)] | 1.478 |
| Skew | 0.999 |
| Kurtosis | 25.714 |
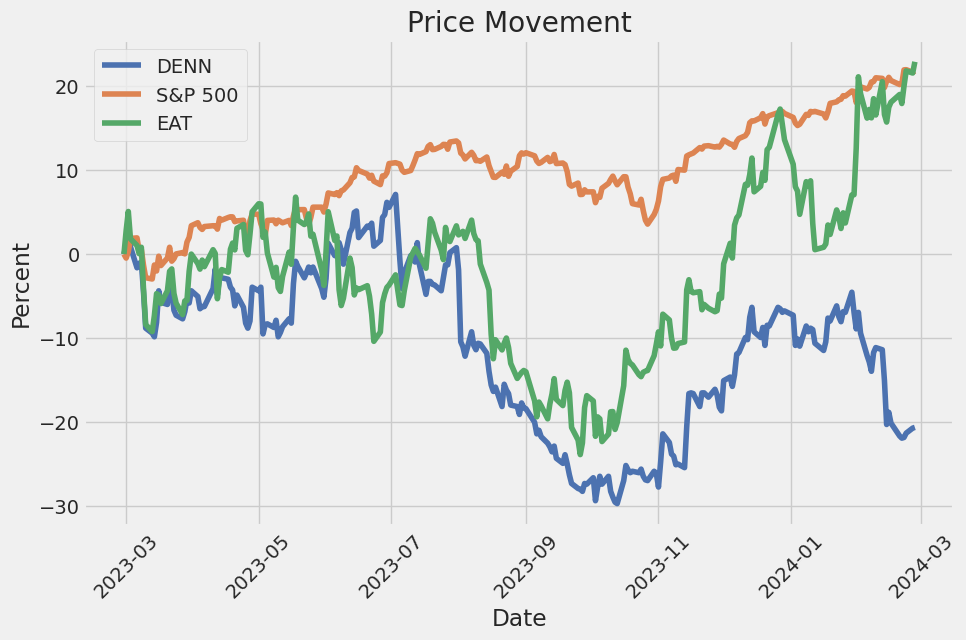
The linear regression model reveals a noteworthy relationship between DENN and SPY, where DENN acts as the dependent variable, and SPY is an indicator of the broader market performance. The model's alpha value is -0.0697694141283379, indicating that, in the absence of any movement in the SPY, DENN's performance would theoretically decrease by approximately 0.0698 units. This negative alpha value, although may seem minimal, is crucial for understanding the stock's baseline performance independent of market movements.
Moreover, the beta coefficient of the model is 1.3482130405441686, suggesting that DENN is more volatile than the market. This implies that for every 1% increase in SPY, DENN is expected to increase by approximately 1.3482%, after adjusting for its baseline performance. The statistical analysis, supported by an R-squared of 0.248, indicates that about 24.8% of the variation in DENN's returns can be explained by movements in the market index SPY. This showcases a moderate level of linear association between DENN and the market movements, highlighting the sensitivity of DENN towards market trends.
Denny's Corporation concluded its fourth quarter of 2023 with a strong performance, achieving a 1.3% increase in domestic system-wide same restaurant sales, signaling sequential improvement throughout the quarter. This positive momentum allowed Denny's to report a 3.6% growth in system-wide same restaurant sales for the full year, surpassing the high end of their previously guided range. This accomplishment is particularly noteworthy in light of the operational challenges faced by the industry in 2023. Dennys outperformance against the full-service industry benchmark, both in the fourth quarter and the entire year, underscores the effectiveness of their strategic focus and operational execution.
Looking ahead to 2024, Denny's enters the new year with clear strategic priorities that have resonated well with consumers. The focus remains on offering best-in-class breakfast options, maintaining an unbeatable value proposition, and enhancing convenience through unique off-premise options. The company shared these strategies with franchisees last summer, culminating in a comprehensive unveiling at their annual convention in October. By November, Denny's began implementing these strategies, which included menu innovations and pricing adjustments aimed at improving margins while maintaining their value leadership.
The company's new menu and product innovations have been particularly successful. Denny's reinforced its dominance in the breakfast segment with the introduction of craveable items like the new strawberry stuffed French toast slam, which has been met with positive customer feedback. Additionally, efforts to simplify the menu and minimize customizations have streamlined operations and allowed for a focus on high-margin and popular items. Denny's also adopted a smart pricing approach to minimize traffic erosion from price increases, which is significant given the current economic environment where consumers are sensitive to price changes.
On the development front, Denny's opened 32 new restaurants in 2023, marking the highest number of openings since 2017. This expansion includes both Denny's and KeKe's franchise cafes, with noteworthy progress being made in integrating KeKe's into Denny's portfolio. The brand's growth strategy not only involves expansion within existing markets but also reaching into new territories, as evidenced by the opening of a KeKe's location outside of Florida. Denny's is leveraging its franchise model and network to fuel growth and capture market share in the growing day-time eatery segment, showing promise for continued momentum in 2024.
The SEC 10-Q filing for Denny's Corporation for the quarter ended September 27, 2023, reveals key financial details and operational highlights for the company. During this period, Denny's reported total operating revenue of $114.2 million, a slight decrease from the $117.5 million reported in the same quarter of the previous year. The company operates two main segments: Dennys and Kekes. As of September 27, 2023, Denny's brand comprised 1,588 restaurants, with the majority being franchised or licensed.
The report detailed company restaurant sales and franchise and license revenue. Company restaurant sales amounted to $53.2 million, slightly up from the $52.2 million reported in the prior year's corresponding period. Franchise and license revenue, however, decreased from $65.2 million in the previous year to $61 million in the current reporting period. Costs related to both company restaurant sales and franchise and license revenue were discussed, highlighting the changes in expenses relative to sales.
Denny's disclosed that net income for the quarter stood at $7.9 million, a decline from the $17.1 million recorded in the prior year, reflecting challenges in operations or market conditions affecting profitability. The filing also highlighted the impact of interest expenses and provided a detailed account of general and administrative expenses, operating gains, losses, and other charges.
Capital expenditures were reported, with a notable mention of Denny's commitment to a technology transformation initiative focusing on a new cloud-based restaurant technology platform aimed at enhancing the guest experience. This initiative aligns with Denny's future strategic direction toward modernization and efficiency improvements.
From a liquidity and capital resources standpoint, Denny's showcased its operations and financing activities, detailing net cash from operating activities and uses of cash including investing and financing. The company emphasized its credit facility, which stood at a borrowing level of $248.1 million as of the quarter's end, and mentioned compliance with financial covenants.
Share repurchase activities were disclosed, with the company repurchasing 1.7 million shares at an average price of $9.73 per share during the quarter, underscoring Denny's ongoing commitment to returning value to shareholders.
Overall, Denny's Corporation's 10-Q filing for Q3 2023 provides a comprehensive look at the company's financial health and operational performance, highlighting key financial metrics, strategic initiatives, and capital management activities.
Denny's Corporation, a venerable name in the American diner-style restaurant scene, has faced a rigorous test of its business model and operational strategies amidst evolving market dynamics and consumer preferences. The recent disclosures and assessments provide a comprehensive look into the financial health, strategic pivots, and market positioning of this iconic brand as it navigates the complexities of the modern restaurant industry.
In 2023, Denny's reported a modest revenue increase to $463.9 million, which represents a steady, albeit slight, progression in sales amidst challenging economic conditions. This growth is notable, given the broader context of the hospitality industry's struggles with pandemic-related disruptions and changing consumer dining habits. The resilience in sales underscores Denny's enduring appeal and the effectiveness of its brand and menu refreshes aimed at attracting a diverse clientele.
However, the backdrop of this sales increase is a stark decline in net income, which plummeted by a dramatic 73% to $19.9 million from the prior year. This sharp fall in profitability, bringing the profit margin down to 4.3% from 16%, highlights the severe pressure on operational margins. Factors such as rising food and labor costs have significantly impacted the bottom line, reflecting the broader inflationary trends affecting the casual dining sector.
Adding to the financial story, Denny's same-store sales growth of 3.6% for the fiscal year 2023 barely outpaced general inflation. This marginal achievement came at the cost of price increases of 7.5% throughout the year, which, coupled with a 6% drop in customer traffic in Q4 2023, points to the delicate balance Denny's must maintain between driving sales and retaining customer loyalty.
In the face of these pressures, Denny's strategic initiatives reveal a company striving for evolution and growth. The introduction of new menu items, including innovative breakfast options and the exploration of virtual brands, like Banda Burrito, and off-premise sales initiatives, illustrate Denny's efforts to diversify its offerings and revenue streams. These moves, aimed at capturing new market segments and adapting to the rising trend of digital and delivery-based dining, mark a significant pivot in Denny's operational strategy.
Yet, the operational challenges are underscored by the net closure of 29 units in 2023, bringing Denny's store count down to 1,573 from a peak of 1,735 units in 2017. This contraction in Denny's footprint, due in part to rising operational costs and the challenging profitability threshold of $1.2 million in annual sales per unit, highlights the ongoing recalibration of its business model to align with current market realities. The anticipated continued net unit closures in 2024, albeit at a slower pace, suggest a cautious approach to expansion amidst economic uncertainties.
Amidst these operational and financial challenges, Denny's holds onto a thread of optimism, buoyed by a slight revenue increase and strategic diversification efforts. The launch of a new cloud-based POS platform across company restaurants, aimed at enhancing operational efficiency, alongside the strategic expansion and integration of Kekes Breakfast Cafe, underscores Denny's ambition to innovate and adapt.
Furthermore, Denny's commitment to sustainability and corporate responsibility, through initiatives supporting community welfare and environmental sustainability, aligns with growing consumer expectations for ethical and sustainable business practices. These efforts, combined with investments in technology and market expansion, signal Denny's determination to navigate the complexities of the restaurant industry and position itself for future growth.
Despite the nuanced challenges reflected in the financial metrics and strategic shifts, Denny's resilience and adaptability shine through. The company's endeavor to enhance customer experience, operational efficiency, and societal impact, against the backdrop of a competitive and dynamic market, outlines a path of cautious optimism. As Dennys navigates these challenges, its strategic choices, from menu innovation to emphasis on digital dining options, will be critical in shaping its trajectory in the years to come.
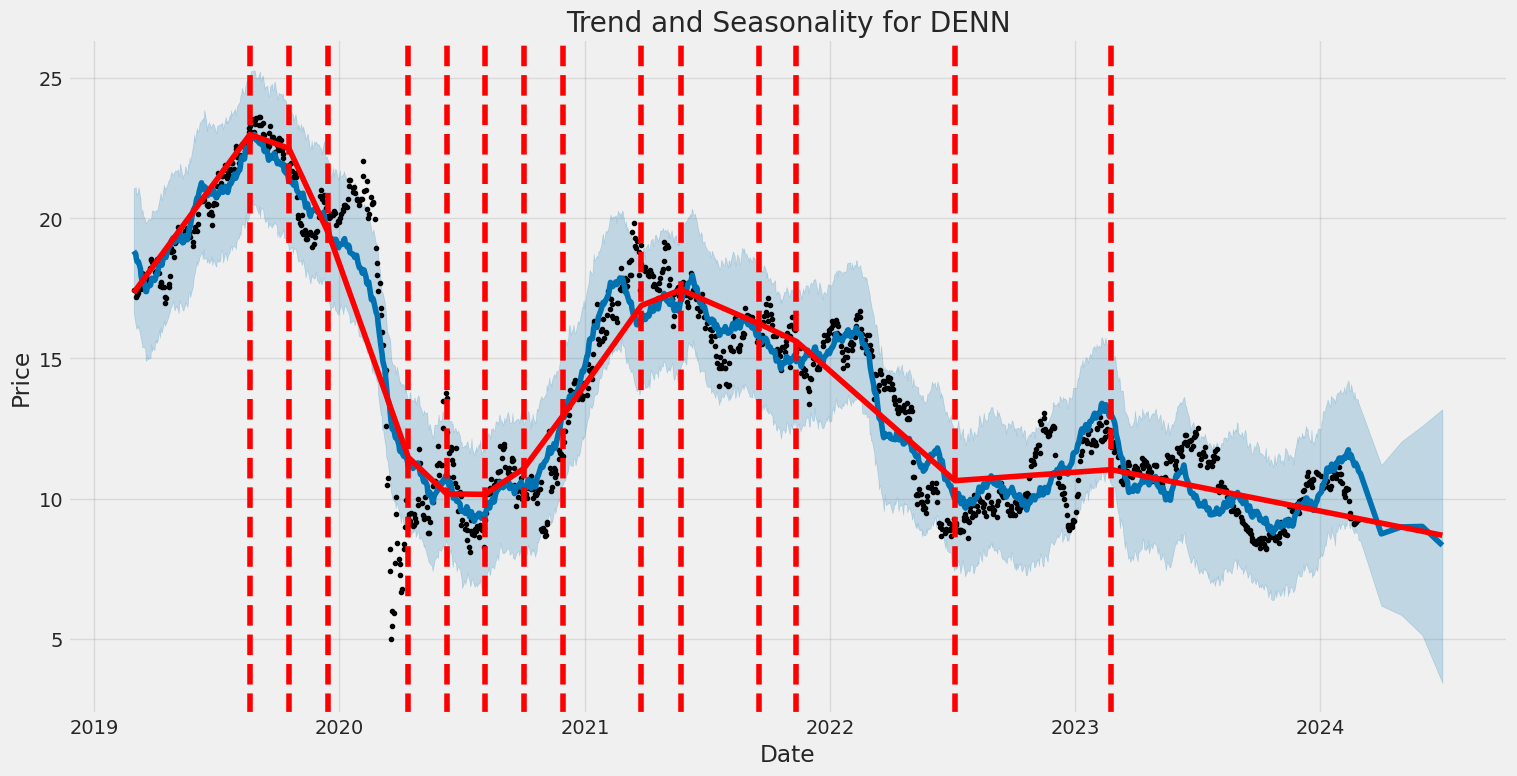
Denny's Corporation (DENN) experienced a notable level of volatility from March 2019 to February 2024, as identified through the ARCH model analysis. The volatility model indicates a substantial average level of fluctuation with an omega value of 7.9088 and an alpha[1] of 0.4260, pointing towards a significant impact of past shocks on current volatility. This is further evidenced by the model's confidence intervals and statistical significance, highlighting the unpredictable and dynamic nature of Denny's Corporation's asset returns during this period.
| Statistic Name | Statistic Value |
|---|---|
| Log-Likelihood | -3254.74 |
| AIC | 6513.47 |
| BIC | 6523.75 |
| Number of Observations | 1256 |
| Omega | 7.9088 |
| Alpha[1] | 0.4260 |
When evaluating the financial risk inherent in a $10,000 investment in Denny's Corporation (DENN) over a one-year period, a multifaceted approach involving volatility modeling and machine learning predictions proves invaluable. This analysis leverages volatility modeling to assess the fluctuating nature of DENN's stock prices, offering a quantifiable measure of the investment's potential risk exposure. Concurrently, machine learning predictions contribute by extrapolating future returns based on historical data patterns, thus providing a predictive glance at the investment's possible performance.
Volatility modeling is instrumental in understanding how the price of Denny's Corporation stock could swing over time, capturing the essence of market dynamics that affect stock performance. By applying this model, we can extract a refined estimate of the stock's volatility, which is crucial for predicting the range of potential price movements DENN might experience. This modeling method, by dissecting past price variations, shines a light on the inherent risk of price fluctuations that investors may face.
In tandem, machine learning predictions, specifically those generated by an ensemble learning method known for its ability to handle complex, non-linear relationships between predictors and target variables, provide a forward-looking angle. This method employs historical stock performance data, incorporating various factors and trends, to forecast future stock returns of Denny's Corporation. The strength of this approach lies in its adaptability and learning capabilities, which refine the accuracy of return predictions over time.
Focusing on the calculated Annual Value at Risk (VaR) at a 95% confidence interval, which stands at $346.57 for a $10,000 investment in DENN, offers a clear perspective on potential financial risk. This figure essentially means that there is a 95% probability that the investment will not lose more than $346.57 over the course of a year, providing a quantifiable risk parameter that investors can consider. The integration of both volatility modeling and machine learning predictions is pivotal in reaching this valuation, juxtaposing the anticipated swings in DENN's stock price against the expected returns.
By analyzing these complementary anglesthe model-derived understanding of stock volatility and the prediction of future returns through machine learninginvestors can attain a nuanced view of the risks associated with investing in Denny's Corporation. The calculated VaR further enriches this analysis by affording a precise measure of potential loss, which, when viewed within the context of broader market conditions and company-specific factors, illustrates the multifaceted nature of equity investment risk. This comprehensive methodology underscores the value of blending advanced statistical techniques with predictive analytics to navigate the complexities of stock investment.
When analyzing the options chain for Denny's Corporation (DENN) call options, it is essential to understand "the Greeks" as they play a significant role in option pricing and strategy development. The Greeks help us assess various factors, including how the price is expected to change based on the underlying stock's movement, time decay, and changes in volatility and interest rates. For this analysis, we're focusing on options with the goal of outperforming a target stock price that is 5% higher than the current level.
First, let's discuss an option with a strike price of $7.5 expiring on April 19, 2024. This option has a delta of 0.8779898995, suggesting it has a high probability of finishing in the money; for every dollar increase in the underlying stock, the price of this option is expected to increase by approximately $0.88. Its gamma value of 0.1072165098 indicates that the delta is relatively stable, as gamma measures the rate of change of delta. The vega of 0.6936549158 shows the option's price sensitivity to a 1% change in implied volatility of the underlying stock. With a theta of -0.0045536806, the option's value will decrease slightly each day it gets closer to expiration, highlighting the effect of time decay. Finally, the rho of 0.8495112683 suggests that with every 1% increase in interest rates, the option's price would increase by approximately $0.85. Considering these Greeks, along with a premium of $0.5 and a return on investment (ROI) of 3.446, making this option very appealing if you believe DENN's stock will rise significantly.
Comparatively, another option with the same strike price of $7.5 but a later expiration date of May 17, 2024, shows different characteristics. It has a lower delta of 0.7782057946, implying a slightly lesser sensitivity to the stock's price movement compared to the first option. The gamma of 0.0839150426 and vega of 1.273386754 suggest it is less stable in terms of delta changes but more sensitive to implied volatility changes. With a theta of -0.0073301585, this option will incur a slightly higher time decay loss per day. Its rho is 1.0310444442, indicating it's more sensitive to changes in interest rates than the first option. However, it has a higher premium of $2.0 and a much lower ROI of 0.1115, which might not be as attractive despite its longer time to expiration.
Considering the target of outperforming a stock price that is 5% above the current level, the first option expiring on April 19, 2024, appears to be the most profitable choice. Its combination of high delta, favorable gamma, and significant ROI, along with a modest premium, positions it as a lucrative opportunity. Moreover, its reasonable time to expiration allows for stock movement potential without being overly penalized by time decay, as indicated by its theta. Given these factors, investors looking for call options on Denny's Corporation might find this option particularly appealing for near to mid-term investment horizons.
Similar Companies in Restaurants:
Report: Brinker International, Inc. (EAT), Brinker International, Inc. (EAT), Report: Bloomin' Brands, Inc. (BLMN), Bloomin' Brands, Inc. (BLMN), Chuy's Holdings, Inc. (CHUY), Jack in the Box Inc. (JACK), BJ's Restaurants, Inc. (BJRI), Dine Brands Global, Inc. (DIN), Ruth's Hospitality Group, Inc. (RUTH), The Cheesecake Factory Incorporated (CAKE), Report: McDonald's Corporation (MCD), McDonald's Corporation (MCD), Yum! Brands, Inc. (YUM), Chipotle Mexican Grill, Inc. (CMG), Domino's Pizza, Inc. (DPZ), Report: Starbucks Corporation (SBUX), Starbucks Corporation (SBUX), Cracker Barrel Old Country Store, Inc. (CBRL)
https://seekingalpha.com/article/4670012-dennys-corporation-denn-q4-2023-earnings-call-transcript
https://finance.yahoo.com/news/dennys-denn-reports-q4-earnings-013003237.html
https://finance.yahoo.com/news/q4-2023-dennys-corp-earnings-113519448.html
https://www.fool.com/investing/2024/02/14/why-dennys-stock-was-in-the-dumps-today/
https://finance.yahoo.com/news/denny-corporation-nasdaq-denn-q4-135046026.html
https://finance.yahoo.com/news/why-dennys-denn-shares-trading-171021921.html
https://finance.yahoo.com/m/3298ab97-681b-3e6d-8e31-dd808577ed89/why-denny%27s-stock-was-in-the.html
https://finance.yahoo.com/news/dennys-corporation-nasdaq-denn-trading-112854502.html
https://finance.yahoo.com/news/dennys-full-2023-earnings-eps-145736810.html
https://www.sec.gov/Archives/edgar/data/852772/000085277223000104/denn-20230927.htm
Copyright © 2024 Tiny Computers (email@tinycomputers.io)
Report ID: DWPIso
Cost: $0.89112
https://reports.tinycomputers.io/DENN/DENN-2024-02-28.html Home