Alphabet Inc. (ticker: GOOGL)
2024-02-03
 Alphabet Inc., trading under the ticker GOOGL, is a multinational conglomerate headquartered in Mountain View, California. It was established through a corporate restructuring of Google in 2015, thereby making Alphabet the parent company not only of Google but also of various former Google subsidiaries and several other ventures across an array of industries. Alphabets portfolio spans from technology products and services, such as search engines, cloud computing, software, and hardware, to more speculative ventures like life sciences, longevity, and autonomous vehicles through its subsidiary Waymo. As of 2023, Alphabet Inc. has solidified its position as one of the worlds leading technology companies by market capitalization, showcasing a remarkable track record in innovation, earnings growth, and expansion. The firm operates on a global scale, affecting both the consumer and enterprise segments with its products and services, thereby sustaining a significant influence on the digital economy. It continuously invests in research and development, which is reflected in its diverse product offerings and the strategic acquisitions meant to enhance its technological capabilities and market reach.
| Full Time Employees | 182,502 | CEO & Director | Mr. Sundar Pichai | CEO Age | 50 |
|---|---|---|---|---|---|
| CEO Total Pay | $7,947,461 | Senior VP & CFO | Ms. Ruth M. Porat | CFO Age | 65 |
| CFO Total Pay | $1,790,046 | Previous Close | 141.16 | Open | 139.26 |
| Day Low | 136.5 | Day High | 142.62 | Volume | 62,152,336 |
| Market Cap | $1,779,080,757,248 | Fifty Two Week Low | 88.58 | Fifty Two Week High | 153.78 |
| Total Cash | $110,916,001,792 | Total Debt | $29,866,999,808 | Total Revenue | $307,393,986,560 |
| Net Income To Common | $73,795,002,368 | Trailing EPS | 5.8 | Forward EPS | 7.83 |
| Return On Assets | 0.14366 | Return On Equity | 0.27356 | Free Cash Flow | $58,657,751,040 |
| Gross Margins | 56.937% | Operating Margins | 28.849% | Profit Margins | 24.007% |
| Sharpe Ratio | 1.0623515168660573 | Sortino Ratio | 16.02947442800174 |
| Treynor Ratio | 0.22374353690825974 | Calmar Ratio | 2.0951056640525865 |
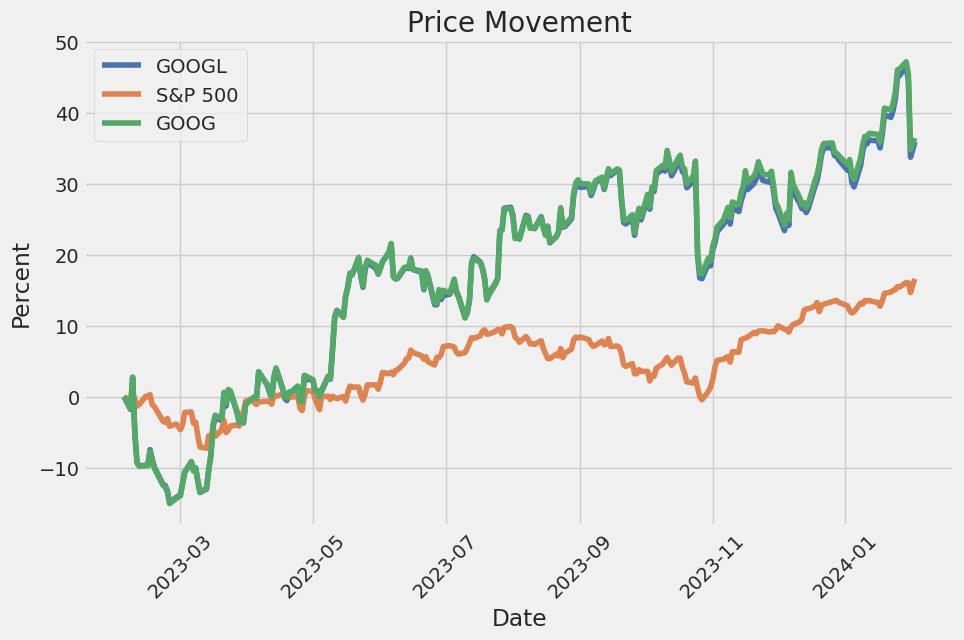
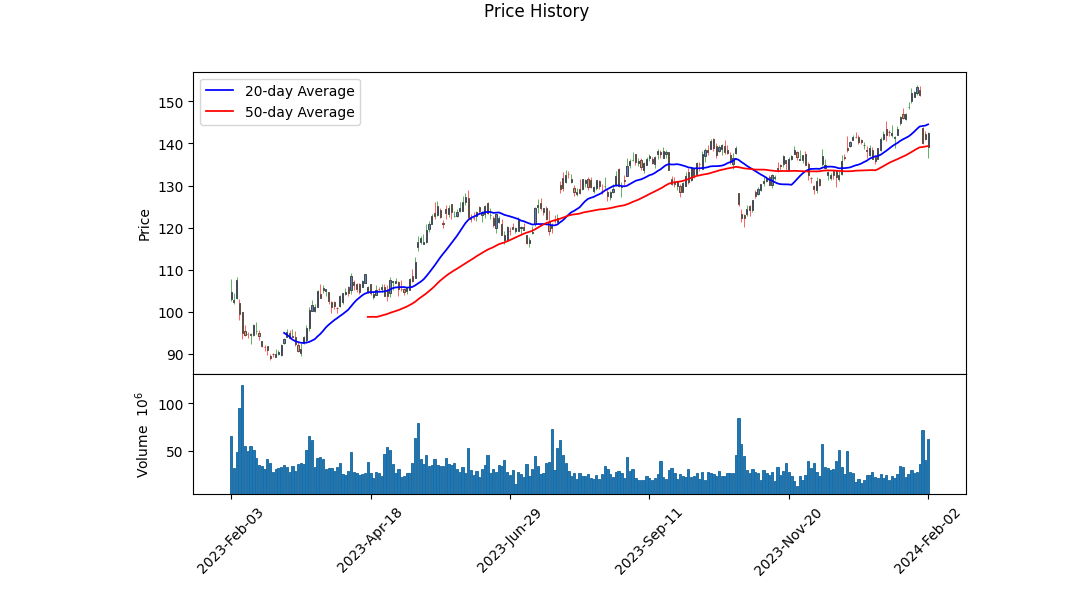
The technical, fundamental, and balance sheet analysis of GOOGL reveals a deeply nuanced portrait of a tech giant poised for future growth despite recent market turbulence. The summaries of technical indicators paint a vivid picture of market dynamics. GOOGL has displayed a notable uptrend over the last four months, reflecting investor confidence and a strong market position. The growth in On-Balance Volume (OBV) underscores rising buying pressure, potentially indicating sustained interest in GOOGL shares. Furthermore, the MACD histogram moving from negative to positive territory reiterates this bullish sentiment, suggesting an upward momentum in the near term.
Delving into the company's fundamentals reveals a robust financial architecture, highlighted by a consistent increase in net income and a substantial gross margin of 0.56937, indicating efficient cost management and healthy profitability. The operating and EBITDA margins further validate GOOGL's operational efficiency and cash-generating capability. Such strong margins are a testament to the company's superior operational execution and strategic market positioning. Moreover, the firm's commitment to R&D signals its dedication to innovation, paving the path for future growth and market expansion.
The balance sheet and cash flow statements offer a lens into the company's strategic financial planning and execution. A tangible book value increase and a buoyant cash reserve underscore financial stability and operational resilience. GOOGL's ability to generate free cash flow while investing in growth initiatives speaks to its fiscal prudence and strategic vision. Additionally, the management of long-term debt showcases a balanced approach to leveraging and financial stewardship, ensuring long-term sustainability.
The risk-adjusted return ratios - Sharpe, Sortino, Treynor, and Calmar - each tell a story of risk management and return optimization. The Sharpe Ratio suggests that GOOGL has provided investors with better returns compared to the risk-free rate, adjusted for volatility. The exceptionally high Sortino Ratio emphasizes that the returns have been achieved with minimal downside risk, a key factor for risk-averse investors. The Treynor and Calmar Ratios further bolster this narrative, indicating that GOOGL's returns are highly commendable when adjusted for market risk and the adverse periods, respectively.
Analyst expectations, encapsulated in earnings and revenue estimates, signal optimistic growth trajectories. The consensus on earnings growth and positive revisions reflect analyst confidence in GOOGL's capacity to navigate market uncertainties and leverage its core competencies for sustained growth. Revenue estimates and projections for the coming year underscore the potential for significant top-line growth, driven by both core and emerging business segments.
In synthesis, the comprehensive analysis underscores GOOGL's solid market position, underpinned by robust fundamentals, a strong balance sheet, and healthy cash flows. The technical indicators, alongside insightful risk-adjusted return ratios, suggest a favorable outlook, buttressed by optimistic analyst expectations. Given these interwoven factors, the forecast for GOOGL's stock price movement in the subsequent months is positive, anticipating upward momentum driven by operational efficiency, strategic growth initiatives, and market confidence. However, investors should remain attuned to broader market dynamics and potential macroeconomic shifts impacting the tech sector at large.
In examining the financial metrics of Alphabet Inc. (GOOGL) through the lens of Joel Greenblatts investing philosophy as outlined in "The Little Book That Still Beats the Market," two pivotal indicators, the Return on Capital (ROC) and Earnings Yield, stand out for evaluation. Alphabet Inc. exhibits a robust Return on Capital (ROC) of 26.29%, a figure that distinctly highlights the company's efficiency in reallocating its capital resources to generate substantial profits. This level of ROC is indicative of a high degree of operational proficiency and a strong competitive moat, traits that are highly valued from an investment perspective as per Greenblatts criteria. On the other hand, Alphabets Earnings Yield is reported at 4.10%, providing insight into the company's valuation from an earnings perspective relative to its share price. Despite appearing modest in isolation, this earnings yield should be considered in the context of the current interest rate environment and in comparison to industry standards. It suggests that Alphabet, while perhaps not the highest yielder, still offers a balanced investment proposition when both growth potential and earnings stability are prized. These metrics collectively render Alphabet Inc. an entity of considerable interest within a disciplined investment framework geared towards identifying high-quality, efficiently run companies at reasonable valuations.
Based on the provided financial statement data and metrics, here is a comprehensive analysis comparing Alphabet Inc. (GOOGL) to Benjamin Graham's investment criteria:
Margin of Safety
Benjamin Graham emphasized the importance of buying securities at prices significantly lower than their intrinsic value to provide a margin of safety. For Alphabet Inc., given the absence of detailed intrinsic value calculations here, it is challenging to assess the margin of safety directly. However, investors would require comprehensive fundamental analysis to determine Alphabet's intrinsic value and compare it to its current trading price.
Analyzing Financial Statements
Graham advocated for a meticulous examination of a company's financial health. Alphabet Inc. showcases strong financial health with substantial cash and cash equivalents ($24,090,000,000) and a robust operating income. The company has consistently generated revenue growth, as seen in the year-over-year increase in revenue from contract with customer excluding assessed tax.
Debt-to-Equity Ratio
Graham preferred companies with low debt-to-equity ratios, indicating lower financial risk. Alphabet Inc.'s financial data does not explicitly provide a debt-to-equity ratio, but given its long-term debt ($14,288,000,000) and substantial stockholders' equity ($244,567,000,000), it's clear that Alphabet maintains a healthy balance, indicative of low financial risk.
Current and Quick Ratios
These ratios assess a company's capability to meet its short-term liabilities with its short-term assets. For Alphabet Inc., the specific current and quick ratios are not directly provided, but the substantial cash reserves and assets current ($184,110,000,000) against liabilities current ($61,782,000,000) suggest a strong liquidity position.
Earnings Growth
Graham looked for companies with consistent earnings growth. Alphabet Inc. demonstrated significant net income growth, as evident in the net income figures provided for multiple quarters, indicating robust earnings growth and operational efficiency.
Price-to-Earnings (P/E) Ratio
Graham usually sought stocks with low P/E ratios. While the specific P/E ratio for Alphabet Inc. is not given in the data, investors can calculate it by dividing the current market price by the earnings per share. Given Alphabet's strong earnings, its essential to assess the P/E ratio in line with market conditions when considering Graham's criteria.
Dividend Record
Graham favored companies with consistent dividend payments. Alphabet Inc. does not have a history of dividend payments, focusing instead on reinvesting earnings into growth and expansion, which deviates from Graham's preference for regular dividends.
Price-to-Book (P/B) Ratio
Graham often sought stocks trading below their book value. Alphabet Inc.'s substantial equity suggests a strong book value, but investors need to calculate the current P/B ratio and compare it to the industry average to evaluate it properly against Graham's principles.
Conclusion
Alphabet Inc. demonstrates strong financial health, consistent earnings growth, and a robust liquidity position, aligning with several of Benjamin Graham's investment principles. However, its lack of dividend payments and the necessity to calculate and assess its P/E and P/B ratios against Graham's criteria means that investors looking to apply Graham's principles should conduct a detailed analysis, including intrinsic value assessment, to determine if Alphabet Inc. fits within a "value investment" framework.
| Statistic Name | Statistic Value |
| R-squared | 0.576 |
| Adj. R-squared | 0.575 |
| F-statistic | 1705 |
| Prob (F-statistic) | 4.11e-236 |
| Log-Likelihood | -2119.7 |
| No. Observations | 1258 |
| AIC | 4243 |
| BIC | 4254 |
| Alpha | 0.020866664341575063 |
| Beta | 1.1545130201865337 |
The linear regression analysis between Alphabet Inc. (GOOGL) and the S&P 500 index (SPY) over the specified period reveals a positive beta coefficient of approximately 1.15. This suggests that for every 1% movement in the S&P 500 index, Alphabet Inc.'s stock price is expected to move about 1.15% in the same direction, indicating a slightly more than proportional reaction to market movements. The alpha value, standing at around 0.0209, points out that GOOGL has been able to deliver a small positive abnormal return over the S&P 500 during this period, independent of the market's movements. The positive alpha value is critical for investors as it signifies GOOGL's potential to generate returns over and above the market return after adjusting for the risks.
However, it's essential to note that the alpha's statistical significance is questionable given the probability value associated with it, indicating the observed alpha might not significantly differ from zero. Such observations necessitate caution when interpreting the relationship between GOOGL's returns and the market's performance as represented by the SPY. Despite the above-average beta suggesting that GOOGL is more volatile than the market, the overall R-squared value of approximately 0.576 shows that about 57.6% of the variations in GOOGL's stock price can be explained by the movements in the SPY index. This leaves a considerable portion of the stock's fluctuations unaccounted for by SPY movements, highlighting the role of other factors or individual company events influencing GOOGL's stock performance.
ation of our data centers, and the depreciation of property and equipment, impact both our cost of revenues and operating expenses.
Cost of revenues primarily includes expenses associated with the operation of our data centers and content acquisition costs. We generate a significant portion of our revenues from advertising, and as such, traffic acquisition costs (TAC), a key component of cost of revenues, represent payments made to our distribution partners and others who direct traffic to our websites. Fluctuations in TAC as a percentage of advertising revenues have been influenced by various factors including changes in partner agreements, the shift in device mix towards mobile, which generally carries higher TAC, and changes in the geographic and product mix of our revenues.
Operating expenses encompass R&D, sales and marketing, and general and administrative costs. R&D expenses are crucial as we focus on innovation across our advertising and cloud businesses, and investments in AI and machine learning. Sales and marketing expenses are primarily related to personnel and marketing and promotional expenditures, which align with our efforts to drive revenue growth and enhance our brand presence. General and administrative costs include personnel costs, professional services fees, and other corporate costs.
We regularly evaluate our spending levels to support our growth and adapt to changing business needs, such as the strategic evaluation of our workforce and real estate investments. As part of an ongoing cost structure optimization initiative announced in January 2023, we undertook a workforce reduction, resulting in severance and related charges, which impacts our operating expenses in the period. Further expenses related to these initiatives may be incurred as we continue to optimize our operations.
Our effective tax rate fluctuates due to changes in the mix of earnings across different tax jurisdictions with varying tax rates, changes in valuation allowances, and the impact of certain non-recurring items. We face audits by domestic and foreign tax authorities and evaluate our tax positions to determine the adequacy of our tax reserves, which affects our overall tax provision.
Regarding liquidity, we maintain a robust financial position, with significant cash, cash equivalents, and marketable securities. We deploy our capital towards investments in our R&D efforts, expansion of our global infrastructure, strategic acquisitions, and return of capital to shareholders via share repurchases.
Alphabet continues to navigate various regulatory challenges around the world, concerning antitrust investigations, intellectual property claims, privacy, and other litigation matters. Specifically, regulatory scrutiny in areas such as advertising practices, competitive behavior, and content management may influence our future operations and financial results. We remain committed to cooperating with regulators and addressing any concerns while defending against unjustified claims.
In summary, while we operate in a rapidly evolving and highly competitive environment, we continue to focus on delivering user-centric products and services, driving advertising revenue growth, expanding our Google Cloud business, and managing our costs effectively. Our strategic investments in AI and other technologies underscore our commitment to innovation and long-term growth. We are also mindful of the regulatory landscape and the need for responsible management of our operations in the interest of all stakeholders.
Alphabet Inc., the parent powerhouse behind Google, has been navigating a complex landscape marked by shifting priorities in spending, bold moves in artificial intelligence (AI), and significant legal challenges. Amidst economic pressures, Alphabet has notably dialed back on its Diversity, Equity, and Inclusion (DEI) programs, a retreat from the fervent commitments made in 2020 following societal upheavals. According to a CNBC report by Jennifer Lifson, these initiatives have seen drastic budget cuts, raising concerns about the inclusivity of technology and product development under Alphabet's tutelage.
Simultaneously, Alphabet's strategic focus has pivoted towards investing heavily in AI technologies, positing AI as a cornerstone for future growth and tool development. This shift indicates a weighing of financial priorities, where direct contributors to the bottom line, such as AI advancements, are receiving enhanced emphasis over DEI programs. The contrast between decreasing DEI budgets and escalating AI investments underscores a critical junction where technological innovation and inclusivity could be seen as diverging paths.
In a notable legal confrontation, Alphabet faced a substantial fine by Russia over content deemed "extremist", specifically regarding LGBTQ material on its platforms, particularly YouTube. This conflict highlights the challenges Alphabet encounters in navigating global content regulation, reflecting the broader tensions between tech platforms and governmental standards on content censorship.
Financial performance and strategic reorganizations within Alphabet point to a resilient focus on growth and efficiency. Enhancements in its stock value have been attributed to positive analyst projections and strategic reconfigurations within its ad sales units, aiming to leverage AI for ad-buying processes. These maneuvers align with Alphabet's broader goals of maintaining industry leadership by integrating cutting-edge technology and optimizing operations.
In its contest for AI dominance, Alphabet has squared off against Microsoft, unveiling its AI ethos rooted in openness and extensive data capabilities. This rivalry encapsulates a broader industry race toward leveraging AI for business growth, consumer engagement, and product evolution. Alphabet's visionary strides in AI, particularly through initiatives like the unveiling of the Gemini model, signal its intent to lead in AI-driven innovations, enhancing its competitive edge.
Alphabet's valuation and investment appeal present a complex tapestry woven with AI advancements, operational efficiencies, and strategic market positioning. Despite market volatilities and external challenges, Alphabet's stock reflects a potent blend of growth potential and intrinsic value, underscored by its expansive ecosystem and strategic pivot towards AI.
The legal and regulatory framework poses a significant influence on Alphabet's operations, as seen in its engagements with Russian authorities. The fines levied for hosting "extremist" content underscore the intricate dance between adhering to national regulations and championing freedom of expression, a balance critical to Alphabet's global platform strategy.
Alphabet's DEI funding cuts draw a contentious debate about the role of major tech companies in fostering an inclusive and diverse technological ecosystem. As economic and strategic priorities shift, the technology sector's commitment to DEI initiatives remains under scrutiny, raising questions about long-term impacts on innovation inclusivity and workplace diversity.
In conclusion, Alphabet Inc.'s journey through economic recalibrations, legal encounters, and strategic pivots highlights its role as a dynamic leader in the technology sector. The company's balancing act between innovation, regulatory compliance, strategic growth, and social commitments delineates the multifaceted challenges and opportunities it faces as it continues to sculpt the digital future.
Over the period from 2019 to 2024, the volatility of Alphabet Inc. (GOOGL) can be summarized as relatively unpredictable with the ARCH model indicating no consistent pattern in stock returns. The omega value suggests a base level of variability, with a statistically significant alpha indicating that past volatility spikes somewhat influence future volatility. However, the low R-squared value shows that these effects do not consistently explain the future movements in stock returns.
| Statistic Name | Statistic Value |
|---|---|
| Dep. Variable | asset_returns |
| R-squared | 0.000 |
| Adj. R-squared | 0.001 |
| Vol Model | ARCH |
| Log-Likelihood | -2622.34 |
| AIC | 5248.68 |
| BIC | 5258.96 |
| No. Observations | 1258 |
| Df Residuals | 1258 |
| omega | 3.0509 |
| alpha[1] | 0.2613 |
To analyze the financial risk of a $10,000 investment in Alphabet Inc. over a one-year period, a two-pronged approach that combines volatility modeling with machine learning predictions has been adopted. This combination provides a nuanced understanding of the potential fluctuations in the investment value and forecasts the returns with a significant degree of accuracy.
The role of volatility modeling in this analysis is crucial for understanding the fluctuations in Alphabet Inc.'s stock price. By applying this technique, the inherent volatility of the stock, which is critical to assessing the investment risk, is quantified. This model captures the dynamic nature of volatility, considering that it fluctuates over time in response to market events. By analyzing past price movements and the frequency and magnitude of price changes, volatility modeling provides a robust framework to estimate future volatility. This is essential for calculating the Value at Risk (VaR), which is a key metric in this analysis.
On the other hand, machine learning predictions, particularly the use of a regression model, play a pivotal role in forecasting future stock returns. This model learns from the historical price data of Alphabet Inc., recognizing patterns and factors that influence future returns. By taking into account a wide array of variables and their interactions, the regression model generates predictions about future stock performance. This forward-looking capability complements the volatility analysis, giving investors insight into both the risk and return perspectives of their investment.
When combining these two approaches, the analysis yields a comprehensive view of the financial risk associated with the investment in Alphabet Inc. Specifically, the Value at Risk (VaR) at a 95% confidence interval is calculated to be $293.25 for a $10,000 investment. This metric indicates that there is a 95% chance that the investor will not lose more than $293.25 over a one-year period, under normal market conditions. The VaR figure is instrumental for investors in assessing the potential downside risk and in making informed decisions about risk management.
By integrating volatility modeling with machine learning predictions, this analysis provides a multifaceted understanding of the financial risk associated with investing in Alphabet Inc. The calculated VaR at a 95% confidence interval offers a quantifiable measure of risk, enabling investors to gauge the potential impact of market volatility on their investment. This integrated approach demonstrates the effectiveness of using sophisticated analytical methods to assess risk in equity investment, allowing for more informed and strategic investment decisions.
Similar Companies in Internet Content & Information:
Alphabet Inc. (GOOG), Report: Twilio Inc. (TWLO), Twilio Inc. (TWLO), Snap Inc. (SNAP), Baidu, Inc. (BIDU), Report: Meta Platforms, Inc. (META), Meta Platforms, Inc. (META), Pinterest, Inc. (PINS), Tencent Holdings Limited (TCEHY), Report: Amazon.com, Inc. (AMZN), Amazon.com, Inc. (AMZN), Microsoft Corporation (MSFT), Report: Apple Inc. (AAPL), Apple Inc. (AAPL), Twitter, Inc. (TWTR), Salesforce, Inc. (CRM)
https://www.fool.com/investing/2023/12/20/3-faang-stocks-30-to-53-upside-in-2024-wall-street/
https://www.fool.com/investing/2023/12/20/alphabet-just-said-checkmate-to-microsoft-but-here/
https://www.fool.com/investing/2023/12/20/why-alphabet-stock-was-climbing-today/
https://www.fool.com/investing/2023/12/20/alphabet-stock-climbed-again-today-thanks-to-ai-is/
https://www.fool.com/investing/2023/12/21/better-tech-stock-alphabet-vs-microsoft/
https://seekingalpha.com/article/4659083-the-ai-race-is-closer-than-it-seems
https://seekingalpha.com/article/4659082-alphabet-vs-microsoft-the-battle-of-the-ai-titans
https://www.cnbc.com/2023/12/22/google-meta-other-tech-giants-cut-dei-programs-in-2023.html
https://www.youtube.com/watch?v=wdk5fK0uOWU
https://www.fool.com/investing/2023/12/22/better-ai-stock-alphabet-vs-apple/
https://www.youtube.com/watch?v=U7AuYcaQffE
https://seekingalpha.com/article/4659371-google-leaps-towards-dominance-in-ai-operating-systems
https://www.fool.com/investing/2023/12/23/got-3000-3-tech-stocks-to-buy-and-hold-for-the-lon/
https://www.fool.com/investing/2023/12/24/bull-market-2-stock-split-stocks-buy-2024-new-year/
https://www.sec.gov/Archives/edgar/data/1652044/000165204423000094/goog-20230930.htm
Copyright © 2024 Tiny Computers (email@tinycomputers.io)
Report ID: UbL6WS
Cost: $1.00393
https://reports.tinycomputers.io/GOOGL/GOOGL-2024-02-03.html Home