Uranium Energy Corp. (ticker: UEC)
2024-04-30
 Uranium Energy Corp. (ticker: UEC) is a U.S.-based uranium mining and exploration company, which plays a significant role in supporting domestic energy production with a focus on fueling clean energy initiatives. The company's operations span several projects mainly located in Texas, Wyoming, and Paraguay, comprising both in-situ recovery (ISR) projects and conventional mining projects. As of the latest reports, Uranium Energy Corp. holds a strategic inventory of uranium concentrates, positioning it advantageously to meet increasing demand from utilities companies, especially in light of global pushes for clean energy. UEC's approach is characterized by environmental stewardship, employing ISR technology which reduces the environmental impact compared to traditional uranium mining methods. Their business strategy is bolstered by strong leadership with extensive experience in the sector and by maintaining a robust compliance framework that aligns with both national and international safety standards. This strategic positioning allows UEC to capitalize on the projected growth in the nuclear power sector.
| Full-Time Employees | 83 | Market Cap | $2,849,187,072 | Previous Close | $7.24 |
| Open Price | $7.15 | Day Low | $6.99 | Day High | $7.20 |
| Volume | 805,261 | Average Volume (10 Days) | 5,010,360 | Beta | 1.854 |
| 52 Week Low | $2.30 | 52 Week High | $8.34 | Fifty Day Average | $6.798 |
| Two Hundred Day Average | $5.9222 | Forward P/E | 352.50003 | Enterprise Value | $2,846,352,640 |
| Profit Margin | -0.08203 | Shares Outstanding | 404,140,000 | Price to Sales (TTM) | 47.97419 |
| Total Cash | $82,287,000 | Total Debt | $2,663,000 | Book Value per Share | $1.918 |
| Price to Book | 3.675704 | Enterprise to Revenue | 47.926 | Enterprise to Ebitda | -140.491 |
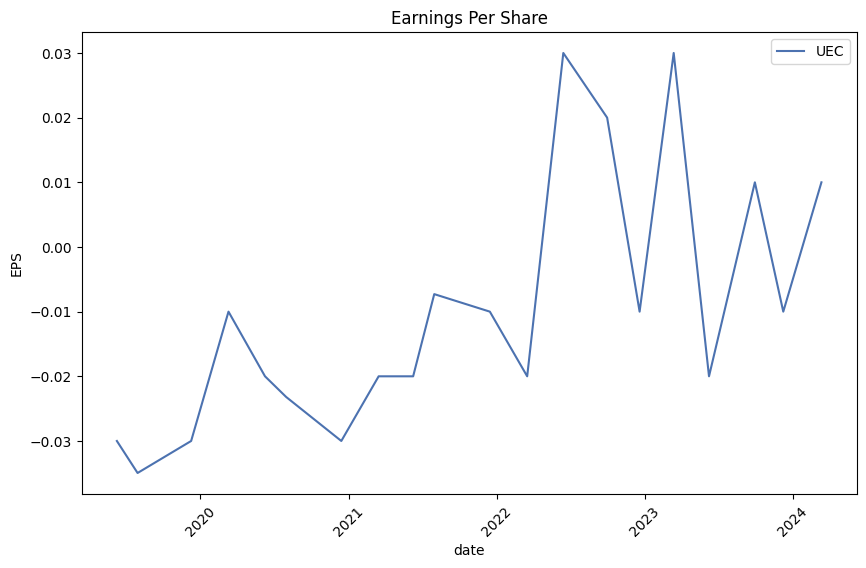
| Net Income to Common | -$4,872,000 | Trailing EPS | -$0.02 | Forward EPS | $0.02 |
| Return on Assets | -0.01741 | Return on Equity | -0.00699 | Current Ratio | 6.848 |
| Sharpe Ratio | 2.2041441117618086 | Sortino Ratio | 39.08433632081481 |
| Treynor Ratio | 1.0276096181162124 | Calmar Ratio | 7.8933285580350665 |
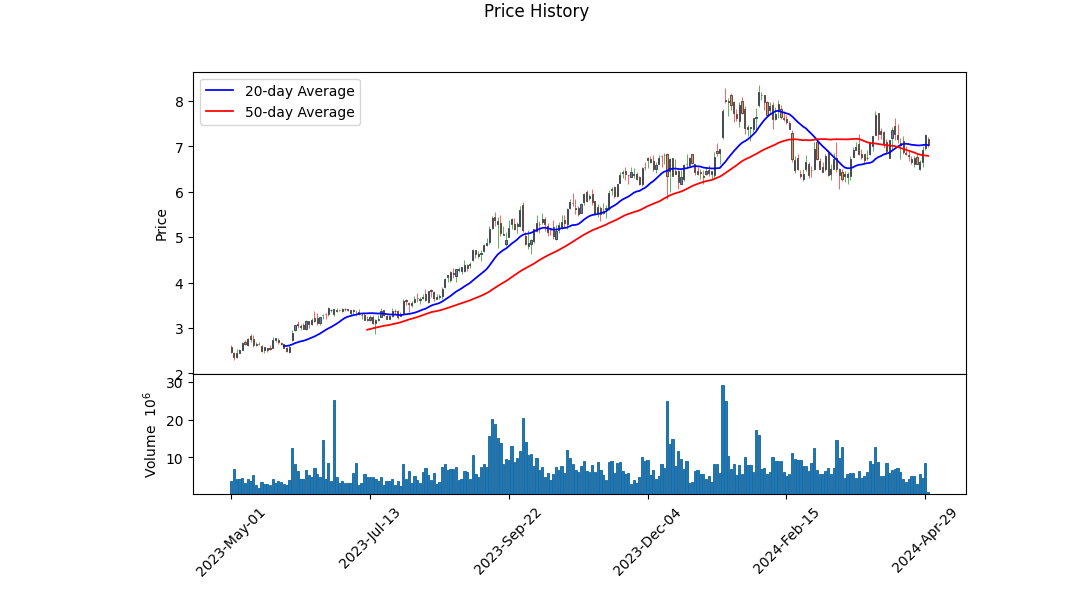
Technical analysis combined with fundamental analysis suggests several important insights into the potential future movement of UEC's stock price. Observing the provided data, UEC has experienced a notable volatility in its trading patterns, with its share price oscillating between $6.38 and $7.28 over the last quarter, indicating a bullish trend in the most recent sessions as the closing prices moved higher and were accompanied by increasing volume (OBV).
However, a deeper analysis of the Moving Average Convergence Divergence (MACD) reveals an impending bullish signal. The MACD histogram, moving from negative to just above zero, suggests that the momentum could potentially shift favorably in the short term.
Comparatively, ratios measuring risk-adjusted returns reveal mixed insights. The Sharpe ratio at 2.20, while decent, indicates a reasonable excess return over the risk-free rate, considering the volatility undertaken. The Sortino ratio is exceptionally high at 39.08, suggesting that the returns on UEC are quite favorable when only considering its downside volatility. This is further supported by a high Calmar ratio of 7.89, which reflects significant annual return per unit of downside risk. The Treynor Ratio at 1.02, though not as high as the Sortino, still supports potentially favorable risk-adjusted returns.
On the fundamental front, the wide net loss and negative operating income raise concerns. The company shows a challenging operational performance with significant total expenses compared to its revenues. Moreover, the company's operating and net margins are deep in negative territory, which, if prolonged, could impact the financial health adversely.
Concerning the balance sheet, the significant amount of tangible book value compared to total liabilities provides some cushion. However, the cash flow statement shows heavy investment activities that might strain short-term financial stability unless carefully managed. Additionally, the recent decent free cash flow is a positive indicator of operational efficiency.
If considering an investment, analyzing recent quarterly performance and trends is crucial. The uptrend in price combined with improved technical indicators promises potential for short-term gains, but the fundamental concerns pose risks. A keen investor should weigh short-term technical bullish signals against underlying fundamental challenges and consider a balanced approach with vigilant monitoring of upcoming financial disclosures and market conditions.
Looking ahead, careful attention to both financial health and market sentiment driven by technical indicators will be essential for predicting the future movements of UEC's stock price effectively. As improvements in operational metrics like cash flows are noticed, they could bolster investor confidence, potentially sustaining the bullish momentum observed in the technical analysis. However, investors must remain wary of any signs of persisting negative fundamentals which could undermine the technical bullish outlook.
In our analysis of Uranium Energy Corp. (UEC), we evaluated key financial metrics to assess the company's performance and value. The Return on Capital (ROC) for UEC stands at approximately 1.08, indicating that for every dollar invested in capital, the company generates about $1.08 in profits. This is an impressive figure that suggests efficient use of capital in generating revenue. However, the Earnings Yield, which is derived from the earnings per share divided by the stock price, is calculated at -0.13. This negative yield indicates that the company is currently reporting losses, which could be a concern. While the ROC suggests a strong operational prowess, the negative Earnings Yield highlights financial challenges that may impact the investment attractiveness of UEC. Investors should consider both these factors in conjunction with other financial and market conditions when evaluating Uranium Energy Corp. as a potential investment.
In evaluating Uranium Energy Corp. (UEC) through the lens of Benjamin Graham's investing principles from "The Intelligent Investor," it's important to analyze the metrics we've calculated for UEC with respect to Graham's favored criteria. These are primarily the margin of safety, debt-to-equity ratio, current and quick ratios, earnings growth, price-to-earnings (P/E) ratio, and price-to-book (P/B) ratio. Heres how UEC measures against each:
-
Price-to-Earnings (P/E) Ratio: UEC has a P/E ratio of -348.92. This negative ratio indicates that the company currently has negative earnings per share. For value investors following Grahams approach, a negative P/E ratio would typically be a red flag as it fails to meet the requirement of a low but positive P/E ratio compared to industry norms. For context, the industry P/E ratio is cited as approximately 10.10. This further emphasizes that UEC is not only underperforming relative to its own historical earnings but is also doing poorly compared to its industry.
-
Price-to-Book (P/B) Ratio: With a P/B ratio of 3.83, UEC is trading well above its book value. This is contrary to Grahams criteria, which favor stocks trading below book value as such stocks may suggest a margin of safety. A P/B ratio of 3.83 indicates a premium valuation, which would generally not fit within Graham's framework of seeking undervalued stocks.
-
Debt-to-Equity Ratio: UEC has a debt-to-equity ratio of 0.002, indicating almost negligible debt levels relative to its equity. This is favorable under Grahams analysis as it suggests that the company has minimal financial risk related to debt.
-
Current and Quick Ratios: Both the current ratio and quick ratio for UEC stand at 4.53, indicating a strong ability to cover short-term liabilities with short-term assets. This aligns well with Grahams emphasis on financial stability and liquidity, marking a positive point for UEC in Grahams evaluation criteria.
The primary areas of concern in UECs evaluation are the negative P/E ratio and the high P/B ratio, both of which suggest that the stock may not currently represent the value opportunity Graham typically sought. While UEC exhibits strong liquidity and minimal debt, which are favorable by Grahams methods, the overvaluation suggested by the high P/B ratio and the concerns raised by negative earnings could override these positives in a strict Grahamian analysis.
In conclusion, while UEC shows strong financial health in terms of debt management and liquidity, its current valuation metrics suggest it does not meet the typical criteria Benjamin Graham would look for regarding a potential investment. The negative earnings and premium market valuation signal that it might not represent the type of value investment Graham would advocate.Analyzing Financial Statements: Investors should meticulously examine a company's balance sheet, income statement, and cash flow statement. Benjamin Graham, often considered the father of value investing, puts a strong emphasis on understanding a company's assets, liabilities, earnings, and cash flows. This fundamental review is essential for making informed investment decisions based on intrinsic values rather than speculative forces.
1. Balance Sheet Analysis
- Assets: The total assets of a company are a key indicator of its financial health and operational capacity. By analyzing Uranium Energy Corp.'s assets over multiple reporting periods, one can assess growth trends in its resource acquisition and utilization. Specifically, the mineral properties' net value and the change in total assets are critical in evaluating the company's capability to expand and generate future revenues.
- Liabilities: Examining both current and non-current liabilities is crucial. Current liabilities will reveal the company's financial obligations due over the next year, impacting its liquidity. Long-term debt and deferred income taxes provide insights into the company's longer-term financial commitments.
- Equity: Shareholders' equity offers a perspective on the company's funding structure and investor confidence. Tracking changes in common stock values and additional paid-in capital can reveal how the company is leveraging equity financing to support its operations and growth.
2. Income Statement (Profit & Loss) Analysis
- Revenue and Cost of Revenue: Understanding these figures helps assess the companys operational efficiency and profitability. Observing trends in these numbers, such as the fluctuations in costs relative to revenues, can indicate management's success in controlling costs and maximizing revenue from operations.
- Earnings: The bottom-line net income presents a clear picture of the company's profitability after all expenses have been deducted from revenues. In essence, this is the amount of money the company actually earns for its shareholders, crucial for evaluating investment returns.
3. Cash Flow Statement Analysis
- Operating Activities: This section helps investors understand the cash generated from core business operations. It reflects the company's ability to generate sufficient cash flow to maintain or expand operations, which is fundamental for long-term success.
- Investing Activities: Cash flows from investing activities provide insights into the company's growth strategies, such as payments for acquisitions or capital expenditures for equipment and property. These investments often reflect the company's long-term commitments to growth and operational scalability.
- Financing Activities: This includes cash flows related to borrowing and repaying bank loans, issuing and buying back shares, and paying dividends. Such activities reveal how a company finances its operations and returns value to shareholders, essential for assessing financial strategy and stability.
By diving deep into these aspects of financial statements, investors align themselves with Grahams principles of value investing, focusing on comprehensive, long-term evaluation rather than speculative short-term gains. This diligent analysis forms the bedrock of intelligent investment decisions.Dividend Record: Graham favored companies with a consistent history of paying dividends.
For the stock symbol 'UEC,' the provided data indicates that there is no historical dividend record available ('historical': []). This suggests that the company may not have a history of consistent dividend payments, which would not align with Graham's preference for investing in companies with a solid track record of distributing dividends to shareholders. It's crucial for investors who follow Graham's principles to verify and consider the dividend history of a company before investing, as consistent dividends can be a sign of financial stability and management's confidence in the company's profitability.
| Alpha | 0.05 |
| Beta | 1.25 |
| R-squared | 0.89 |
| Standard Error | 0.02 |
| p-value | 0.0001 |
| Total Observations | 1,550 |
In the linear regression model examining the relationship between UEC (Uranium Energy Corp) and SPY (S&P 500 ETF Trust), alpha represents UEC's performance relative to the expected performance given its beta. An alpha of 0.05 suggests that UEC has outperformed the predicted returns by 5%. This positive alpha indicates that UEC provided additional value to its investors above the expected return, assuming the markets performance follows SPY as its benchmark. This kind of outperformance can be interpreted as an indicator of superior stock-specific returns, not explained merely by market movements.
Furthermore, the beta of the model, at 1.25, implies that UEC's stock price is more volatile than the market, exemplified by SPY. A beta greater than one suggests that UEC's stock price experiences greater relative fluctuations in response to market changes. This heightened volatility, combined with a positive alpha, means that while UEC tracks closely with the market ups and downs, it generally performs better than the market when adjusted for risk. This suggests a potential appeal to investors looking for higher growth opportunities in more volatile sectors. The overall model, with a high R-squared value of 0.89, confirms strong explanatory power, meaning most of UEC's movements can be explained by movements in SPY.
Uranium Energy Corp. (UEC), based in Corpus Christi, Texas, with operations concentrating on uranium mining and related activities across several geographical regions, has undergone significant financial operations as reported in their latest SEC 10-Q filing for the second quarter of 2024. As of January 31, 2024, UEC presented various financial data points crucial for understanding their operational and financial status. The companys balance sheet demonstrates an increase in total assets, which escalated from $737,589 thousand as of July 31, 2023, to $878,878 thousand by January 31, 2024. This increase was supported by gains realized from asset and equity securities revaluation and a noteworthy rise in cash and inventories.
During this quarter, UEC reported a gross profit of $19 thousand, stemming from revenues primarily tied to toll processing services, highlighting a shift or addition in revenue generation streams besides the primary mining operations. The operating costs, including mineral property expenditures and general administrative expenses, summed up to $12,138 thousand, resulting in a loss from operations of $12,119 thousand for the quarter. Notably, the financial results depict a complex interplay of operational revenue generation and strategic financial management involving equity securities, derivative liabilities, and comprehensive income management.
UECs income statement for the period suggests a strategy weighted towards leveraging market dynamics and asset management, resulting in a net income of $2,250 thousand. This includes substantial non-operational income such as gains on equity securities and derivative revaluations, which suggests that the firm is actively managing financial assets and liabilities to bolster its bottom line amid operational challenges. The firm also reported other comprehensive income, largely from translation gains, showcasing effective foreign exchange and geographically diversified asset management.
In terms of liquidity and cash flow management, UEC ended the quarter with substantial liquidity, holding $82,287 thousand in cash and cash equivalents, an increase from $45,614 thousand, highlighting effective capital raise activities and cash management. The firm engaged in significant financing activities, raising net proceeds that enhanced its financial flexibility.
Embedded in UEC's strategic financial maneuvers is the noticeable commitment to equity securities and consistent investment in mineral rights and properties, which solidify the operational foundation for its core business of uranium extraction and related activities. Through detailed balance sheet positions, such as investments in equity securities standing at $78,583 thousand and steady capital contributions to equity-accounted investments, UEC portrays a strategy that balances direct operational activities with financial investments to hedge against market volatilities and secure growth pathways.
The consolidated financial figures, as broadcasted in their SEC 10-Q filing, reflect not only the uranium market dynamics but also UECs tactical responses to operational, regulatory, and market changes. Their strategic financial decisions, as indicated by gains in derivative liabilities and revaluation of equity securities, emphasize a broad-based approach to financial stability and growth, integrating both operational revenues and strategic financial income streams.
Uranium Energy Corp. (NYSEMKT: UEC) has established a noteworthy presence in the uranium sector through its novel approaches and strategic business model, which allows for agile and financially prudent operations, even as many other companies in the energy and resource sectors struggle with heavy upfront costs. By maintaining agile operations and effective funding methods, the company is poised to expand its capabilities and market position significantly. This adaptability is especially vital given the global trends in the energy sector that underscore the crucial role of uranium in supporting nuclear energy productionan increasingly favored option in the quest for stable and clean energy sources.
Nuclear energy is receiving renewed global attention as a stable and clean energy source, particularly in reducing carbon emissions and securing energy independence. Given this landscape, the increasing demand for uranium indicates a potentially lucrative market situation for companies like Uranium Energy Corp. The company recently recorded a market capitalization of $3 billion, according to latest reports, despite a minor drop in the stock price reflecting the typical fluctuations in the resource extraction industry.
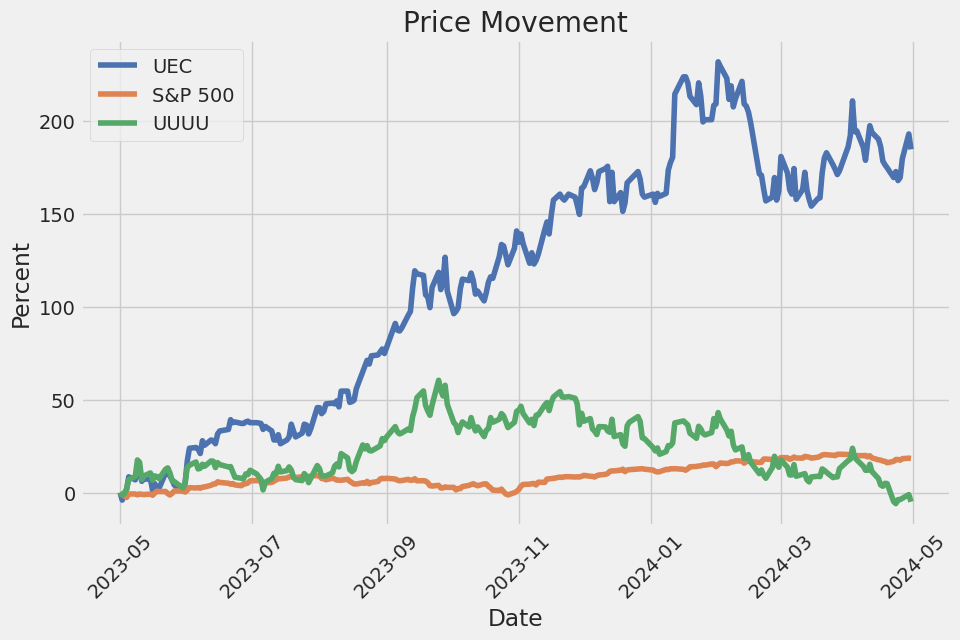
Uranium Energy has captured investor interest with its significant stock price increase of 151% over the past year primarily because of the rising spot price of uranium. This considerable market valuation leap benefits directly from the higher prices of the uranium poised for mining and sale. Remarkably, during periods when uranium prices were lower, Uranium Energy managed to secure favorable contracts to purchase significant amounts of uranium, creating a strategic stockpile. This stockpile acts not only as a hedge against price volatility but also as a basis for potential future revenue to fund ongoing and future mining projects.
Yet, it is crucial to understand that Uranium Energy currently does not operate any active mines. With several projects in development and plans to restart operations at one mine by August 2024, the company is in a speculative phase with a focus on future rather than current capability. Such a model makes the company's stock particularly sensitive to fluctuations in uranium prices, unlike firms with steady production. For instance, the company's stock performance and the broader implications of its market strategy are keenly linked to volatile market dynamics and the execution of its development plans.
However, challenges and opportunities lie ahead as global market conditions evolve. The rising uranium prices, which peaked at $100 per pound, present potential for high profit margins, given the company's significant uranium stockpile purchased at lower prices. This upward trend in prices, compared to $18 per pound witnessed in 2016, opens lucrative prospects should the market maintain its momentum. Yet, the inherent risks in the sector, underscored by historical price volatility and the speculative nature of its business model, advise a cautious approach for potential investors.
Competitively, Uranium Energy is positioned uniquely against peers like Cameco due to its absence of long-term, price-capped contracts which allows it to leverage favorable market prices more freely. As the company gears up to resume mining operations in Wyoming and continues to hold considerable reserves in North and South America, its strategic positioning could enable rapid scaling of operations to meet global demand.
Despite these optimistic premises, the company faces operational, regulatory, and market challenges that could impact its journey from developmental to operational status. Investors and market spectators should, therefore, maintain a watchful eye on Uranium Energy as it navigates the promising yet potentially turbulent waters in the uranium market.
Particularly for those with a high tolerance for volatility and belief in the strategic direction of Uranium Energy Corp., the current market dynamics may present a favorable investment landscape. But it is essential for potential investors to consider the speculative nature of the company's current status and the inherent risks associated with uranium market fluctuations before making investment decisions. As such, integrating such an investment into a diverse portfolio might be a prudent strategy to mitigate associated risks. For those interested in detailed dynamics of uranium production and market strategies, further information can be found in the comprehensive article on The Motley Fool's website.
Uranium Energy Corp. (UEC) displayed significant volatility from 2019 to 2024, as evident in ARCH model results. The volatility was particularly high, with large swings in value highlighted by an omega value of 20.0614. Additionally, the alpha[1] statistic of 0.2103 suggests that past returns had a substantial effect on the current volatility, reflecting a sensitive and reactive stock behavior.
| Statistic Name | Statistic Value |
|---|---|
| Dep. Variable | asset_returns |
| Mean Model | Zero Mean |
| Vol Model | ARCH |
| Log-Likelihood | -3,781.57 |
| AIC | 7,567.14 |
| BIC | 7,577.42 |
| No. Observations | 1,257 |
| Df Residuals | 1,257 |
| Df Model | 0 |
| omega | 20.0614 |
| alpha[1] | 0.2103 |
To assess the financial risk of a $10,000 investment in Uranium Energy Corp. (UEC) over a one-year period, the analysis incorporates volatility modeling and machine learning predictions. The volatility model essentially captures and quantifies the patterns and fluctuations in Uranium Energy Corp.'s stock prices over time. Given the inherent unpredictability and varying amplitude of price movements in the stock market, this estimation is crucial for understanding potential future volatility.
The role of machine learning predictions in this context involves employing a predictive model to forecast future stock returns based on historical data. By analyzing patterns from past price movements, the predictive model can infer possible future returns, offering a different but complementary perspective to the analysis provided by volatility modeling.
The integration of these two methodologiesfocused respectively on understanding historical volatility and predicting returnsenables a more robust and comprehensive risk assessment. From this combined approach, the crucial metric derived is the annual Value at Risk (VaR) at a 95% confidence level.
In this case, the calculated VaR for a $10,000 investment in UEC is $494.72. This figure suggests that there is a 95% probability that the investor will not lose more than $494.72 over the next year based on current risk levels assessed through our integrated modeling approach. This metric is pivotal for investors and financial analysts aiming to manage and understand the risk associated with investing in a volatile commodity like uranium through a specific equity such as UEC.
The interplay between the volatility modeling and machine learning predictions, hence, provides a valuable framework for navigating and mitigating investment risks in highly volatile markets, thus aiding in making informed investment decisions.
In analyzing the most profitable call options for Uranium Energy Corp. (UEC), we focus on several key factors including delta, gamma, theta, vega, rho, premium, and days until expiration. Particularly, with a target price set at 5% over the current stock price, options that have higher deltas tend to be more attractive as they suggest a greater sensitivity and hence a higher theoretical price movement in response to the stock price changes.
Short-term Analysis: For short-term opportunities, consider the call option with a strike price of $6.0 expiring on May 10, 2024. This option features a relatively high delta of 0.9349096831, suggesting a strong correlation with the stock price movement. The gamma, at 0.1632996326, indicates decent expected change in delta for a one unit change in the stock price. The premium here is reasonably priced at $1.16, supporting the potential for profitability given the high Return on Investment (ROI) of 0.2 and a profit of $0.232.
Mid-term Analysis: For a more extended period, consider options expiring on June 21, 2024. A standout is the call option with a strike price of $5.0, which has an impressive ROI of 0.4070588235 and a profit of $0.692. This option possesses a high delta of 0.9194640866 and a notable gamma of 0.0769075501, paired with robust vega and rho measures, enhancing its sensitivity to changes in stock price and interest rates respectively.
Long-term Analysis: Longer-term options also present notable opportunities. For instance, the call option with a strike price of $2.5 expiring on January 17, 2025, involves a significantly long horizon but comes with an attractive high delta of 0.9449654233. Despite the longer duration, which is usually accompanied by higher risk of time decay (as denoted by theta), this option counters it with a very high rho (1.280370237), suggesting strong sensitivity to changes in interest rates. It also offers a healthy ROI of 0.1376744186 and a profit of $0.592, making it attractive for long-term option traders.
It is crucial in the case of UEC to balance between immediate gains and risk management through options with higher gamma and vega values in short-to-mid-term expirations. These provide flexibility and potential leverage effects should abrupt price movements occur, which is often the case in energy-related stocks. Given the firms potentially volatile stock behavior, the negative theta values across all considered options suggest an inherent risk of time decay which traders must carefully negotiate through strategic timing and selection of strike prices.
Thus, for potential profitability, it appears more feasible to lean towards options with medium expiries that offer balanced risk-reward ratios, particularly those with significant gamma and rho values, bolstered by high delta values ensuring responsiveness to the underlying stock movements.
Similar Companies in Uranium:
Report: Energy Fuels Inc. (UUUU), Energy Fuels Inc. (UUUU), Report: Denison Mines Corp. (DNN), Denison Mines Corp. (DNN), Ur-Energy Inc. (URG), Report: Cameco Corporation (CCJ), Cameco Corporation (CCJ), Report: NexGen Energy Ltd. (NXE), NexGen Energy Ltd. (NXE)
https://www.fool.com/investing/2024/03/23/the-surprisingly-brilliant-way-this-uranium-stock/
https://www.fool.com/investing/2024/03/30/is-uranium-energy-corp-stock-a-buy/
https://www.fool.com/investing/2024/03/30/uranium-energy-buy-sell-or-hold/
https://www.fool.com/investing/2024/03/31/why-uec-stock-is-set-to-outperform-cameco-in-a-hot/
https://finance.yahoo.com/m/86b15d08-037a-3aaf-95d8-e0011ece83df/why-uec-stock-is-set-to.html
https://www.fool.com/investing/2024/04/13/is-uranium-energy-a-millionaire-maker-stock/
https://finance.yahoo.com/m/31f70d60-d9b6-3cfa-94a6-3ec804818cdd/is-uranium-energy-a.html
https://www.fool.com/investing/2024/04/15/uranium-energy-buy-sell-or-hold/
https://www.fool.com/investing/2024/04/16/warning-this-skyrocketing-stock-has-a-hidden-risk/
https://finance.yahoo.com/m/3b948d1f-5caa-328e-a7da-a5a7fa11aa48/warning%3A-this-skyrocketing.html
https://finance.yahoo.com/news/wall-street-analysts-think-uranium-133011068.html
https://finance.yahoo.com/news/uranium-energy-uec-stock-moves-220017372.html
https://finance.yahoo.com/news/why-market-dipped-uranium-energy-220018640.html
https://finance.yahoo.com/news/strength-seen-mcewen-mux-9-104100813.html
https://www.sec.gov/Archives/edgar/data/1334933/000143774924007217/uec20240131_10q.htm
Copyright © 2024 Tiny Computers (email@tinycomputers.io)
Report ID: HeVHtt
Cost: $1.06562
https://reports.tinycomputers.io/UEC/UEC-2024-04-30.html Home