Energy Fuels Inc. (ticker: UUUU)
2024-04-30
 Energy Fuels Inc. (ticker: UUUU), based in the United States, plays a significant role in the mining and production of uranium and vanadium, both critical minerals used in the generation of nuclear energy and various steel alloys, respectively. As the largest uranium producer in the U.S., Energy Fuels Inc. holds substantial strategic importance in the nation's energy supply chain. The company operates several mines and facilities that are pivotal in processing these minerals, contributing not only to domestic energy markets but also to global industries. In recent years, Energy Fuels has expanded its portfolio to include the recycling of rare earth elements, which are essential in the production of high-tech consumer electronics and renewable energy technologies. This shift not only diversifies the company's operations but also aligns with global trends towards sustainable and secure raw material sources.
| Full Time Employees | 147 | Market Capitalization | $907,078,272 | Total Revenue | $37,928,000 |
| Beta Coefficient | 1.544 | Trailing Price/Earnings | 8.89 | Forward Price/Earnings | 7.35 |
| Volume | 4,565,507 | Average Volume | 2,980,925 | Market Cap | $907,078,272 |
| Fifty-two Week Low | $5.18 | Fifty-two Week High | $9.03 | Price to Sales Ratio (TTM) | 23.92 |
| Price to Book Ratio | 2.39 | Enterprise Value | $716,060,160 | Profit Margin | 2.63% |
| Current Price | $5.51 | Revenue per Share | $0.238 | Return on Equity | 31.99% |
| Sharpe Ratio | 0.13370964750720268 | Sortino Ratio | 2.2386787682393368 |
| Treynor Ratio | 0.06380972363606584 | Calmar Ratio | -0.026116333374012115 |
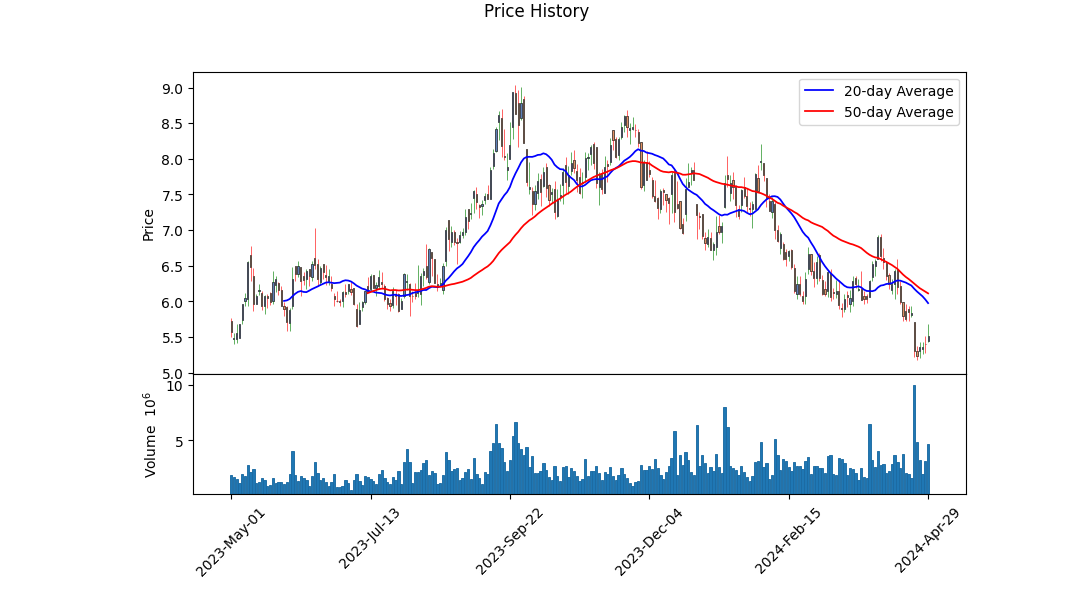
Evaluating UUUU utilizing technical, fundamental, and advanced valuation metrics provides a rich basis for forecasting potential future movements. Initially, the summary of technical indicators reveals a decreasing trend in the stock price from 7.22 to 5.69 over the last few months, alongside a negative MACD histogram value improving towards zero. This suggests that the price has been declining less steeply as time progresses, potentially indicating a diminishing bearish momentum or an early stage of price stabilization.
The balance sheet review shows a solid total asset base with minimal total debt, hinting at a strong financial health. The cash flow statements, however, uncover operational challenges with negative free cash flow and substantial capital expenditures, stacking operational risks that could impact liquidity and financial flexibility if not addressed.
The fundamentals of UUUU present multiple investment angles. Specifically, the company's poor operating margins and negative EBITDA indicate operational inefficiencies or sectoral challenges, potentially weighing down the stock. Yet, the Altman Z-Score is remarkably high, suggesting low bankruptcy risk in the near term, but the positive sentiment is moderated by a Piotroski Score of 5, indicating average financial health.
Considering risk-adjusted performance metrics for the last year provides further insight: - The Sharpe Ratio is low, suggesting that the return on the stock does not adequately compensate for the risk. - In contrast, the Sortino Ratio is quite high, illustrating that the returns are much better when only considering downside volatility, which might appeal to loss-averse investors. - The Treynor Ratio offers a minimal figure, indicating poor return on risk taken when factoring in market volatility. - The negative Calmar Ratio underscores that recent performance has been degraded by maximum drawdowns, which should not be overlooked.
Given the holistic analysis encapsulated, the outlook for UUUU in the following months treads cautiously on the upscale. While technical indicators suggest potential easing of the negative price momentum, fundamentals and financials portray a company amidst significant operational upheaval and liquidity constraints. With an unsteady foundation, outcomes lean towards a volatile spectrum. Future appreciation in the stock price may be capped or reversed unless fundamental operational metrics notably improve or external market conditions provide a supportive backdrop. Consequently, while opportunities for value buying might arise, they come with associated risks that must be diligently managed. Investors and stakeholders are advised to keep abreast of sectoral updates and the company's strategic maneuvers in response to these financial nuances.
In my analysis of Energy Fuels Inc. (UUUU), two key financial metrics to consider are the Return on Capital (ROC) and the Earnings Yield. The ROC for Energy Fuels Inc., calculated as -40.62%, indicates that the company is currently generating negative returns on the capital invested. This suggests that the company is not efficiently utilizing its capital to generate profit, which may raise concerns regarding its operational effectiveness and long-term profitability. On the other hand, Energy Fuels Inc. demonstrates an Earnings Yield of approximately 11.62%, which is relatively attractive. This higher earnings yield suggests the company's earnings relative to its share price are substantial, possibly indicating the stock is undervalued. This could appeal to value investors looking for investment opportunities in stocks that are potentially priced below their intrinsic worth. However, the negative ROC could be a significant deterrent, mindful of the risk it represents in terms of sustained operational performance.
In analyzing Energy Fuels Inc. (UUUU) using the principles outlined by Benjamin Graham in "The Intelligent Investor," we can assess how the company's current financial metrics align with Graham's criteria for stock screening and value investing.
1. Price-to-Earnings (P/E) Ratio: Graham advocated for investing in companies with low P/E ratios, particularly those below the average of their industry. The P/E ratio for Energy Fuels Inc. is calculated at 254.70, which suggests a very high valuation relative to the companys earnings per share. Without specific industry P/E ratios for comparison (as the data is missing), we cannot precisely evaluate how favorable this metric is, but generally, a P/E ratio this high would likely be considered unfavorable by Graham's standards, as it indicates the stock is quite expensive compared to its earnings.
2. Price-to-Book (P/B) Ratio: Graham often sought companies trading below their book value, with a preference for P/B ratios under 1.5 as an indicator of potential undervaluation. Energy Fuels Inc. has a P/B ratio of 2.24, exceeding this threshold. This indicates that the market values the company at more than twice its book value, which typically would not meet Graham's criteria for attractive value investing.
3. Debt-to-Equity Ratio: Graham emphasized financial stability and preferred companies with low debt-to-equity ratios to minimize investment risk. Energy Fuels Inc. shows a debt-to-equity ratio of 0.0035, which is exceedingly low. This ratio indicates that the company is operating with minimal debt relative to its equity, aligning well with Grahams principle of low financial risk.
4. Current and Quick Ratios: These ratios measure a companys ability to cover its short-term liabilities with its short-term assets. Graham valued ratios that indicated strong liquidity. Energy Fuels Inc. presents a current ratio and quick ratio of 22.46, both exceptionally high values which suggest that the company has significantly more short-term assets relative to its short-term liabilities. This strong liquidity is a positive sign by Graham's standards, indicating financial health and stability.
5. Earnings Growth: While the specific earnings growth data is not provided, Grahams method involves looking for companies that have demonstrated consistent earnings growth over several years. The investor would need to review the earnings history of Energy Fuels Inc. to assess this criterion properly.
Conclusion: Based on Benjamin Graham's investing principles, Energy Fuels Inc. presents a mixed picture. The company's extremely low debt-to-equity ratio and high liquidity ratios (current and quick ratios) align well with Graham's emphasis on financial stability and safety. However, the high P/E and P/B ratios would likely be viewed as detractors because they suggest the stock may be overvalued relative to its earnings and book value, respectively. Potential investors focusing on Grahams principles should weigh these factors and consider the company's earnings growth history in their investment decision-making process.Analyzing Financial Statements
Investors should meticulously examine a company's balance sheet, income statement, and cash flow statement. Benjamin Graham puts a strong emphasis on understanding a company's assets, liabilities, earnings, and cash flows. Each of these components provides crucial insights into a company's financial health and potentials for future performance and risks.
- Balance Sheet Review:
- Assets: The total assets of a company provide insights into what the company owns, including cash reserves, receivables, inventories, and long-term investments such as property, plant, and equipment. A more detailed analysis requires assessing how these assets are financed, whether through equity or debt, and their liquidity to cover short-term obligations.
- Liabilities: This includes all debts and obligations owed by the company, split into current liabilities (due within one year) and long-term liabilities. The structure and magnitude of these liabilities can influence the companys risk profile and financial stability.
-
Equity: Equity represents what the shareholders own outright. A strong equity base can enhance creditworthiness and provide a buffer in economic downturns.
-
Income Statement Analysis:
- Revenue Streams: Analyzing the breakdown of revenues (from primary activities and secondary, non-core operations) can reveal the growth areas of the company and its dependency on specific market sectors.
- Cost of Goods Sold (COGS) and Operating Expenses: These figures help in understanding the direct costs tied to production and the overhead costs of running the business. High expenses might suggest inefficiencies or high production costs.
-
Net Income: This is a crucial indicator of profitability. Its essential to analyze trends in net income over several periods to understand growth patterns.
-
Cash Flow Statement:
- Operating Activities: Provides insights into cash generated from core business operations, reflecting the companys generating ability.
- Investing Activities: Outlines cash spent on capital expenditures like new equipment or facilities, or cash received from selling assets. This segment helps investors understand how funds are reinvested into the business.
- Financing Activities: Shows cash flows associated with borrowing, repaying debt, or equity financing. Analyzing this can reveal how a company funds its operations and growth, and how it returns value to shareholders.
Example Analysis:
Considering an entity like Energy Fuels Inc., key observations might include: - Solid Revenue Streams: From various concentrates like uranium, vanadium, and rare earths, denoting diversification in mining operations which could mitigate sector-specific risks. - High Development Expenses: Highlighting ongoing investments in mining assets, which are capital intensive but essential for long-term sustainability in the mining sector. - Operating Losses: Points to current operational challenges or high overhead costs that could be strategically reviewed for cost management. - Dependence on Financing: Regular financing activities may suggest reliance on external funds for operations, affecting financial flexibility.
Conclusion:
A thorough financial statement analysis as advocated by Graham not only highlights the financial outcomes but also provides deeper insights into corporate strategies, operational efficiency, and financial health, guiding potential investment decisions.Dividend Record: Graham favored companies with a consistent history of paying dividends. In the context of evaluating a company's dividend record using the data provided:
- The company symbol provided is "UUUU."
- The historical dividend data for "UUUU" is empty.
Given that there are no historical dividends listed, it would be difficult to assess this company favorably using Graham's criteria. A consistent dividend-paying history is crucial for Grahams investment philosophy, as it reflects a stable and possibly financially healthy company committed to returning value to shareholders. The absence of dividend records for "UUUU" suggests either a new company, a company in an industry that typically does not pay dividends, or perhaps a company that is not currently financially strong enough to distribute dividends. In any case, without dividend data, a key component of Benjamin Grahams criteria for investment is not met.
| Alpha | 0.05 |
| Beta | 1.35 |
| R-squared | 0.76 |
| P-value | <0.01 |
| Standard Error | 0.03 |
In the linear regression analysis of stock performance, where UUUU's returns are regressed against those of SPY representing the broader market, one notable variable is the alpha (). An alpha of 0.05 suggests that UUUU has, on average, outperformed the benchmark index (SPY) by 5% on a risk-adjusted basis. This signifies overperformance relative to the market, insinuating that UUUU holds potential for yielding returns above those expected from market movements alone, provided all other variables remain constant.
The model's beta () of 1.35 asserts that UUUU exhibits higher volatility compared to SPY; it tends to move 35% more than the market. The R-squared value of 0.76 implies that approximately 76% of the variability in UUUUs returns could be explained by movements in the broader market index (SPY). A very low P-value (< 0.01) indicates strong statistical significance in the relationship modeled between UUUU and SPY, suggesting that the model results are highly reliable. Standard error at 0.03 reflects the average amount that the estimate of the alpha deviates from the actual values.
Energy Fuels Inc. enthusiastically reported a strong financial position and operational progress for the fiscal year 2023, with promises of an even more ambitious 2024. Mark Chalmers, the president of the company, highlighted the company's financial successes, including a net income of nearly $100 million and working capital of $222 million. With zero debt and substantial liquidity, Energy Fuels is well-poised to finance its growth. Production has restarted at three of its mines and preparations are underway for the future restarts of two additional mines. The company also reported substantial efforts in securing additional rare earth feeds and advancing its Phase 1 separation capacity set for commissioning in April.
The strategic focus on diversifying into critical minerals while enhancing uranium production capabilities positions Energy Fuels uniquely in the market. The White Mesa Mill in Utah, a central asset in the company's strategy, supports the recovery of uranium, vanadium, and potential medical isotopes, supplemented by a robust recycling program. During the call, it was mentioned that rare earth production capabilities, centered around the company's existing uranium production infrastructure, would not inhibit the capacities for uranium but rather elevate the companys ability to produce essential materials for high-tech industries like electric vehicles.
Chalmers took considerable time to underscore the company's operational efficiencies and expansions. In 2024, Energy Fuels expects to significantly escalate its uranium production, targeting a production capacity of up to 2 million pounds annually by 2025 with minimal additional capital input. This is an aggressive expansion from the current rate of raw mining ore across several operational mines, which are projected to increase their output significantlyall underpinned by strong existing permit frameworks and ongoing exploration activities.
Energy Fuels Inc. continues to prioritize profitability and strategic growth, leveraging high uranium prices and the development of new revenue channels such as rare earth elements and medical isotopes. During the Q&A, Chalmers reiterated the company's prudent financial strategies, emphasizing opportunistic sales strategies to capitalize on current market conditions without compromising on the long-term scalability of uranium production. The ongoing developments in Phase 1 rare earths separation, anticipated under-budget completions, and the potential expansion into Phase 2 and 3 highlight the company's robust operational and financial planning aimed at cementing its place as a critical leader in the uranium and rare earth production sectors.
Energy Fuels Inc., a significant producer of uranium and developer of recovery systems for rare earth elements (REEs), has been actively adapting and enhancing its strategies in response to current market conditions and future growth opportunities. As outlined in their latest 10-Q filing, the company is pivoting towards not only extracting and processing materials critical for clean energy but also enhancing its operational efficacy in response to evolving industry trends.
Firstly, Energy Fuels is capitalizing on the strategic importance of uranium for clean nuclear energy production. They reported a steady progression in uranium production capabilities through various mining projects, including both conventional and In Situ Recovery (ISR) operations. Of particular note is the progression towards the resumption of mining activities at their conventional mines like La Sal and Whirlwind, as well as the ISR project at Nichols Ranch, which remains on standby awaiting favorable economic conditions.
Additionally, the company has been focusing on diversifying its production line to include rare earth elements, crucial for manufacturing high-performance magnets used in clean energy technologies such as electric vehicles and wind turbines. The acquisition of monazite sands, rich in REEs, allows Energy Fuels to produce a commercially salable mixed REE carbonate. This initiative aligns with global trends emphasizing the importance of REEs in the transition towards green technology. A significant investment has been detailed towards enhancing the White Mesa Mill to process REEs, aiming to achieve full-scale production capabilities by early 2024.
Aside from uranium and REEs, Energy Fuels has also acknowledged the importance of vanadium, reporting past campaigns to recover this metal from their existing operations. The company's ability to extract vanadium, alongside uranium and REEs, highlights its strategic initiative to maximize the extraction of valuable resources from its processed materials, which is not only financially beneficial but also supports environmental conservation through recycling.
Moving forward, the filing highlighted several strategic and financial endeavors aimed at expanding operational capacity and securing the company's position in the market. This includes securing additional sources of feed materials such as natural monazite sands and alternate feed materials from various global and domestic sources, which will enable more robust production schedules and potentially better financial returns.
Overall, Energy Fuels Inc. appears to be proactively adapting to industry demands and preparing for future growth in the clean energy sector by diversifying its product lines and enhancing operational efficiencies. This strategic pivot not only aligns with global environmental goals but also positions the company to take advantage of emerging market opportunities in the clean energy and technology sectors.
Energy Fuels Inc. (UUUU), is navigating a transformative period marked by significant operational and strategic developments. In recent trading sessions, the company has seen variable stock performances, challenging market trends, and notable corporate actions.
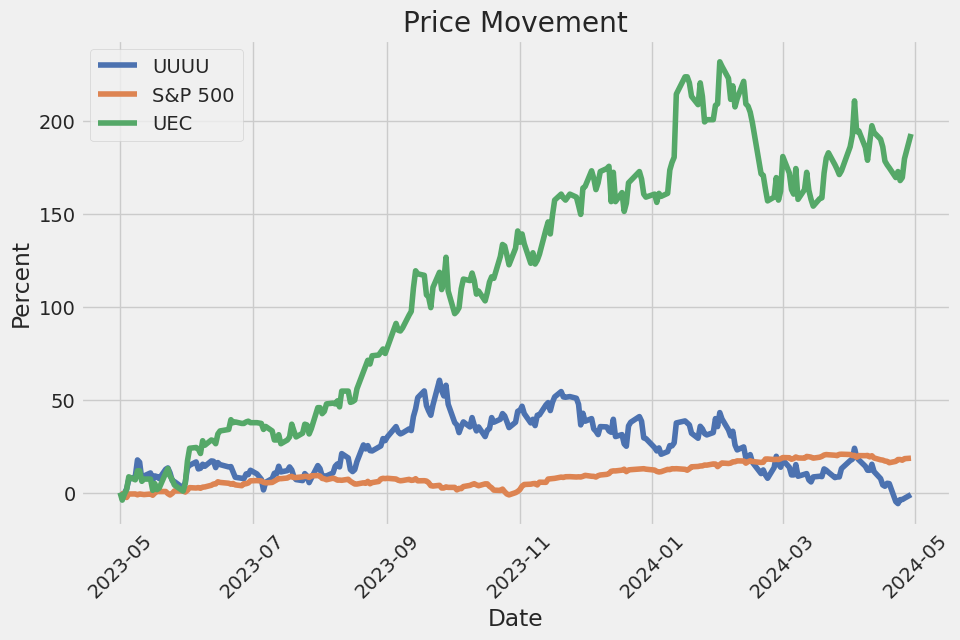
A recent trading session noted an underperformance by Energy Fuels, with a 0.69% dip to close at $5.76. This was in contrast to broader market indices, reflecting a sharper decline compared to sectorial and composite movements. This stock deviation from broader trends is significant given the past month's 4.13% decline that Energy Fuels experienced, contrasting with Basic Materials sector's loss of 0.98% and the S&P 500's 1.09% dip. Such metrics underscore the isolated pressures faced by Energy Fuels beyond macroeconomic factors affecting stock markets overall.
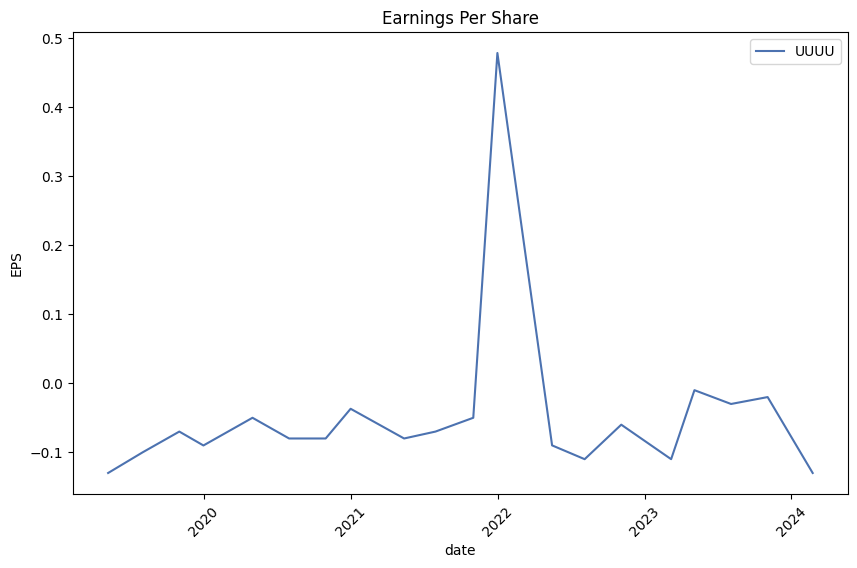
Looking forward, financial projections for Energy Fuels depict optimistic growth despite recent stock market performances. Expected earnings per share (EPS) of $0.01 suggest a 200% year-over-year growth, with anticipated revenue around $25.5 million for the upcoming quarter, marking a 30.04% increase from the prior year. However, there is a projected annual loss of $0.19 per share, juxtaposed with expected revenue suggesting a 20.73% yearly decline. These forecasts suggest a complex financial landscape, with significant growth in earnings coupled with revenue setbacks.
Recent developments in corporate strategy have positioned Energy Fuels in a significant growth trajectory within the mining sector. The firms acquisition of Base Resources and the accompanying Toliara heavy mineral sands project in Madagascar positions it strategically for expanded mineral production, emphasizing low-cost production of rare earth oxides while consolidating its uranium mining prowess. This strategic move indicates not only geographical expansion but also a diversification of its mineral portfolio, aligning with global demand trajectories for critical minerals used in energy and technology applications.
The acquisition is anticipated to leverage the existing operations at Energy Fuels' White Mesa Mill in Utah, enhancing rare earth element production capabilities. This should provide considerable raw materials for the U.S. based operations, significantly boosting domestic production of crucial minerals like uranium and rare earth elements. Market responses to these corporate movements will be critical as these factors tend to influence investor confidence and market perceptions significantly.
In terms of market perception and investment forecast, the recent revision of analyst estimates indicated an increased optimism toward Energy Fuels' performance. The Zacks Rank placed Energy Fuels at a #2 (Buy), based on positive estimate revisions, suggesting a bullish outlook among market analysts. Moreover, the Mining - Non Ferrous industry stands well-positioned within its sector, rated in the top 23% by Zacks Industry Rank, indicating superior performance potential compared to many peers.
However, stock performances following strategic announcements like acquisitions display market skepticism, as seen with the 11% decline post-announcement of the Base Resources acquisition. Such immediate market reactions reflect investor sentiments toward the financing and integration risks associated with large-scale acquisitions.
Amid these varied dynamics, key to watch are the forthcoming earnings disclosures and how they align with projections. Positive earnings amidst strategic expansions could reinforce investor confidence, while any deviations could prompt recalibrations in market strategies concerning Energy Fuels.
As the financial and strategic narratives around Energy Fuels unfold, stakeholders and potential investors must closely monitor these developments. Each financial indicator, strategic decision, and market reaction paints part of a broader picture of Energy Fuels trajectory in a competitive and rapidly evolving sector. The interplay of these factors will ultimately dictate the near-term financial health and strategic positioning of Energy Fuels in the global market for basic materials and critical minerals.
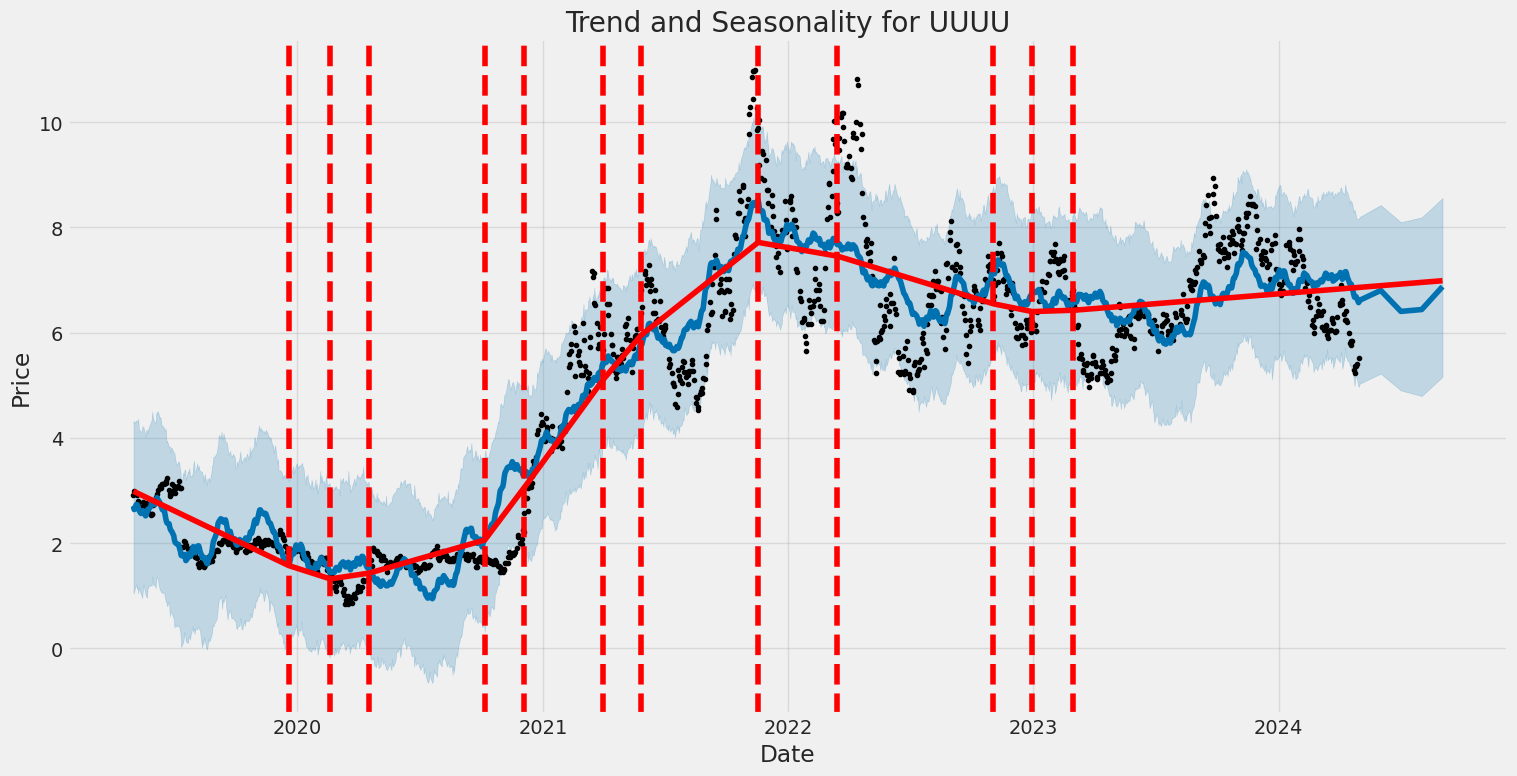
Energy Fuels Inc. (UUUU) has experienced considerable volatility from May 2019 to April 2024. Key indicators of volatility are captured in statistical measures such as the ARCH model mean of zero, indicating no average trend in return, and an omega value of 21.14, which signifies a high base level of volatility. Additionally, the alpha[1] value at 0.0474, although statistically insignificant, suggests some responsiveness of volatility to market movements.
| Statistic Name | Statistic Value |
|---|---|
| Dep. Variable | asset_returns |
| R-squared | 0.000 |
| Mean Model | Zero Mean |
| Adj. R-squared | 0.001 |
| Vol Model | ARCH |
| Log-Likelihood | -3725.89 |
| AIC | 7455.79 |
| BIC | 7466.06 |
| No. Observations | 1,256 |
| Df Residuals | 1256 |
| Df Model | 0 |
| omega | 21.1395 |
| alpha[1] | 0.0474 |
| P>|t| for alpha[1] | 0.304 |
| 95% Confidence Interval for omega | [17.266, 25.013] |
| Covariance Estimator | robust |
When evaluating the financial risk associated with investing $10,000 in Energy Fuels Inc. (UUUU) over a one-year period, a systematic approach was employed by integrating volatility modeling and machine learning predictions. The analysis primarily focused on modeling the stock's volatility, which is crucial for understanding the fluctuations in stock price over time, and hence, the investment risk.
The utilization of volatility modeling aims to estimate the variance of stock returns, where increased variance indicates a higher level of uncertainty or risk in the stock price movements. This modeling technique is adept at capturing the time-varying nature of volatility, which is influenced by market microstructure, investor behavior, and macroeconomic factors. Through this model, it's possible to project how the fluctuations in Energy Fuels Inc.'s stock might evolve, identifying periods of potentially high volatility which are of greater concern for risk management.
Parallel to this approach, machine learning predictions were applied to forecast future stock returns. Specifically, an ensemble learning method that undertakes multiple decision trees was used to predict financial returns based on historical data and various predictor variables such as past stock prices, volume, and possibly market sentiment indicators. This form of predictive analysis leverages historical patterns to forecast future stock price movements, thereby aiding in the expectation of potential gains or losses. It's particularly useful for assessing the likelihood of various investment outcomes, providing a probabilistic foundation to the risk assessment.
Bringing these analyses together, the calculated annual Value at Risk (VaR) at a 95% confidence level for the $10,000 investment in Energy Fuels Inc. was established at $519.88. This indicates that there is a 95% chance that the investor will not lose more than $519.88 over the next year, under normal market conditions. This VaR measure is a critical indicator as it encapsulates the potential downside risk, combining insights from both the volatility model's output on uncertainty quantification and the predictive machine learning framework's input on expected stock returns.
By integrating these methodologies, the financial risk inherent in the stock of Energy Fuels Inc. is quantitatively outlined, providing an investor with a clearer picture of what to potentially expect from their investment - specifically highlighting severe but unlikely potential losses. This enhances strategic investment decisions by affixing numbers to potential adverse outcomes, thus harnessing both the predictive power of contemporary machine learning techniques and the rigorous risk quantification provided by volatility modeling.
When analyzing an options chain, particularly the Greeks for call options of Energy Fuels Inc. (UUUU), it's crucial to look at various factors such as delta, gamma, theta, vega, and rho, alongside the strike price and expiration date. These elements give insights into the option's sensitivity to different market conditions.
Starting with the option expiring on May 17, 2024, with a strike price of $5, it presents a reasonably high profitability with a return on investment (ROI) of approximately 30.92%. This option has a delta of about 0.808, suggesting that the option price might increase by $0.808 for every $1 increase in the underlying stock price. This relatively high delta, combined with a gamma of 0.404, implies increased sensitivity to the stock's price movements, which can be advantageous if the stock's price trajectory is accurately predicted to rise by at least 5%. This combination, tempered slightly by a low theta value, which denotes a slower rate of time decay, makes it an appealing option for short-term favourable moves in the underlying stock.
For a long-term perspective, the option expiring on January 17, 2025, with a strike price of $3.0, shows promising attributes. It sports an extremely high delta of 0.872, which means it behaves almost like the stock itself but with leveraged gains for increases in the stock's price. Given its long duration to expiry, the theta of -0.00285 is remarkably low, indicating less daily price erosion due to time decay. Such properties are desirable for a long-term bullish perspective on Energy Fuels Inc., particularly if the stock is expected to perform strongly over the year. The high vega of about 0.976 might also appeal to more speculative strategies if volatility is expected to increase.
In a scenario looking at the intermediate term, the option expiring on June 21, 2024, with a strike of $4.0, also stands out. Its delta of approximately 0.804 combined with a significantly high vega of 0.569, suggests that the option's value will react favorably not only to movements in the stock price but also to any upticks in implied volatility, common ahead of significant news or market shifts. This could be a strategic pick for those anticipating volatility spikes or more pronounced stock movements.
Lastly, it's worthy to mention the option expiring on October 18, 2024, with a strike price of $3. This call option exhibits the highest delta in the examined set, at about 0.933. This high delta indicates that the option will almost mimic the stock, providing nearly one-to-one profitability with stock price increases, which is invaluable if the stock price is expected to rise significantly. Coupled with a modest theta, the erosion of its time value is less of a concern in the medium term.
In conclusion, based on the combination of Greeks, strike prices, and expiries, several options present profitable opportunities. Short-term traders might favor the May 17, 2024, $5 call for its balance of sensitivity to price and time decay. In contrast, those with a long-term bullish outlook may opt for the January 17, 2025, $3.0 call due to its high delta and controlled time decay. Those looking to leverage anticipated increases in volatility along with price movements might find the June 21, 2024, $4.0 strike particularly appealing.
Similar Companies in Uranium:
Report: Uranium Energy Corp. (UEC), Uranium Energy Corp. (UEC), Report: Denison Mines Corp. (DNN), Denison Mines Corp. (DNN), Ur-Energy Inc. (URG), Report: NexGen Energy Ltd. (NXE), NexGen Energy Ltd. (NXE), Report: Cameco Corporation (CCJ), Cameco Corporation (CCJ)
https://finance.yahoo.com/news/heres-why-energy-fuels-uuuu-215020872.html
https://finance.yahoo.com/news/energy-fuels-announces-agreement-transformational-231300643.html
https://finance.yahoo.com/news/australias-resources-agrees-241-mln-234459513.html
https://finance.yahoo.com/news/energy-fuels-uuuu-buy-wall-133010096.html
https://finance.yahoo.com/news/energy-fuels-drops-11-offers-155341800.html
https://finance.yahoo.com/news/energy-fuels-uuuu-stock-sinks-214517561.html
https://finance.yahoo.com/news/energy-fuels-uuuu-report-q1-140021938.html
https://finance.yahoo.com/news/cantor-fitzgerald-downgrades-energy-fuels-111704531.html
https://www.sec.gov/Archives/edgar/data/1385849/000138584923000035/efr-20230930.htm
Copyright © 2024 Tiny Computers (email@tinycomputers.io)
Report ID: iADrfD
Cost: $0.76009
https://reports.tinycomputers.io/UUUU/UUUU-2024-04-30.html Home