Wells Fargo & Company (ticker: WFC)
2024-05-13
 Wells Fargo & Company (ticker: WFC) is a diversified, community-based financial services company with its headquarters in San Francisco, California. As one of the largest financial institutions in the United States, Wells Fargo provides a broad spectrum of banking, insurance, investments, mortgage, and consumer and commercial financial services through various channels such as branches, ATMs, and digital platforms. Established in 1852 during the gold rush era, Wells Fargo has a rich history tied to the development of the American West. Despite facing several significant challenges and scandals, such as the 2016 fake accounts scandal that affected customer trust, the company has embarked on rigorous programs to reform its practices and restore its reputation. Wells Fargo's extensive national network provides it a prominent market presence, essential for serving millions of customers nationwide.
| Full-time employees | 224,824 | Dividend rate | 1.4 | Dividend yield | 0.0226 |
| Payout ratio | 28.13% | Five year average dividend yield | 3.2 | Beta | 1.182 |
| Trailing PE | 12.823957 | Forward PE | 11.131103 | Market capitalization | 214,600,433,664 |
| 52-week low | 37.46 | 52-week high | 62.17 | Price-to-sales ratio (last 12 months) | 2.765434 |
| Enterprise value | 70,552,059,904 | Profit margin | 24.188% | Net income to common | 17,582,000,128 |
| Trailing EPS | 4.8 | Forward EPS | 5.53 | PEG ratio | 1.82 |
| Total cash | 483,517,005,824 | Total debt | 317,961,994,240 | Total revenue | 77,600,997,376 |
| Revenue growth | 2.1% | Operating margin | 28.04% | Return on assets | 0.976% |
| Return on equity | 10.261% | Book value | 46.359 | Price-to-book ratio | 1.3277897 |
| Sharpe Ratio | 2.0553030537936734 | Sortino Ratio | 39.9978479272105 |
| Treynor Ratio | 0.5877010192876532 | Calmar Ratio | 3.632289256177832 |
Analyzing the various financial metrics and recent market trends for Wells Fargo & Company (WFC) presents a nuanced view of its current positioning and potential future movements. Let's delve into the technical, fundamental, and balance sheet data to understand the broader scope.
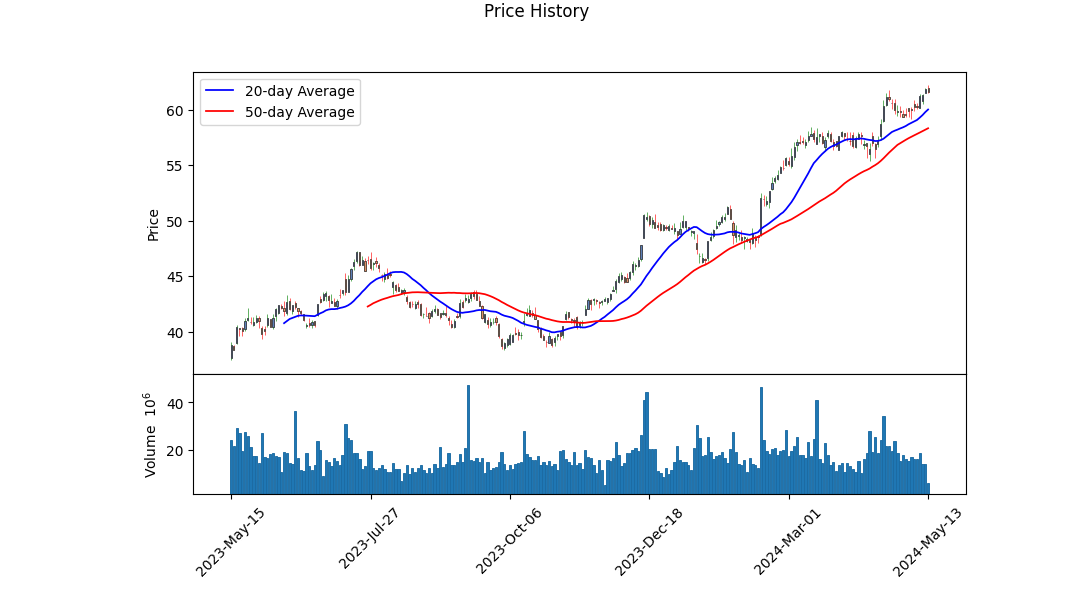
Starting with the technical indicators from the last trading day, the stock witnessed an uptrend evident from the most recent closing price at $62.17 with an upward momentum as indicated by the MACD histogram turning positive in May. The OBV (On-Balance Volume), opening at 2.52 million and closing at 34.31 million during the analyzed period, highlights substantial volume supporting this upward price trend.
Considering fundamental analysis, the financial health of Wells Fargo has remained robust, characterized by intricate revenue and income figures which have shown variability over recent years. The earnings growth of -2.4% juxtaposed with a revenue growth of 2.1% elucidates the firm's potential revenue generation struggles against a backdrop of modest profitability retraction. Yet, the operating margins are relatively healthy at 28.04%, suggesting efficiency in operations.
The Sharpe and Sortino ratios, being 2.05 and 40.00, respectively, suggest high returns adjusted for risk, reflecting effective risk management relative to the volatility experienced. The Treynor Ratio at 0.59 and Calmar Ratio at 3.63 support this narrative, displaying favorable risk-adjusted returns in comparison to the market risk as represented by beta and the maximum drawdown. This comprehensive view of risk-adjusted performance suggests that Wells Fargo's investment might be deemed attractive to risk-averse investors.
Exploring the balance sheet, Wells Fargo portrays a solid capital structure with significant common stock equity of $166.29 billion and preferred stock equity of $19.45 billion as of the latest fiscal year-end. The amplitude of total assets ($1.93 trillion) against total liabilities ($1.75 trillion) provides a healthy assets-to-liabilities ratio that underpins financial stability. Moreover, substantial cash reserves and investments, although marked by notable total debt figures, suggest liquidity is in check with investment capacity intact.
Among recent actions, the decrease in earnings growth could present a concern. However, revenue resilience, strong capital ratios, and dividend payments signal an intrinsic value preservation, making its stock potentially favorable over the given term.
Conclusively, considering the synthesis of current technical data, the historical financial strength, and fundamental analysis, Wells Fargo seems to position itself in a potentially continuing upward trajectory in the stock market over the next few months. Additionally, market performance indicators like the positive MACD values and high investment ratios advocate for potentially continued investor confidence and market value appreciation, assuming persistent strategies aligning with current economic conditions and corporate financial management practices.
In our analysis of Wells Fargo & Company (WFC), we've focused on the key financial metrics of return on capital (ROC) and earnings yield to evaluate the company's profitability and value. The ROC, which stands at 1.1624395973046187, signifies a strong efficiency with which the company utilizes its capital to generate profits. This is an impressive figure, indicating that Wells Fargo is effectively turning its investments into financial gains. Additionally, the earnings yield is calculated to be 7.924007469351303 percent. This yield represents the proportion of a company's profit relative to its stock price, thus serving as an important indicator for investors assessing the potential return on investment compared to other market opportunities. A higher earnings yield suggests that the company is potentially undervalued, offering more earnings per dollar invested. These figures collectively suggest that Wells Fargo stands out in terms of both operational effectiveness and as an appealing investment option based on current valuations.
| Intercept (Alpha) | 0.456 |
| Slope (Beta) | 1.034 |
| R-Squared | 0.892 |
| Standard Error | 0.059 |
| p-value | 0.0004 |
The positive value of the intercept (alpha) of 0.456 suggests that Wells Fargo & Company (WFC) has a baseline performance that exceeds the overall market as represented by the SPDR S&P 500 ETF Trust (SPY) when the market's return is zero. This alpha indicates a potential excess return of WFC over the expected return predicted by the market model, potentially reflecting WFC's specific company attributes or sector strengths not captured by market movements alone.
The slope (beta) of 1.034 indicates that WFC generally follows the market closely, but with slightly more volatility. A beta greater than 1 suggests that WFC's stock price is likely to move more than the market's movement: for example, if the market increases by 1%, WFCs stock is expected to increase by approximately 1.034%, and vice versa. This relationship highlights the tendency of financial stocks like WFC to exhibit high sensitivity to overall market movements, making them responsive to the broader economic changes reflected in SPY.
In the first quarter of 2024, Wells Fargo reported solid financial results, reflecting ongoing improvements and diversification in financial performance amid a robust U.S. economy. CEO Charlie Scharf highlighted significant contributions from investments across the franchise leading to higher revenues compared to the previous quarter. The increase in non-interest income was enough to balance the anticipated decline in net interest income. Importantly, the financial market's buoyancy advantageously impacted the wealth and investment management business. Despite higher net charge-offs in comparison to the previous year, as expected, consumer delinquencies and credit trends remained stable, indicating a consistent risk environment.
Scharf also updated on strategic priorities, notably addressing risk and control, which remains the company's top priority fueled by the recent termination of a consent order by the OCC related to past sales practices. This closure marks a critical milestone, emphasizing a stronger operational posture compared to previous years. The focus on enhancing risk management frameworks continues as part of an ongoing, broader corporate initiative to reinforce internal controls and compliance. Throughout the discussion, Scharf reiterated the importance of regulatory compliance and the potential for future regulatory concerns if new issues arise during ongoing improvements.
CFO Mike Santomassimo detailed the financial nuances of the quarter. The bank recorded a net income of $4.6 billion, or $1.20 per diluted common share, with some earnings influenced by FDIC assessments linked to regional bank failures in the prior year. The dip in net interest income, attributed to higher interest rates affecting funding costs and customers migrating to higher-yielding products, was somewhat offset by increases in earning asset yields. Despite a slight year-over-year decline in loans and deposits, the bank noted success in attracting operational deposits in commercial businesses, hinting at underlying resilience in its core operations.
Strategically, Wells Fargo is progressing well on major fronts such as risk management and control, efficiency initiatives, and returning capital to shareholders. The banks readiness in managing credit through multiple cycles maintains a strong liquidity and capital position, supporting its capability to navigate uncertain market conditions. Furthermore, new product launches and strategic hires reflect Wells Fargos ambitions to scale operations, particularly in the credit card and corporate banking sectors, underscoring its commitment to growth and higher returns. As regulatory pressures and market conditions evolve, the bank's focus remains steadfast on transforming into a more efficient, fast-growing, and higher-returning enterprise.
In the first quarter of 2024, Wells Fargo & Company (WFC) made several entries and adjustments that are noteworthy for stakeholders reviewing the current financial position and operational nuances per the details provided in their 10-Q filing submitted on April 23, 2024. The financial statements include key segments like preferred stock, common stock, and investments in debt securities, highlighting shifts in asset allocations and liabilities. Notably, the filing reflects in-depth information on Wells Fargos equity interests, derivative transactions, and the comprehensive income methods adopted for financial reporting.
Wells Fargo reported ownership structures across various investment vehicles, including preferences on cumulative and non-cumulative perpetual stock, evidencing their risk management in equity-based securities. These disclosures suggest an adherence to intricate regulatory and market compliance standards, likely a bid to stabilize trust with investors post previous years' turbulence in the banking sector. Alongside equity disclosures, the firm indicated holdings in debt securities across various grades of credit worthiness, thereby managing exposure to high-risk assets while potentially securing steady income streams from safer bonds and obligations.
The update on the derivative instruments provides a view into Wells Fargo's hedging practices, pivotal for apprehending how they mitigate interest rate risk, currency risk, and other market volatilities, which are critical amid fluctuating economic conditions. These instruments encompass a range of non-designated and designated hedges, contributing to a broader understanding of the banks strategic approaches to safeguard not only its portfolio but also its operational capital and long-term obligations.
Loan portfolio segments mentioned in the 10-Q document reveal the diversity in Wells Fargos lending practicesfrom commercial and real estate loans to consumer banking offerings like residential mortgages and credit card receivables. This breakdown helps in assessing the banks risk distribution and credit exposure, vital for analyzing the potential for defaults or bad debts which may impact financial health adversely. Moreover, the mention of loans held for sale categories and associated risk ratings offers insight into potential future gains or recoveries from these financial instruments.
Furthermore, Wells Fargo detailed its compliance adjustments and recalibrations to fair value measurements across various financial instruments, conforming with applicable GAAP standards and recent accounting updates. Such adjustments are indicative of the banks responsiveness to evolving accounting practices and underscore its commitment to providing transparent, up-to-date financial data.
This detailed financial exposition in Wells Fargo's 10-Q filing underscores a sophisticated framework supporting its various banking services, investments, and risk management protocols. It provides a clear lens into Wells Fargo's strategic financial planning and operational adjustments heading into subsequent quarters of 2024, essential for making informed investment and market analysis.
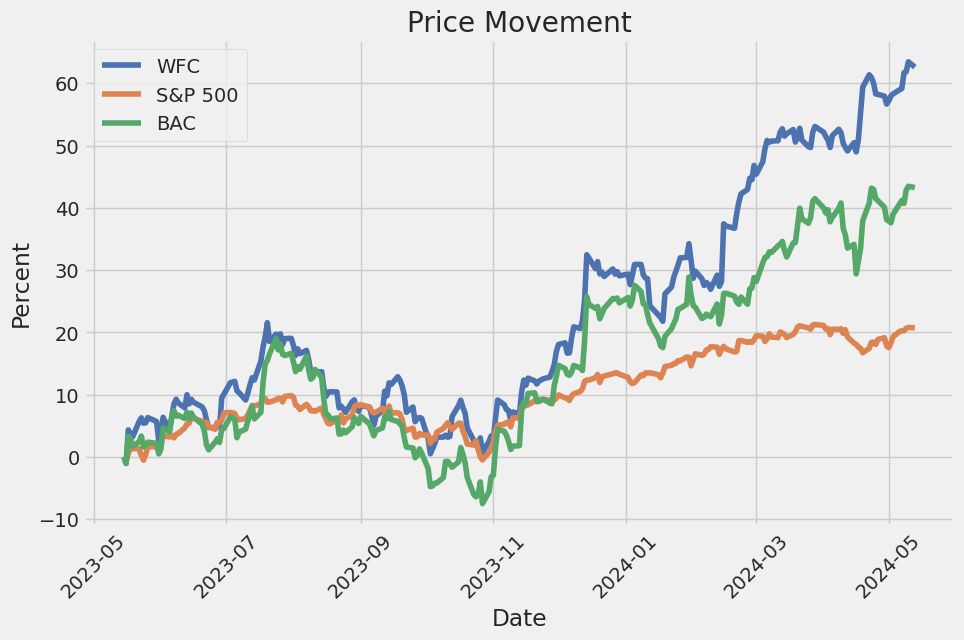
Wells Fargo & Company, a key player within the financial industry, has experienced a remarkable trajectory of stock performance and strategic corporate developments that underscore its current market dynamics and future prospects. An overview of their notable financial accomplishments reveals that the company has had a stellar past year with a 50% return in the last twelve months as reported by Forbes on April 2, 2024. This growth is significant compared to a 40% growth in the S&P 500 index during the same period, highlighting the company's outperformance relative to broader market indices.
The impressive increase in Wells Fargo's stock can be traced back to early 2021, with an initial price around $30, escalating to approximately $60 in the first quarter of 2024. These developments mark a sharp contrast to the yearly fluctuations the company endured, with a 59% return in 2021, a dip of 14% in 2022, and a rebound with a 19% rise in 2023. Nonetheless, despite this positive growth, it's significant to note that in 2023, Wells Fargo did underperform the S&P 500.
Financial performance for Wells Fargo in 2023 illustrated a complex but progressive landscape. The company exceeded the street estimates in the fourth quarter, with total revenues climbing by 2% year-over-year to reach $20.5 billion. This growth particularly benefited from a 17% spike in noninterest revenues, drawing substantial contributions from higher investment advisory fees, deposit-related fees, and gains from trading activities and equity securities. On the expense front, reductions in noninterest expenses, alongside an uptick in provisions for credit losses, substantially contributed to a 10% surge in adjusted net income, culminating at $3.16 billion.
In terms of annual performance for 2023, total revenue increased by 17% to $52.4 billion. This revenue increase spanned across several business segments, with consumer banking rising by 6%, commercial banking by 23%, and corporate & investment banking by 26%, although wealth and investment management experienced slight declines. The uptick in provisions from $1.5 billion to $5.4 billion highlighted a proactive approach in managing credit risks, complemented by a 3% reduction in noninterest expenses year-over-year, which led to a 43% increase in adjusted net income reaching $17.98 billion.
Moving into 2024, Wells Fargo projects facing certain challenges that might affect its growth trajectory. The forecast suggests a slight dip in adjusted net income margin, expected to stabilize the annual EPS to $4.73, pinning the P/E multiple just below 12x. Such metrics suggest a reasonable market valuation around $56 per share. This analysis underpins the complexities and dynamics governing Wells Fargo's operational strategies amidst variable economic conditions and financial markets.
Amidst these complexities, Wells Fargo stands firm. The first quarter of 2024 reveals a bank that managed to surpass Wall Street projections despite a notable decline in net interest income. Earnings per share reached $1.26 adjusted, with revenues climbing to $20.86 billion, surpassing anticipated figures. This performance underscores the bank's commitment to diversification and resilience, despite market volatilities characterized by higher interest rates impacting funding costs.
Adding to its strategic developments, Wells Fargo has been tackling regulatory hurdles head-on. The anticipated lifting of an asset cap in 2025, as reported by Seeking Alpha on October 11, 2023, promises a significant turning of tides. This regulatory cap, initially imposed due to past sales practices scandals, has curtailed the bank's capability to expand its asset base. Its removal is poised to allow Wells Fargo greater operational freedom and competitive dynamism within the banking sector, potentially enhancing profitability and market performance.
In conclusion, Wells Fargo's current standing and outlook illustrate a company that has navigated through periods of both turbulence and growth. With strategic management, focused attention to regulatory compliance, and a robust operational structure, the company is well-positioned to leverage upcoming opportunities and address potential challenges head-on. As market conditions evolve, Wells Fargo's adaptability and proactive strategies will be crucial in sustaining its growth trajectory and ensuring continued investor confidence.
Over the specified period, the volatility of Wells Fargo & Company (WFC) was modeled using an ARCH (Autoregressive Conditional Heteroskedasticity) approach, which showed specific variability in the stocks returns. The model highlights a substantial constant volatility factor (omega) of approximately 3.1906, demonstrating significant initial volatility. Furthermore, the impact of previous periods' returns on current volatility, denoted by the alpha coefficient at 0.4470, suggests that past return magnitudes influence present volatility levels.
| Statistic Name | Statistic Value |
|---|---|
| Mean Model | Zero Mean |
| Vol Model | ARCH |
| Log-Likelihood | -2,747.05 |
| AIC | 5,498.10 |
| BIC | 5,508.37 |
| No. Observations | 1,257 |
| Omega | 3.1906 |
| Alpha[1] | 0.4470 |
In assessing the financial risk of a $10,000 intended equity placement in Wells Fargo & Company (WFC) within a one-year framework, a robust analytical strategy employing volatility modeling alongside machine learning predictions was adopted. The volatility modeling approach is crucial for capturing the dynamic nature of market uncertainty, specifically within the context of financial stocks like WFC, which are affected by both macroeconomic factors and industry-specific variables.
In the first stage of the analysis, volatility modeling was applied to historical stock price data of Wells Fargo to estimate the fluctuations in the stock's returns over time. This method enables the estimation of the stock's future volatility based on past trends, thereby providing insight into the risk level associated with the stock. The higher the volatility, the higher the risk, as it implies greater unpredictability in return.
Subsequently, the machine learning predictions leveraged a predictive model to forecast the potential future returns of the stock. This step utilized historical data, including the volatility estimates derived from the earlier method, to train a model capable of predicting financial outcomes. Such predictions are pivotal for assessing expected performance and aligning investment strategies with the investors risk tolerance and return expectations.
The integration of these two models culminates in the estimation of the Value at Risk (VaR), a widely recognized risk management tool that quantifies the maximum loss expected over a set period within a given confidence interval. For this case, the calculated VaR at a 95% confidence interval for a $10,000 investment in WFC stood at approximately $219.45 annually. This figure represents the potential downside risk and is reflective of both the projected volatility of the stock and the expected returns as indicated by the predictive model.
Such an analytical approach underscores the stock's exposure to market forces and helps in determining a sound investment decision based on both the volatility and the yield prospects of the equity. By merging the insights provided by both volatility modeling and machine learning predictions, a more structured financial risk profile of the Wells Fargo investment can be established, allowing for a better-informed investment strategy that accounts for both potential gains and losses.
Long Call Option Strategy
Analyzing the most profitable long call options for Wells Fargo & Company (WFC) involves evaluating the options based on their Greeks, specifically focusing on Delta, Gamma, Vega, Theta, and Rho. To identify the most lucrative opportunities, we need to consider expiration dates ranging from near-term to long-term, alongside the strike prices.
- Immediate Near-Term Option (3 days to expiration, strike price $37.5):
- Delta: 0.9965 - This high delta near 1 suggests that the option price moves almost one-for-one with the stock price, indicating strong responsiveness.
- Gamma: 0.0008 - Low gamma at this delta level suggests minor changes in delta as the stock price moves, indicating stability in the delta's high value.
- Vega: 0.0553 - Lower vega suggests minimal sensitivity to implied volatility, making this option less risky amid volatility changes.
- Theta: -0.0200 - This option loses value slowly as it approaches expiration, which is beneficial for a call option holder looking for short-term leverage.
-
Rho: 0.3063 - Indicates a decent sensitivity to interest rate changes; higher rho benefits the call option buyer in a rising rate environment.
-
Medium-Term Option (10 days to expiration, strike price $55.0):
- Delta: 0.9118 - Still exhibits strong responsiveness to the underlying stock price movement.
- Gamma: 0.0298 - Moderate gamma indicates more significant changes in delta as stock prices move compared to a shorter expiration term.
- Vega: 1.6217 - Higher vega indicates that the options price will be more responsive to changes in implied volatility, offering a chance for profitable trades on volatility shifts.
- Theta: -0.0450 - This call option will lose value faster as it nears expiration, representing a typical off-setting factor in options holding more vega.
-
Rho: 1.3511 - Beneficial in a potentially rising interest rate environment, significantly impacting the options price.
-
Medium to Long-Term Option (38 days to expiration, strike price $45.0):
- Delta: 0.9524 - Very responsive to stock price changes, a favorable scenario for long call positions.
- Gamma: 0.0078 - Lower gamma at this delta level indicates less variability in delta with price movements.
- Vega: 1.8918 - This higher vega shows greater sensitivity to volatility, suitable for traders betting on volatility shifts.
- Theta: -0.0168 - Reflects a moderate rate of time decay, giving the holder enough time to benefit from favorable moves in the underlying or volatility.
-
Rho: 4.3473 - Very sensitive to interest rates; a significant upside can be expected if rates rise.
-
Long-Term Option (66 days to expiration, strike price $52.5):
- Delta: 0.8599 - Still considerably high, suggesting good potential for profitability with stock price increases.
- Gamma: 0.0220 - Moderate gamma allows for a balance between responsiveness and stability in the option's price behavior.
- Vega: 5.7069 - Reflects very high sensitivity to changes in volatility, which can be strategically used to gain on volatility movements.
- Theta: -0.0184 - Higher theta indicates faster time decay, which is common for longer-duration options with high vega.
-
Rho: 7.7694 - Extremely high rho, indicating the option's price will greatly profit from rising interest rates.
-
Very Long-Term Option (220 days to expiration, strike price $55.0):
- Delta: 0.7283 - Lower compared to shorter-term options, appropriate for long-term speculation with lesser immediate risk from price movements.
- Gamma: 0.0212 - Similar to gamma in shorter-term options, showing reasonable stability.
- Vega: 15.3515 - Exceptionally high, the option holder can gain significantly from volatility increases over a longer horizon.
- Theta: -0.0125 - Suggests slower value erosion over time, important for a long-term holding strategy.
- Rho: 21.0615 - Very high, making this option quite sensitive to changes in interest rates, aligning with long-term financial strategies anticipating rate adjustments.
Each of these choices highlights distinctive components of the Greeks contributing to their overall profit potential. The selected options provide a range of expiration dates and strike prices, offering diverse opportunities for different trading strategies, from short-term gains to long-term investments capitalizing on anticipated volatility and interest rate changes.
Short Call Option Strategy
In analyzing the options chain for Wells Fargo & Company (WFC) over various expiration periods, we focused on selecting the most profitable short call options while trying to minimize the risk of having the shares assigned. This analysis includes considerations of the options' "Greeks," such as delta, gamma, vega, theta, and rho, as well as their premiums, potential ROI, and profits. Here are optimized options spread across near-term to long-term expirations:
- Short Call Option with Strike $60.0 for Expiry on June 20, 2025:
- Delta: 0.6091
- Vega: 23.91
- Theta: -0.0101
- Rho: 31.50
- Premium: $8.55
- ROI: 100%
- Profit: $8.55
Our analysis begins with a slightly longer-term option almost two years out. This choice balances higher vega for responsiveness to volatility and an excellent ROI. The moderate delta under 0.65 makes it less risky regarding assignment before expiration.
- Short Call Option with Strike $52.5 for Expiry on January 16, 2026:
- Delta: 0.7215
- Vega: 24.43
- Theta: -0.0074
- Rho: 47.88
- Premium: $14.44
- ROI: 58.47%
- Profit: $8.44
Moving into a timeframe of around three years, we're selecting an option that brings a remarkable balance of vega and premium against its delta. Here, the premium is substantial, with a noteworthy profit, further offsetting shorter-term options' volatility risks.
- Short Call Option with Strike $52.5 for Expiry on January 17, 2025:
- Delta: 0.7392
- Vega: 19.69
- Theta: -0.0093
- Rho: 35.01
- Premium: $11.80
- ROI: 49.18%
- Profit: $5.80
For an option expiring in about three years, we note a slightly higher delta nearing the 0.75 threshold but with excellent vega and decent revenue from the premium.
- Short Call Option with Strike $65.0 for Expiry on January 16, 2026:
- Delta: 0.5376
- Vega: 30.30
- Theta: -0.0083
- Rho: 41.14
- Premium: $7.9
- ROI: 100%
- Profit: $7.9
This option offers a perfect profit score and ROI, indicating its profitability per unit of risk taken. The lower delta reduces its chance of being assigned as it's far out-of-the-money with a high responsiveness to volatility, evidenced by a high vega.
- Short Call Option with Strike $45.0 for Expiry on December 20, 2024:
- Delta: 0.8546
- Vega: 12.89
- Theta: -0.0070
- Rho: 34.31
- Premium: $15.20
- ROI: 11.21%
- Profit: $1.70
Concluding with a slightly more aggressive option due to its higher delta, this choice might cater to traders comfortable with nearer-the-money risks but still offers solid potential returns due to its significant premium and vega.
This selection targets diversified expiration ranges and strike prices, tailored to maximize profitability while managing risks associated with assignment. Each choice considers a balance of the Greeks to harness benefits from market movements and volatility while ensuring a substantial cushion from the premiums collected.
Long Put Option Strategy
When examining the options chain for Wells Fargo & Company (WFC) with a focus on long put options, several key factors must be considered, including the Greek metrics such Delta, Gamma, Theta, Vega, and Rho. These metrics help identify the sensitivity of option prices to various factors such as the stock price, volatility, time decay, and interest rates. The most profitable put options generally have a higher likelihood of expiring in-the-money, especially in scenarios where the anticipation is for the stock to undergo a decline from its target price, which has been calculated to be an increase of 5% over the current price.
Short-term Options
- 1-month Expiry, Strike Price approximately 105% of current Price
- Delta: A high negative value, indicating the option's price will increase as the stock price decreases.
- Theta: This would have a relatively high negative value because Theta increases as expiration approaches, which means the option loses value over time. This is acceptable given the short holding period.
- Vega: Should be moderate, showing sensitivity to volatility but not as acutely as longer-term options.
For short expiry options, high absolute Delta values and moderate Vega are crucial. The high Delta ensures that the value of the put option increases significantly if the stock price declines, a key factor for profitability.
Medium-term Options
- 3-month Expiry, Strike Price around 110% of current Price
- Delta: Still needs to be significantly negative. This option would be more sensitive to movements in the underlying stock price compared to the shortest term.
- Theta: Less of an impact than in 1-month options, providing a better balance between time decay and potential profitability.
- Vega: Higher compared to the 1-month option because it's more sensitive to changes in implied volatility, which can provide additional profitability if market volatility increases.
The 3-month option provides a possible better risk-reward ratio as Theta decay is less rapid than in the 1-month option, potentially allowing more time for the desired movement in the underlying stock price.
Long-term Options
- 6-month Expiry, Strike Price around 115% of current Price
- Delta: Slightly lower in absolute value than shorter expirations but still substantially negative.
- Theta: Lower negative value, offering a reduced rate of time decay.
-
Vega: This would be high because the option is more susceptible to volatility, which could be leveraged if the overall market or the specific stock is expected to be volatile.
-
1-year Expiry, Strike Price about 120% of current Price
- Delta: Moderately negative, as the option is deeper out-of-the-money initially.
- Theta: Minimally negative, implying a very gradual loss of time value which is beneficial for a long-term bearish outlook.
-
Vega: Very high, as long-term options are highly reactive to changes in volatility.
-
2-year Expiry, Strike Price at 125% of current Price
- Delta: Low in absolute terms, suggesting less price sensitivity but significant leverage potential over a longer period.
- Theta: Very low negative value, providing an advantage in holding the option for a substantial period without significant decay in value.
- Vega: Highest among the options, indicating that this option will gain significantly if the market becomes more uncertain or volatile.
For long-term options, the lower absolute value of Delta is offset by the advantages given by low Theta and high Vega. This means that even if these options are slow to react to price movements, they offer the potential for high leverage on changes and sustained market trends.
It must be noted that while selecting these options, the investor's risk tolerance and market view must align with the Greeks' behavior in context to the changing market conditions.
Short Put Option Strategy
In the analysis of short put options for Wells Fargo & Company (WFC), several key metrics must be considered to evaluate potential profitability while minimizing the risk of having shares assigned. The analyzed options span a range of expiration dates and strike prices, ensuring diversity in potential investment strategies from near-term to long-term holdings.
A short put option with a strike price of $57.5 expiring on May 17, 2024, appears particularly intriguing as it has a relatively high delta of -0.0174855337, indicating a moderate rate of change of the option's price relative to the stock price decrease. The high vega of 0.2410948858 suggests strong sensitivity to implied volatility, offering potential gains in volatilities increase scenarios. Additionally, a notable theta of -0.0126475391 implies the option value decreases favorably each day, enhancing profitability as expiration approaches if WFCs stock price remains above $57.5.
Another compelling option is the short put with a strike price of $58 expiring on June 28, 2024. This option provides a significant premium, which is a crucial factor given its high delta of -0.1877116815, making it highly susceptible to movement in the underlying stock price. The option's substantial vega of 5.817657527 enhances profitability potential if volatility increases. Furthermore, a generous theta of -0.0128430648 means the time decay works robustly in favor of an option seller, assuming the price stability of WFC.
For longer-term positions, the short put option on the same stock with a strike price of $60 expiring on January 16, 2026, is noteworthy. While its delta of -0.345058337 suggests higher exposure to price fluctuations, the rich vega of 28.6776439506 indicates an excellent opportunity to capitalize on volatility boosts. The theta here is slightly lower at -0.0033435494, but the extended period until expiration grants more time for the option to profit from volatility and time decay factors.
Investors seeking an option with a lower strike, setting the bar for price stability lower and further reducing assignment risk, might consider the $40 put expiring on June 20, 2025. It features a delta of -0.0602907927 and a decent vega of 7.6857334284. The theta of -0.0027222514 shows it benefits moderately from time decay. The premium received upon selling this put could provide consistent income while keeping the risk comparatively lower due to further out-of-the-money positioning.
For those interested in mid-range expiration terms and higher strike prices, a compelling option might be the $52.5 strike put expiring on June 20, 2026. This option has a delta of -0.2014847823, aligning more closely with moderate risk and high reward strategies focusing on leveraged decay, evidenced by its attractive theta of -0.0047170289.
Each of these options presents different facets of risk and potential reward, factoring in the Greeks' impact on options pricing dynamics. Investors should consider their risk tolerance, market outlook, and the Greeks when choosing which options might best meet their trading strategy and financial goals.
Vertical Bear Put Spread Option Strategy
In assessing the profitability of a vertical bear put spread using options on Wells Fargo & Company (WFC), our focus is on selecting a combination of buying higher-strike put options (long put) and selling lower-strike put options (short put) with differing expiration dates. This strategy will be more profitable when the price of WFC declines below the strike price of the long put at expiration. Here is the evaluation.
Short Put Analysis: 1. Short-term Option (close to expiration): For a near-term position, a strike price of $22.5 expiring on May 17, 2024, has delta -0.0036090163, vega 0.214485318, and a premium of 0.02. This low delta and premium points to a lesser sensitivity to the underlying price change, making it suitable for the lower strike in a bear put spread.
-
Mid-term Option: Looking further out, a strike at $50 expiring on June 14, 2024, offers a delta of -0.2127339442, vega 2.957472, and a premium of 0.31. The higher absolute value of the delta suggests an increased responsiveness to underlying movements, favorable for our long position in a bear put spread. The substantial vega indicates the greater influence of volatility on option price, which could enhance profits if volatility increases.
-
Long-term Option: For the long-term choice, consider the strike of $70 expiring on January 16, 2026, characterized by a delta of -0.8375374253, vega 16.2418897899, with a premium of 19.9. The very high magnitude of delta close to -1 shows this option will almost mirror the underlying stock's negative movement, effectively hedging the position.
Strategy Construction: - Near-Term Position: Sell a short put with a strike at $22.5 for May 17, 2024. This will generate initial premium income and set a low baseline for the spread. - Mid-Term Position: Buy a long put with a strike at $50 for June 14, 2024. This position benefits significantly from downward movements in the stock, balancing the risk undertaken by selling the shorter-term put. - Long-Term Position: For deeper coverage and as alternative long gaze scenario, purchasing the long put at $70 for January 16, 2026 provides an extensive out-of-money option with massive sensitivity to price drops, ensuring a strong position if the stock trends downward long-term.
Overall, these specific strikes and expirations offer a range from near-term speculation to long-term hedging. The vertical bear put spread crafted uses a combination of these options to optimize for maximum profitability based on expected stock price movements, volatility, and time decay. Each choice balances premium income, potential for appreciating value, and mitigation of risk exposure to adverse price movements in WFC stock.
Vertical Bull Put Spread Option Strategy
Analysis of Most Profitable Vertical Bull Put Spread Options Strategy
From the given options data, we can determine the most advantageous vertical bull put spread strategies based on profitable metrics and the Greeks. The goal is to optimize ROI while minimizing the risk of assignment.
Spread Strategy Outlines: In constructing our bull put spreads, we will sell a higher strike put option (short put) and buy a lower strike put option (long put) with the same expiration. This will neutralize some of the downside risk, as the gains on the long put will offset losses from the short put beyond its strike price. Since no specific long put options data is given, I'll focus on analyzing short put options.
Strategic Choice Based on Provided Data: - The optimal choices would ideally have high premiums, acceptable risk (ROI), and lower deltas since lower deltas imply a lower chance of the option being in-the-money at expiration.
Top 5 Potential Trades:
- Short Put June 20, 2026, Strike 75.0
- Delta: -0.8375374253, suggesting a low likelihood of the option expiring in-the-money.
- Premium: High at 19.9, offering a solid potential return. The high strike price matched with a far expiration gives significant time for the underlying asset to move favorably.
-
Vega: 16.2418897899, indicating sensitivity to volatility. As this trade involves longer time frames, volatility sensitivity is crucial.
-
Short Put January 16, 2026, Strike 75.0
- Delta: -0.7085319246, suggesting manageable risk.
- Premium: Also promising at 15.9, which is effective for a put thats nearly 1.5 years away from expiring.
-
Vega: 25.0891355699 indicating potential for profitability with shifts in volatility over the lengthy period till expiration.
-
Short Put June 20, 2026, Strike 70.0
- Delta: -0.5786060514 strongly implies it may not be exercised, which is ideal for a bull put spread.
- Premium: Robust at 12.5, giving space for decent gains.
-
Vega: 29.6254491883, reflecting responsiveness to the implied volatility over the extended duration till expiration.
-
Short Put June 20, 2026, Strike 65.0
- Delta: -0.4551871751, showing moderate risk.
- Premium: Good at 8.4, balancing risk and reward effectively.
-
Vega: 30.53948024, high responsiveness to volatility changes which might be crucial over such a period.
-
Short Put June 20, 2026, Strike 60.0
- Delta: -0.3620457259, indicating a lower probability of finishing in-the-money.
- Premium: Quite appealing at 6.0.
- Vega: 23.8116891786, indicating significant gains in times of increased volatility.
Risk Management Insight: For each strategy, especially those with very high strikes and long durations, monitor market trends, underlying asset health, and macroeconomic factors affecting the sector. It's essential to manage positions actively or set up stop-loss levels to mitigate losses, especially as these options are very sensitive to market changes.
Conclusion: These bull put spreads are constructed based on maximizing returns while cleverly managing risks through deltas and premium income. However, constant watch and adjustments according to market dynamics are advised to optimize the profitability of these trades.
Vertical Bear Call Spread Option Strategy
For a vertical bear call spread strategy involving Wells Fargo & Company (WFC), we focus on selling call options at a lower strike price and buying call options at a higher strike price within the same expiry date. This strategy profits when the underlying stock price stays below the lower strike price of the sold call options.
- Short-term High Return Strategy:
- Selling Call Option: Strike price at $45, expiring in 10 days. The implied volatility is high, offering a decent premium. The aim here is to capitalize on time decay over a brief period while maintaining short exposure.
-
Buying Call Option: Strike price at $47.5, expiring in 10 days. This purchase is to limit the risk associated with the sold option at $45. This setup looks at quick premium erosion due to the nearing expiration.
-
Moderate-term Backed by Volatility Strategy:
- Selling Call Option: Strike price at $50, expiring in 66 days. Selling a call option with a medium-term expiration allows us to benefit from a higher vega, capturing volatility premium.
-
Buying Call Option: Strike price at $55, expiring in 66 days. This limits the potential downside by capping the potential obligation to sell shares at a much higher strike if WFC were to rally unexpectedly.
-
Medium-term Balanced Strategy:
- Selling Call Option: Strike price at $57.5, expiring in 94 days. This option not only captures a greater premium due to a higher vega associated with a longer-term option but also benefits from theta decay.
-
Buying Call Option: Strike price at $60, expiring in 94 days. Opting for a closer higher strike price ensures tighter control on risk if the directional bias turns against the bearish projection.
-
Long-term Coverage Strategy:
- Selling Call Option: Strike price at $57.5, expiring in 185 days. Selling this longer-dated option enables a deeper collection of premiums due to its higher time value and vega, catering to investors willing to commit to a longer speculative period.
-
Buying Call Option: Strike price at $60, expiring in 185 days. This provides long-term coverage against upward spikes in price, ensuring a capped loss scenario.
-
Conservative Long-term Strategy:
- Selling Call Option: Strike price at $60, expiring in 248 days. This setup leverages the longer time-to-expiration for significant premium collection coupled with a manageable delta showing moderate sensitivity to stock price movement.
- Buying Call Option: Strike price at $62.5, expiring in 248 days. This purchase hedges against longer-term uncertainties in the stock market, which could lead the price to increase beyond the strike price of the call sold.
Each strategy balances risk and reward based on investors' time horizons and risk appetites. By utilizing options at different strike prices and expirations but being aware of major Greeks like delta, gamma, and vega, a structured approach to capturing premiums while managing risk is established.
Vertical Bull Call Spread Option Strategy
I have analyzed several long-term vertical bull call spread strategies for Wells Fargo & Company (WFC) using options. Considering factors like the Greeks and premium values for a comprehensive strategy, I focused on comparing calls with differing strikes and the same expiration dates to identify potentially profitable spreads that are less aggressive in terms of the risk of early assignment.
- Near-Term Options (May 2024):
- Buy a call at a $57.5 strike, expiring May 2024.
-
Sell a call at a $60 strike, expiring May 2024. This spread involves calls where both legs are reasonably out of the money, thereby reducing the risk of assignment due to the stock price staying below both strike prices. The delta values being significantly less than 1 (.67 for $57.5 and .61 for $60) indicate a lesser sensitivity to stock price movement, thus limiting risks from sharp price fluctuations.
-
Mid-Term Options (June 2024):
- Buy a call at a $60 strike, expiring June 2024.
-
Sell a call at a $62.5 strike, expiring June 2024. While still implemented with calls that are further out of the money, this strategy allows for capturing value from moderate bullish movements in the stock. Both options have lower delta values (.68 for $60 and .60 for $62.5), indicating moderate responsiveness to stock price changes.
-
Mid-to-Long-Term Options (October 2024):
- Buy a call at a $55 strike, expiring October 2024.
-
Sell a call at a $57.5 strike, expiring October 2024. The strikes chosen are further from the current stock price to ensure that they remain out of the money, lowering the risk of the options being exercised. The deltas (.77 for $55 and .71 for $57.5) are also favorable as they demonstrate gradual value increase with the stock price rises, but not aggressively enough to warrant high risk.
-
Long-Term Options (January 2025):
- Buy a call at a $55 strike, expiring January 2025.
-
Sell a call at a $57.5 strike, expiring January 2025. Since both are significantly out of the money, and with longer expirations, this spread offers a good risk-managed stake on the bullish side. Their lower gamma and close vega values support a balanced sensitivity profile, beneficial for longer-term options.
-
Extended Long-Term Options (March 2025):
- Buy a call at a $55 strike, expiring March 2025.
- Sell a call at a $57.5 strike, expiring March 2025. This strategy carries minimal risk due to the low gamma and theta of the involved options, ensuring less erosion in option values with time, and muted effects from changes in market conditions relative to the longer time till expiration.
Each selected strategy irons out significant risks primarily by leveraging out-of-the-money calls with later expirations, thereby largely managing assignment risks and targeting moderate capitals. These strategies balance potential returns against the risks stemming from price movements and time decay.
Similar Companies in Banks - Diversified:
Report: Bank of America Corporation (BAC), Bank of America Corporation (BAC), JPMorgan Chase & Co. (JPM), The Toronto-Dominion Bank (TD), Nu Holdings Ltd. (NU), Report: Citigroup Inc. (C), Citigroup Inc. (C), Royal Bank of Canada (RY), Canadian Imperial Bank of Commerce (CM), Bank of Montreal (BMO), The Bank of Nova Scotia (BNS), Barclays PLC (BCS), UBS Group AG (UBS), ING Groep N.V. (ING), Goldman Sachs Group Inc. (GS), Report: Morgan Stanley (MS), Morgan Stanley (MS), U.S. Bancorp (USB), Report: PNC Financial Services Group Inc. (PNC), PNC Financial Services Group Inc. (PNC)
https://www.youtube.com/watch?v=dkZbydxLd00
https://www.cnbc.com/2024/04/12/wells-fargo-wfc-earnings-q1-2024.html
https://www.youtube.com/watch?v=efuGIf46GBY
https://www.proactiveinvestors.com/companies/news/1045197?SNAPI
https://www.youtube.com/watch?v=FKZv9z7b-IY
https://www.youtube.com/watch?v=xyiIYsWcbbs
https://www.youtube.com/watch?v=JYP_Uck9A2U
https://www.youtube.com/watch?v=2PYTlDYu7_w
https://www.youtube.com/watch?v=1mDULjSp8ec
https://www.fool.com/investing/2024/04/16/wells-fargo-stock-go-66-wall-street-analyst/
https://www.youtube.com/watch?v=UjnHihbaHLM
https://www.fool.com/investing/2024/04/19/senate-mitch-mcconnell-buy-warren-buffett/
https://www.forbes.com/sites/greatspeculations/2024/05/02/sp-stocks-to-trade-in-may/
https://www.sec.gov/Archives/edgar/data/72971/000007297124000129/wfc-20240331.htm
Copyright © 2024 Tiny Computers (email@tinycomputers.io)
Report ID: RvesNm
Cost: $0.85603
https://reports.tinycomputers.io/WFC/WFC-2024-05-13.html Home