Worthington Enterprises, Inc. (ticker: WOR)
2023-12-16
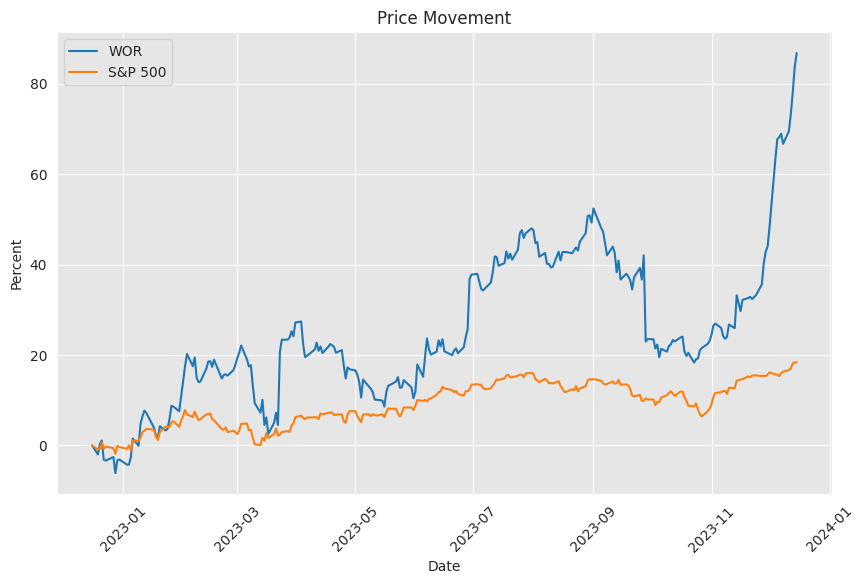
 Worthington Industries, Inc. (ticker symbol: WOR) is a prominent player in the global metals manufacturing industry, best known for its diversified range of steel processing and manufactured metal products. The company focuses on value-added steel processing services and manufactured metal products for a variety of industries, including automotive, construction, aerospace, and many others. As of the last fiscal report, the company has shown resilience in market fluctuations, fostering growth through strategic acquisitions and maintaining a strong focus on innovation and customer service. Worthington Industries prides itself on its longstanding reputation for high-quality products and has positioned itself as a key supplier to several major companies within its target markets. Financially, WOR reports solid earnings and dividends, making it a potential consideration for investors looking for stability and performance within the industrial sector. The company's commitment to sustainable practices and corporate social responsibility is also an integral part of its business model, which may further appeal to socially conscious investors.
| As of Date: 12/16/2023Current | 8/31/2023 | 5/31/2023 | 2/28/2023 | 11/30/2022 | |
|---|---|---|---|---|---|
| Market Cap (intraday) | 2.86B | 3.68B | 2.73B | 2.94B | 2.76B |
| Enterprise Value | 3.21B | 4.02B | 3.26B | 3.61B | 3.53B |
| Trailing P/E | 9.85 | 14.50 | 13.43 | 13.86 | 9.17 |
| Forward P/E | 10.59 | 13.32 | 12.18 | 11.67 | 8.83 |
| PEG Ratio (5 yr expected) | - | - | - | - | - |
| Price/Sales (ttm) | 0.60 | 0.76 | 0.53 | 0.55 | 0.52 |
| Price/Book (mrq) | 1.61 | 2.17 | 1.72 | 1.94 | 1.82 |
| Enterprise Value/Revenue | 0.68 | 3.37 | 2.65 | 3.27 | 3.00 |
| Enterprise Value/EBITDA | 6.14 | 25.17 | 15.72 | 37.44 | 59.24 |
 Based on the provided technical analysis (TA) data for WOR on the last trading day, there are several notable indicators that can shed light on the potential stock price movement in the next few months:
-
MACD (Moving Average Convergence Divergence): With a positive MACD value (4.168406) and a substantial MACD histogram (0.901888), there appears to be considerable bullish momentum. This is often interpreted as an uptrend signal.
-
RSI (Relative Strength Index): An RSI of 90.486 indicates that the stock is in an overbought condition, suggesting that a reversal or pullback might be due in the near term.
-
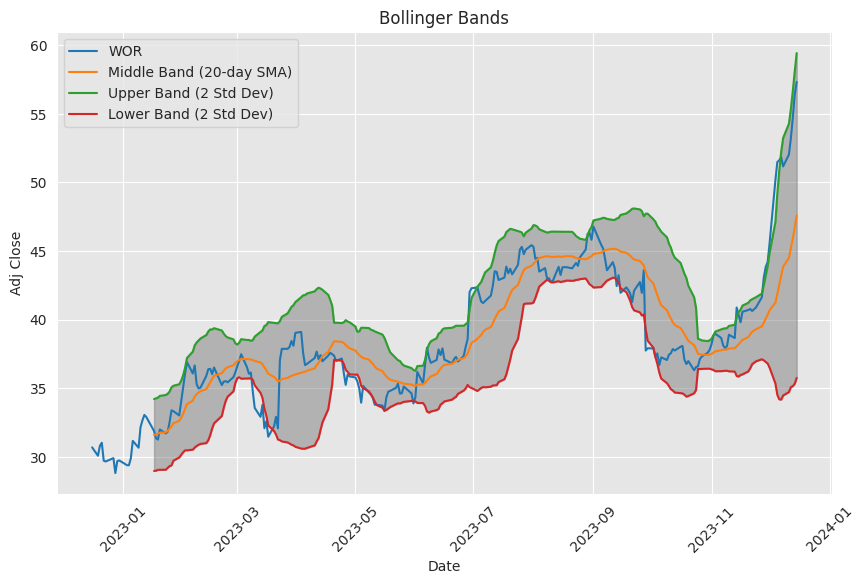
Bollinger Bands: The closing price (57.33) is near the upper Bollinger Band (58.644276), implying the stock is trading at a relative high. This positioning can sometimes precede a mean reversion.
-
SMA (Simple Moving Average) 20 & EMA (Exponential Moving Average) 50: Both are significantly below the last close price, which suggests a strong recent price increase but also raises the potential for a pullback if the longer-term trend has been less bullish.
-
OBV (On-Balance Volume): A high OBV of 2.518978 million suggests that there is a significant volume behind the recent price moves, indicating robust investor interest.
-
Stochastic Oscillators (STOCHk and STOCHd): Extremely high values (96.373117 and 95.676321, respectively) are common signals of overbought conditions, which could mean that a price correction is impending.
-
ADX (Average Directional Index): With an ADX value of 58.308800, a very strong trend is indicated. In conjunction with other indicators, this trend is currently upward.
-
Williams %R (WILLR): At -1.592228, this further suggests overbought conditions, being close to its upper boundary.
-
CMF (Chaikin Money Flow): The positive value (0.196847) indicates there may be buying pressure and that money is flowing into the stock.
-
PSAR (Parabolic SAR): Given the presence of a PSAR level (52.501200), and no PSARs present, the indicator could be hinting at a continuing uptrend.
Considering this data, the recent bullish momentum is clear, however, several overbought indicators suggest the possibility of a bearish reversal in the short term. Long-term investors might look past this volatility, keeping in mind that a TA model suggests only probable outcomes, not guaranteed results.
Moving onto the fundamentals, they provide context for the observed technical patterns:
-
Market Cap & Enterprise Value: There has been a contraction since the 8/31/2023 valuation points, potentially indicating a correction or a revision of future performance expectations.
-
Trailing & Forward P/E Ratios: Currently at reasonable levels, this signals that the stock might not be overvalued fundamentally, contrasting with the overbought technical indicators.
-
PEG Ratio: Not applicable, which offers limited insight into growth.
-
Price/Sales & Price/Book Ratios: Indicate the stock is reasonably valued relative to sales and book value.
-
Enterprise Value Multiples: The significant drop in EV/EBITDA from the previous periods suggests the market is valuing the company's earnings more favorably now.
With these fundamentals in mind, the bullish TA momentum seems to currently outweigh potential overvaluation concerns, but the recent overbought state warrants caution.
In conclusion, we see a strong bullish run in the short-term that may face a correction due to indications of an overbought stock, judging by multiple technical indicators. Yet, by considering the fundamentals, the longer-term outlook suggests that the stock maintains a reasonable valuation relative to its earnings and book value, which may attract investors focused on intrinsic value. As such, the stock price could see a consolidation or slight pullback as traders take profits, followed by a continued upward trend if the fundamentals retain their strength and investor sentiment remains optimistic.
Worthington Industries, Inc. (WOR), acknowledged for its expertise in steel processing and manufacturing of pressure cylinders, such as those used for propane, recently faced a notable decline in stock price subsequent to the release of its fiscal first-quarter earnings report. The downward trajectory in stock value has raised concerns among shareholders and market spectators alike. Financial analysts, including those at The Motley Fool, have scrutinized the company's earnings release, pinpointing a blend of missed revenue forecasts and broader economic concerns as the cardinal reasons for the decline.
In the said quarter, Worthington Industries reported a revenue decrease by 15% year-over-year, tallying up to $1.19 billion, relatively lower than the $1.23 billion projections made by market analysts. This slippage in revenue could be traced back to the steel processing segment, where the company faced lower average selling prices. Additionally, a contraction in overall volumes sold further exacerbated the revenue gap. Despite these challenges, Worthington Industries managed to shore up its gross profit, marking a 17% surge to $197.5 million. The upturn in gross profit was significantly influenced by increased spreads in steel processing and a commendable $17 million gain in the value of inventory holdings. However, these gains were partially negated by a decline in the output of their consumer products division.
In terms of profitability measures, specifically earnings per share (EPS), the company surpassed analysts expectations. Worthington Industries posted adjusted EPS of $2.06, a raise from the $1.61 recorded the previous year, and slightly higher than the anticipated figure by two cents. The CEO, Andy Rose, looked back at the past quarter with a dialectic of challenge and resilience, noting that the firm's teams are resourcefully navigating through the prevailing economic uncertainties. Ensuring stakeholders, Rose echoed the strength of the company's financial stance.
On the strategic front, Worthington Industries is gearing up for a critical transition that seeks to bifurcate the business into two individual entities: Worthington Steel and Worthington Enterprises. This separation is intended to refine both growth and value creation strategies inherent to the newly formed standalone companies. History suggests that corporate spin-offs, such as this, often infuse vigor into market performance and provide investors with renewed opportunities to place their capital in more distinctly focused segments.
At the time under review, market analysts deemed the stock of Worthington Industries as fairly priced in the stock market, marked by a price-to-earnings ratio hovering around 10. This pricing suggests a level of confidence among some market participants in the soundness of the company's fundamentals. The corporate split is anticipated to take place in early December, reflecting an evident strategic vision by the companys management. However, for the approaching quarter, detailed guidance was not provided by Worthington. Instead, it was hinted that economic headwinds could persist, particularly affecting the consumer segment as well as the broader industry landscape.
The financial presentation of Worthington Industries in the recent quarter underscores the turbulent state of manufacturing entities, which are bracing against erratic commodity prices and swings in consumer demand. The drop in stock price after the earnings announcement is a reflective market response to the uncertainties clouding the firm's revenue channels. Nonetheless, the company's ability to raise profit margins and preserve efficiency in its operations has not gone unnoticed.
Through the imminent company division, Worthington Industries aims to achieve streamlined operations. The forthcoming split is a significant step to concentrate on each entity's essential expertise within their specific markets. This strategy could potentially magnify shareholder value in the long run. As the company embarks on this transformative journey, analyzing Worthing's strategic maneuvers alongside its adeptness in addressing external economic strains will undoubtedly remain a focal point for investors and industry observers.
Similar Companies in Metals Service Centers and Offices:
Report: Reliance Steel & Aluminum Co. (RS), Reliance Steel & Aluminum Co. (RS), Report: Commercial Metals Company (CMC), Commercial Metals Company (CMC), Report: Nucor Corporation (NUE), Nucor Corporation (NUE), Report: Steel Dynamics, Inc. (STLD), Steel Dynamics, Inc. (STLD)
News Links:
https://www.fool.com/investing/2023/09/28/why-worthington-industries-stock-was-falling-today/
Copyright © 2023 Tiny Computers (email@tinycomputers.io)
Report ID: k8KKTU