Financial Select Sector SPDR Fund (ticker: XLF)
2024-01-27
 The Financial Select Sector SPDR Fund (ticker: XLF) is an exchange-traded fund (ETF) that seeks to provide investment results that correspond generally to the price and yield performance of the Financial Select Sector Index. This index includes companies from the financial services industry, such as banks, insurance companies, real estate, consumer finance, and capital markets. The XLF enables investors to gain broad exposure to the financial sector of the United States equity market, which can be a barometer for the overall health of the economy due to the sector's integral role in financing business operations and consumer activity. Managed by State Street Global Advisors, the fund places assets into stocks that make up the index, proportionally reflecting the performance of the index. As such, XLF is a popular tool for investors looking to gain diversified exposure to the financial sector, while taking advantage of the liquidity and tradability offered by an ETF. Investors often monitor XLF for insights into the performance of the US financial sector and as a component in broader investment strategies. The diversification within XLF across different financial sub-industries can also be a hedge against volatility specific to a single industry, given that it aggregates performance across various financial firms and services.
| Previous Close | 38.51 | Open | 38.45 | Day Low | 38.41 |
| Day High | 38.7179 | Trailing P/E | 17.54 | Volume | 37,448,096 |
| Average Volume | 39,613,718 | Average Volume 10 Days | 45,688,270 | Bid | 38.65 |
| Ask | 38.69 | Bid Size | 40,000 | Ask Size | 27,000 |
| Yield | 1.71% | Total Assets | 34,037,727,232 | 52 Week Low | 30.39 |
| 52 Week High | 38.72 | 50 Day Average | 36.8162 | 200 Day Average | 34.31985 |
| Trailing Annual Dividend Rate | 0.58 | Trailing Annual Dividend Yield | 1.5061% | NAV Price | 38.3259 |
| YTD Return | 1.9149% | Beta 3 Year | 1.06 | Three Year Average Return | 10.16699% |
| Five Year Average Return | 10.50806% | ||||
| Sharpe Ratio | -25.70975599463729 | Sortino Ratio | -378.65043249480595 |
| Treynor Ratio | 0.09243316849415271 | Calmar Ratio | 0.5717334520119427 |
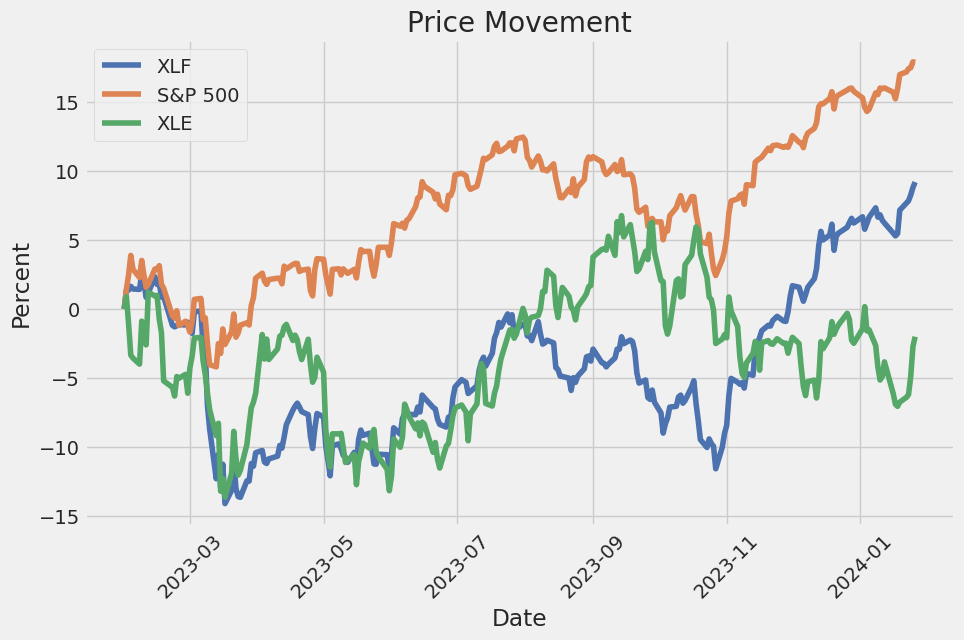
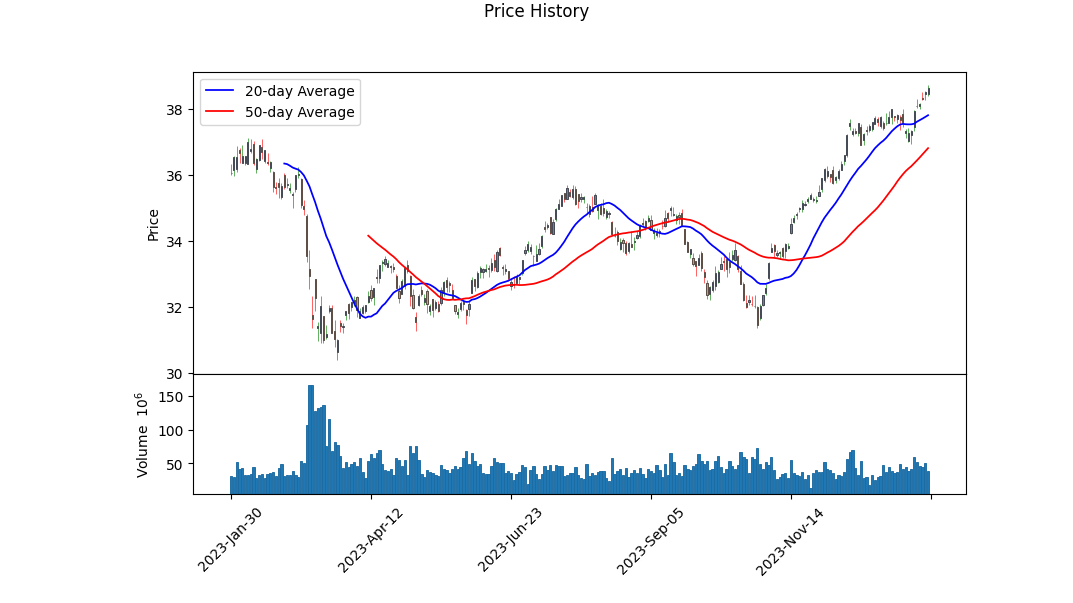
The Financial Select Sector SPDR Fund (XLF) is exhibiting an upward trend, as suggested by key technical indicators such as the On-Balance Volume (OBV), which has increased consistently during the analyzed period. Accompanied by an ascending MACD histogram, these patterns generally signal robust bullish momentum. The positive slope in the MACD histogram towards the end of our timeframe signifies strengthening of this uptrend momentum.
Analyzing the fundamentals of XLF, it is noted that its Price to Earnings (PE) ratio is moderately valued at 17.54 and the fund has a dividend yield of 1.71%, which is indicative of a stable income-generating asset for investors seeking dividends. Additionally, a high net asset value of approximately $34.04B showcases a significant market presence. The fund has been steadily increasing and is currently near its 52-week high, which could alternatively suggest a short-term pullback may be upcoming, as assets rarely move in one direction indefinitely.
Despite the encouraging technical and fundamental factors, the risk-adjusted performance metrics reflect a different aspect. The extremely negative Sharpe and Sortino ratios indicate that the expected return does not compensate for the risk assumed by the investors over the past year. However, the positive Treynor and Calmar ratios suggest a favorable excess market return when systematic risk is considered and a strong performance during periods of market drawdown, respectively.
Based on the evidence presented and in the absence of a significant change in market conditions, the trend for the next few months may be cautiously optimistic for XLF. Market participants should be prepared for potential corrections or consolidations, especially as the securities approach previous resistance levels. Ongoing analysis will be crucial, as changes in market dynamics or macroeconomic factors could swiftly alter the current trajectory of XLF.
Investors are encouraged to continuously monitor both technical patterns and fundamental changes, keeping an eye on interest rates, regulatory shifts in the financial sector, and broad economic indicators that may affect the financial sector specifically. The interplay between volume, price trends, and indicators like the MACD must also be observed closely, as they can provide early signals for potential reversals or continuations of the current trend.
In conclusion, the current technical analysis offers a bullish perspective for XLF, implying potential upward movement in the near term. However, the severely negative risk-adjusted return ratios must be taken into consideration, as they signal underlying volatility and risk that may not be immediately apparent from the price action alone. Investors should balance the technical forecasts with their personal investment strategy, risk tolerance, and the acknowledgment of the dynamic and unpredictable nature of the markets.
| Alpha | -0.0155 |
| Beta | 1.0904 |
| R-squared | 0.744 |
| Adj. R-squared | 0.744 |
| F-statistic | 3,642 |
| Prob (F-statistic) | 0.00 |
| Log-Likelihood | -1,568.2 |
| AIC | 3,140 |
| BIC | 3,151 |
| No. Observations | 1,257 |
| Df Residuals | 1,255 |
| Covariance Type | nonrobust |
In the linear regression model between XLF (the exchange-traded fund tracking the financial sector) and SPY (the ETF tracking the S&P 500 index), alpha represents the intercept of the regression line. With an alpha of approximately -0.0155, it suggests that XLF underperforms the general market by -1.55% when SPY's return is zero; this is under the assumption that the relationship is indeed linear and historically applicable. However, the statistical significance of alpha is not very strong, as indicated by the p-value (greater than 0.05). This implies that there's insufficient evidence to conclude that XLF's alpha is significantly different from zero, as it could be due to random chance.
Beta, on the other hand, measures the sensitivity of XLF's returns to the returns of SPY. A beta of 1.0904 indicates that for every 1% change in SPY's return, XLF's return changes by approximately 1.09%. This suggests a positive correlation and indicates that XLF is slightly more volatile than the market. The R-squared value of 0.744 demonstrates that a significant portion (74.4%) of XLF's movements can be explained by SPY's movements, indicating a strong relationship. The adjusted R-squared value confirms the strength of the model after accounting for the number of predictors. The F-statistic and associated probability provide evidence that the model is statistically significant.
The Financial Select Sector SPDR Fund (XLF) is a critical barometer for the health of the financial sector, encapsulating the movements and performances of leading financial institutions, such as banks, insurers, and investment companies. As an ETF, it provides an excellent proxy for those interested in gauging the sector's pulse and potentially capitalizing on the upward and downward ticks of industry giants.
| company | symbol | percent |
|---|---|---|
| Berkshire Hathaway Inc Class B | BRK-B | 12.48 |
| JPMorgan Chase & Co | JPM | 9.45 |
| Visa Inc Class A | V | 7.98 |
| Mastercard Inc Class A | MA | 6.79 |
| Bank of America Corp | BAC | 4.46 |
| Wells Fargo & Co | WFC | 3.44 |
| S&P Global Inc | SPGI | 2.74 |
| The Goldman Sachs Group Inc | GS | 2.42 |
| Morgan Stanley | MS | 2.27 |
| BlackRock Inc | BLK | 2.18 |
Notably, according to a report discussed by Yahoo Finance on December 27, 2023, JPMorgan Chase is now more valuable than Bank of America and Citigroup combined. This remarkable evaluation underscores JPMorgan's definitive role in the XLF, with its CEO Jamie Dimon steering the banking giant towards projected profits on par with the GDP of some nations. JPMorgan Chase's approach to traditional banking fundamentals helped cushion it against rising interest rates, giving it a competitive edge as seen in its acquisition of First Republic Bank, emphasizing the importance of scale and negotiation in the financial arena.
In sharp contrast, Citigroup and Wells Fargo faced restructuring and regulatory challenges, respectively, while Bank of America dealt with unrealized bond losses that could spell future earnings difficulties. With the banks differing in their responses to recent financial struggles, the diversification within the XLF ETF becomes an attractive feature for investors, offering a balanced exposure to the sector's highs and lows.
Delving into the nuances of the sector, the existence of varied performance across banks points to an intriguing dynamic within the XLF holdings. The acquisition strategies of larger banks, combined with the adaptability demonstrated by these institutions even amidst changing interest rate landscapes, suggests robust potential growth within this ETF's sphere. The analysis shared on Yahoo Finance concludes with JPMorgan Chase, one of XLF's top holdings, poised to sustain or exceed its record profits in the coming yeara prospect closely watched by investors.
Link to the source: Yahoo Finance Video - JPMorgan now valued more than BofA, Citi combined.
Looking ahead into 2024, insights gleaned from a Zacks.com article foresee the financial sector, along with ETFs like XLF, navigating through modest inflation and resilient consumer markets. This outlook, combined with potential earnings pressures and regulatory shifts favoring the ETF format, paints a realistic but cautiously optimistic picture for the financial domain and its investors. XLF's blend of diverse financial institutions grants it a certain resilience to sector-specific shocks, promising adaptability in an environment where macroeconomic pressures and earnings dynamics coexist. The trends highlighted in the Zacks predictions offer strategic considerations for those with stakes in the robust financials ETF.
For detailed insights, investors can refer to the article "5 ETF Predictions for 2024" on Zacks.com.
Active participation of investors in XLF is evidenced by its inclusion in the 10 most actively traded ETFs in the fourth quarter of 2023. High trading volumes underscore the ETF's liquidity, and its low expense ratio bolsters its appeal as an economical entry point into the financial industry. The Zacks ETF Rank of #1 (Strong Buy) combined with a Medium risk outlook further attests to its performance potential relative to peers. Such evident interest from the investment community reinforces the XLF's position as a liquid, cost-effective, and potentially lucrative instrument at the forefront of the financial sector ETF market.
For a comprehensive look into the active world of ETFs, including XLF, Zacks.com offers a detailed analysis here.
Given the Santa Claus rally, an annual upsurge in stock prices during the year's last week, the spotlight on XLF during this period couldnt be brighter. With financial sector ETFs like XLF nearing their 52-week high, investors are presented with an appealing P/E ratio indicative of undervaluation, potentially setting the stage for gains in the near term. Market expectations of interest rate movements also seem to support a favorable outlook for financial sector stocks overall, with XLF among those positioned to benefit.
To explore these opportunities, the original Zacks article "5 Top-Ranked ETFs to Tap Amid Ongoing Santa Rally" can provide additional information [Source: Zacks.com].
Spanning back to its inception on December 16, 1998, the XLF ETF has evolved into a leading vehicle for financial sector investment. It's not only large with assets exceeding $32.49 billion but also efficient, reflecting the sector in a low-cost manner. The XLF's expansive portfoliowell-diversified with a mix of industry-leading namesdemonstrates its aim to mitigate company-specific risk while capitalizing on sector growth. For investors considering diversification into finance-focused equities, XLF offers a blend of significant sector exposure, competitive operating expenses, and impressive performance history.
The Zacks ETF Center provides an analysis worth delving into here.
As we step into the new shades of 2024's financial landscape, the Federal Reserve's evolving stance on inflation and interest rates have placed financials like XLF in an opportune light. The nuances discussed on Yahoo Finance suggest that banks may offer an avenue for growth, despite the uncertainty surrounding the rate environment. The changing interest rate scenario accentuates the sectors' capacity to adapt to a progressively more dynamic financial atmosphere, outlining the plausible development pathways for banks and, by extension, for investments like XLF.
For a deep dive into the financial sector's prospects, access the full analysis on Yahoo Finance here.
Despite a general downturn, XLF has emerged robustly at the start of 2024, signaling investor confidence where it matters. As part of a selected group of ETFs that have scaled new peaks, XLF's strong performance suggests that financials could weather broader market weaknesses, and thus, it remains an area of interest for investors looking to hedge against or take advantage of such market trends.
For a comprehensive look into ETF performances at the beginning of 2024, see the full article on Yahoo Finance here.
Shifting the spotlight back to individual performances, the diverse behavior of ETFs in early 2024 points to an exciting run for the Financial Select Sector SPDR Fund. The tendency towards falling interest rates has enhanced XLF's standing, illustrating the adaptability and responsiveness of the financial sector in changing macroeconomic climates. Bearing witness to the shifts in investor preferences and the burgeoning growth of sectors like India and Japan, investors are reminded of the stratified trajectories within the ETF space as it adapts to global economic movementsa story encapsulated within XLF's rally driven by expectations of changing interest rates and sector transformations.
Read the entire analysis on Zacks.com here.
Setting the stage for 2024, the investment environment presents a spectrum of opportunities as captured by various ETFs, including XLF. The strategic positioning of XLF in response to the anticipated interest rate cuts and corresponding adjustments in the banking sector paints a picture of a potentially profitable year for those invested in the financial sector ETFs. As detailed in the Zacks analysis, XLF exemplifies a significant player in this scenario, offering a promising option for investors anticipating guidance from the Federal Reserve to mold their investment strategies in the new year.
For further analysis on the outlook for ETFs in 2024, Zacks.com's article is an invaluable resource here.
As Zacks.com adeptly highlights, the transition from the 2023 "Magnificent Seven" to the emerging 2024 "Fab Four" offers new opportunities and spotlight stocks within the financial sector. Visa Inc., which XLF covers, is part of this new breed, demonstrating impressive growth and returning shareholder value through dividends and buybacks. Along with the other three of the "Fab Four," these stocks represent the evolving market leadership that is primed to influence the performance of XLF and equivalent fundsshowing potential for smart investments for those watching the tides of market shifts.
To read more about the "Fab Four" stocks, visit the full article on Zacks.com.
Earnings are a bellwether for financial health, and the incoming season for the S&P 500 is no exception. While the wider market braces for modestly declining earnings, technology sprung forward with substantial growth. The positive earnings growth in the financial sector paints a favorable image for the Financial Select Sector SPDR Fund. XLF, which replicates the performance of the Financial Select Sector Index, boasts a broad spectrum coverage of the industry and a promising Zacks ETF Rank #1. Investors examining the prospect of banking and financial services can look into the attributes of XLF to capture potential sector gains within the anticipated earnings environment.
The full article by Zacks.com provides deeper insights here: https://www.zacks.com/stock/news/2207494/5-sector-etfs-to-bet-on-ahead-of-q4-earnings.
An article from Zacks Analyst Blog, referencing the performance and prospects of ETFs like XLF at the start of 2024, sets the groundwork for understanding the investment landscape marked by cautious postures and potential opportunities in perceived undervalued stocks. XLF's strong rally, underpinned by the prospect of declining interest rates, fortifies its role within the financial realm, bolstering its appeal to investors. The details shared regarding the healthcare, value, India, and Japan ETFs complement the narrative for XLF, offering insights into prevailing market performances that shine a light on the diversified yet interconnected world of ETFs and their sectors.
For an in-depth perspective, consult the Zacks Investment Research analysis here.
In anticipation of the fourth quarter 2023 earnings season, the mixed forecasts situate the Financial Select Sector SPDR Fund (XLF) in a strategic position. With eight out of sixteen Zacks sectors predicted to show earnings growth, and technology sector estimates leading at 18.8%, the technology and financial sectors emerge as key players. XLF offers unique broad coverage, and with its positioning and Zacks ETF Rank #1, it stands as a compelling option for investors. Accompanied by ETFs like XLK, VCR, VPU, and XRT, each carrying its own Zacks ETF Rank, a diversified investment strategy seems more pressing than ever.
The analysis by Zacks.com provides further insights into this investment strategy here.
Event-driven market movements are crucial for investors to track, especially when it comes to sector-focused ETFs like XLF. Economic indicators and corporate performance dictate the fluctuating fortunes of such funds. As Morgan Stanley and Goldman Sachs gear up to report financial results against the backdrop of retail data and geopolitical events, the market takes cues from these occurrences to guide investment strategies. In this matrix of varying macroeconomic factors, investors perpetually weigh the potential impacts on funds like XLF, which remain sensitive to industry-specific trends and broad market sentiments.
Myles Udland's Yahoo Finance article can be accessed for further guidance here.
The financial health of banking institutions within the XLF fund is continually scrutinized. As demonstrated by banks like Morgan Stanley, Citibank, Bank of America, and Wells Fargo, financial performance can have peculiar effects on stock valuations. Even in the face of losses due to one-off charges, investor confidence in underlying bank performances, such as Citibank's clearer guidance and expense projections, can be perceived as strong indicators of resilience. This adaptation in guidance and a prudent path toward future profit estimations are valuable signals to stakeholders within the XLF fund.
The analysis from the video discussion offers a detailed perspective on the banks' financial performance and future outlook.
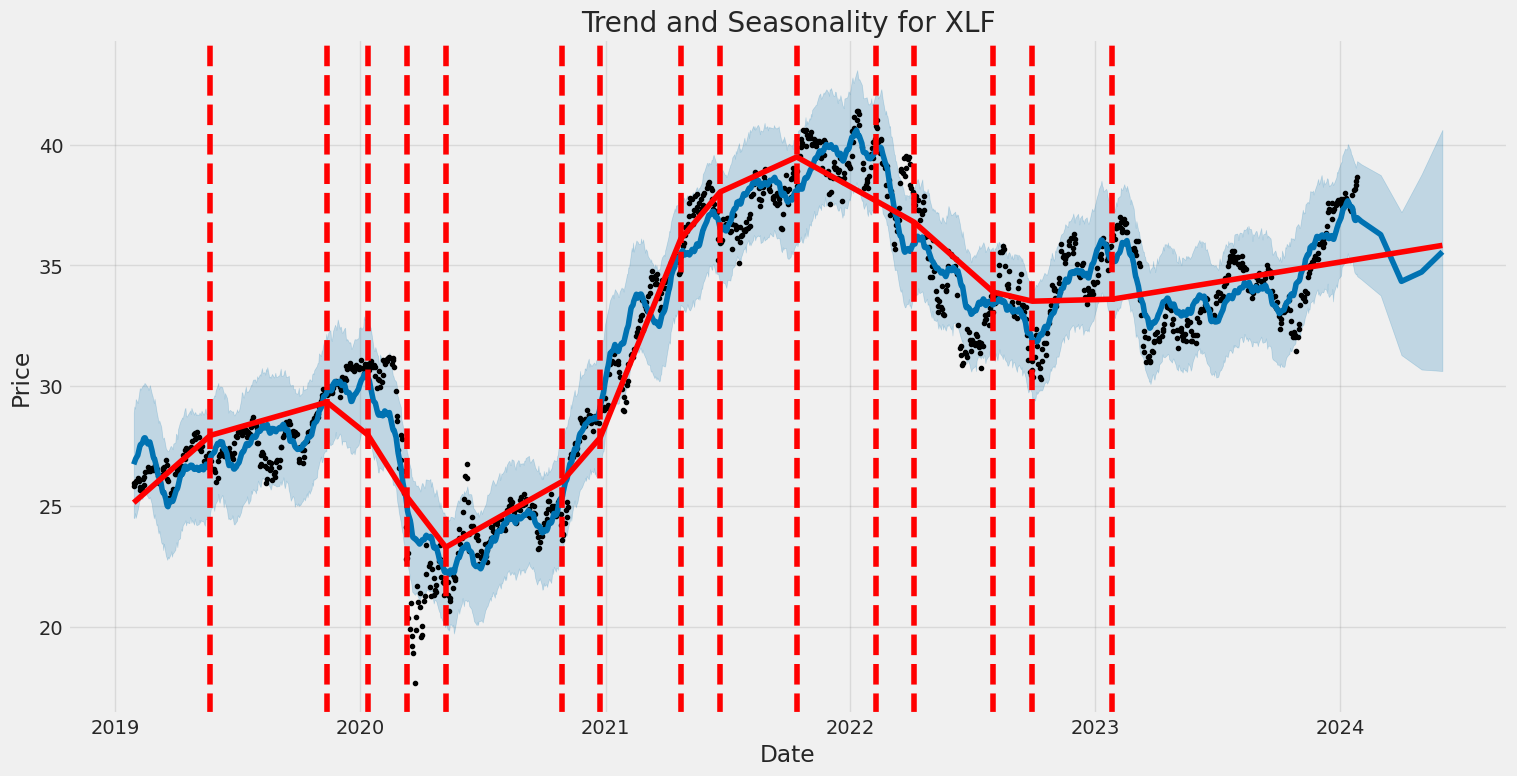
The volatility of the Financial Select Sector SPDR Fund (XLF) over the period from January 2019 to January 2024 suggests a dynamic and unpredictable performance. The statistical analysis indicates that there is a significant level of volatility within the fund, with no clear trend in returns (as implied by the zero R-squared value). The ARCH model, which helps to measure and forecast this volatility, points to frequent and sizable fluctuations, with specific parameters (omega and alpha) indicating a relatively high baseline volatility and a significant impact of past returns on current volatility.
| Statistic Name | Statistic Value |
|---|---|
| R-squared | 0.000 |
| Adj. R-squared | 0.001 |
| Log-Likelihood | -2,203.35 |
| AIC | 4,410.70 |
| BIC | 4,420.98 |
| No. Observations | 1,257 |
| Df Residuals | 1,257 |
| omega | 1.2661 |
| alpha[1] | 0.5074 |
Analyzing the financial risk of a $10,000 investment in the Financial Select Sector SPDR Fund (XLF) requires a nuanced approach that captures both the historical volatility patterns and anticipates possible future returns. By employing volatility modeling and machine learning predictions in tandem, we can achieve a comprehensive assessment of the risks involved over a one-year period.
The assessment begins by understanding the underlying volatility of the investment vehicle. Volatility modeling, particularly the Generalized Autoregressive Conditional Heteroskedasticity (GARCH) approach, serves as a statistical tool to gauge the persistent nature of variance observed in financial time series, such as stock returns. In practice, this model identifies periods of potential volatility clustering instances when high volatility events are followed by high volatility, and low volatility events tend to follow low volatility. By fitting this model to the historical returns of XLF, we extrapolate the conditional variance, which effectively informs us of the expected levels of fluctuation in stock returns.
On the other side of the analytical spectrum, machine learning predictions, such as those derived from a RandomForestRegressor, contribute forward-looking insights into the expected performance of the fund. This algorithm operates by constructing a multitude of decision trees during the training phase and outputting the mean prediction of the individual trees. It captures the nonlinear relationships in the data, enabling the prediction of future returns based on the observed characteristics and historical performance patterns of the stock. Factors such as market trends, economic indicators, and sector-specific news can be incorporated into the machine learning model to enrich the analysis further.
Bringing together both historical volatility and future return predictions, we arrive at a probabilistic measure of risk known as the Value at Risk (VaR). VaR quantifies the maximum expected loss over a specific time period given a confidence interval in this context, a 95% confidence interval implies that we are statistically expecting only a 5% chance of exceeding this calculated loss. Using the integrated data from both volatility modeling and machine learning predictions, and focusing on a one-year investment horizon, the derived VaR indicates that there is a 95% confidence of not experiencing a loss greater than $161.44 on the initial $10,000 investment in XLF.
This metric crystallizes the potential exposure to adverse market conditions and offers a direct financial interpretation of risk. However, one must bear in mind that both analytical techniques come with inherent limitations volatility modeling may not fully account for sudden, structural changes in the market, while machine learning predictions are as good as the data and assumptions that underlie their algorithms. Nevertheless, the calculated VaR remains a critical figure, guiding investors on the potential downside of their equity investments and illustrating the value of integrating sophisticated modeling and prediction tools in financial risk analysis.
Similar Companies in None:
Report: Energy Select Sector SPDR Fund (XLE), Energy Select Sector SPDR Fund (XLE), Technology Select Sector SPDR Fund (XLK), Health Care Select Sector SPDR Fund (XLV), Industrial Select Sector SPDR Fund (XLI), Consumer Staples Select Sector SPDR Fund (XLP), Vanguard Financials ETF (VFH), Report: iShares U.S. Financials ETF (IYF), iShares U.S. Financials ETF (IYF), Report: Invesco KBW Bank ETF (KBWB), Invesco KBW Bank ETF (KBWB), Report: Fidelity MSCI Financials Index ETF (FNCL), Fidelity MSCI Financials Index ETF (FNCL), SPDR S&P Bank ETF (KBE), iShares U.S. Financial Services ETF (IYG), Report: iShares U.S. Regional Banks ETF (IAT), iShares U.S. Regional Banks ETF (IAT), SPDR S&P Insurance ETF (KIE)
https://www.zacks.com/stock/news/2201106/10-most-actively-traded-etfs-of-q4
https://www.zacks.com/stock/news/2201429/5-etf-predictions-for-2024
https://www.zacks.com/stock/news/2202101/5-top-ranked-etfs-to-tap-amid-ongoing-santa-rally
https://finance.yahoo.com/video/jpmorgan-now-valued-more-bofa-173014102.html
https://finance.yahoo.com/video/economic-factors-indicate-soft-landing-213820775.html
https://finance.yahoo.com/news/5-power-packed-etfs-buy-151100614.html
https://www.zacks.com/stock/news/2207009/5-etf-zones-scaling-new-highs-at-the-start-of-2024
https://finance.yahoo.com/news/5-etf-zones-scaling-highs-150000210.html
https://www.zacks.com/stock/news/2207494/5-sector-etfs-to-bet-on-ahead-of-q4-earnings
https://finance.yahoo.com/news/5-sector-etfs-bet-ahead-150000383.html
https://finance.yahoo.com/news/zacks-analyst-blog-highlights-xlf-160000375.html
https://www.youtube.com/watch?v=eFJiRTy1gVE
Copyright © 2024 Tiny Computers (email@tinycomputers.io)
Report ID: Wr0jErQ
Cost: $0.75744
https://reports.tinycomputers.io/XLF/XLF-2024-01-27.html Home