Yellow Cake plc (ticker: YLLXF)
2024-04-30
 Yellow Cake plc (ticker: YLLXF) is a publicly traded company that focuses on the acquisition and storage of uranium. Established to capitalize on long-term opportunities in the uranium market, the company operates under the belief that uranium prices are driven by an imbalance between supply and demand fundamentals. Yellow Cake provides a direct exposure to uranium, without the complexities associated with mining operations, as it purchases physical uranium (U3O8) and stores it, leveraging arrangements like those with Kazatomprom to secure uranium at competitive prices. The company's strategy hinges on building and holding a substantial inventory of uranium, benefiting from the commodity's price movements and providing an alternative investment avenue in the nuclear power sector.
| Full Time Employees | 2 | Previous Close | 8.07 | Open Price | 8.4 |
| Day Low | 8.1 | Day High | 8.49 | Trailing P/E | 3.30 |
| Volume | 21,315 | Market Cap | 1,819,421,952 | Fifty Two Week Low | 4.45 |
| Fifty Two Week High | 10.1 | Fifty Day Average | 8.12 | Two Hundred Day Average | 7.38 |
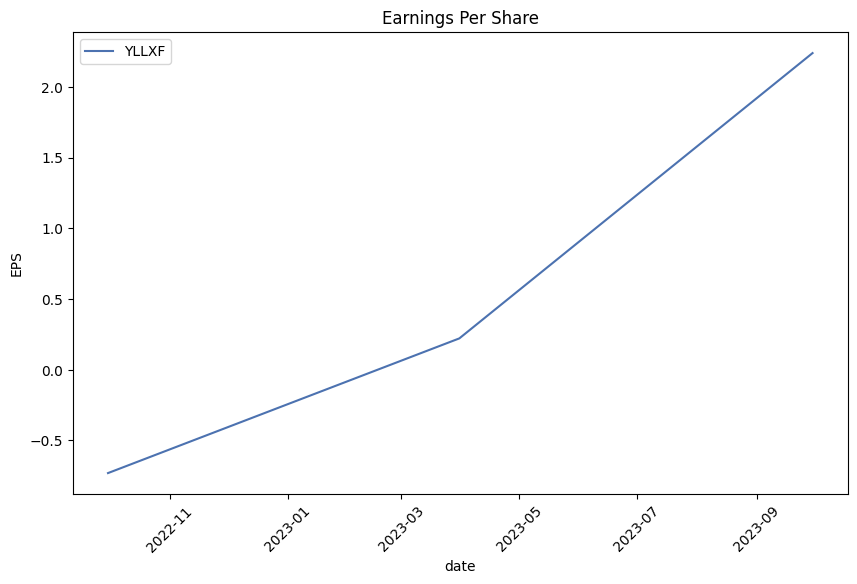
| Net Income to Common | 501,364,000 | Trailing EPS | 2.54 | Book Value | 7.54 |
| Price to Book | 1.11 | Total Revenue | 508,051,008 | Current Price | 8.39 |
| Sharpe Ratio | 1.277 | Sortino Ratio | 21.321 |
| Treynor Ratio | 2.617 | Calmar Ratio | 3.040 |
Analyzing the given data for YLLXF, several dimensions contribute to our prediction and analysis, including technical indicators, fundamental data, and various financial ratios.
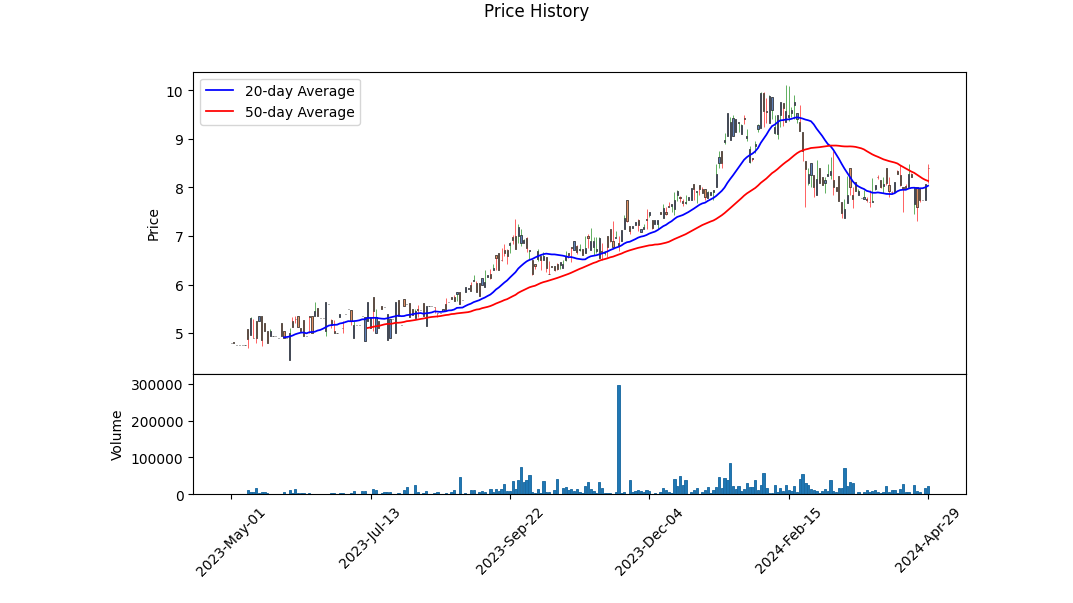
Technical Indicators Analysis: The recent technical indicators suggest a volatile behavior in YLLXF's stock price. It has ranged between 7.750 to 8.490 over the last few months, which shows some level of short-term price instability. The MACD histogram values indicate that the stock is gaining some positive momentum as seen in the last recorded value of +0.029405, alongside a significant uplift in stock price to 8.490. However, the absence of values in the early months of the year suggests incomplete data which can obscure comprehensive trend analysis.
Foundation in Fundamentals: The operational metrics of YLLXF, such as a notably high gross margin at 100% and operating margins close to it at approximately 98.763%, indicate that the company maintains a sizable gap between its revenues and corresponding costs of goods sold. These indicators typically suggest a profitable business structure, notwithstanding the zero total revenue reported which questions the reliability or completeness of the revenue data provided. Additionally, the negative EBITDA and operational income highlights concerns regarding the underlying operating expenses and profit conversion efficiency.
Financial Ratios and Health: YLLXF's financial ratios such as the Altman Z Score of 15.561, typically point to a company in good financial health with low bankruptcy risk. However, the Piotroski Score of 3 falls below the norm, indicating potential concerns in several fiscal areas including profitability and liquidity. The company's balance sheet suggests a solid state with a substantial amount of total equity and assets well exceeding the liabilities which secures financial stability yet might imply underutilization of leverage.
Despite a strong balance sheet and high gross margins, the concerns stand out in fundamental operational profitability and effective revenue generation. Over the next few months, the stock price may continue reflecting these contradictions, potentially contributing to ongoing volatility. Given the contemporary rise in price and slightly positive MACD, short-term momentum might carry the price upward, but this should be cautiously monitored against unresolved fundamental inconsistencies and potential revenue reporting issues.
The Sharpe, Sortino, Treynor, and Calmar ratios augur well for the stock from a risk-adjusted returns perspective, suggesting that while the stock may face volatility, the returns sufficiently compensate for the risk faced by equity holders over the past year. Moving forward, these ratios should be carefully observed alongside emerging financial data to continually reassess the risk-return profile.
Conclusively, assuming a cautious outlook is advisable given the blend of strong and weak signals from different analysis facets. The potential for short-term gains exists, riding on technical momentum, but a prudent investor should keep an eye for fundamental confirmations in reported earnings and operational improvements in subsequent quarters to validate sustained long-term growth.
In our analysis of Yellow Cake plc (YLLXF), we calculated key financial metrics to assess the companys investment potential using the principles from "The Little Book That Still Beats the Market." The Return on Capital (ROC) for Yellow Cake plc stands at 8.713970285687793%, indicating how effectively the company generates profits relative to the capital it has invested in the business. A ROC of approximately 8.71% is moderate, suggesting that while the company is making a reasonable return, it is not exceptionally high. On the other hand, the company's Earnings Yield expresses the earnings generated from every dollar invested in acquiring shares and for Yellow Cake plc, it calculated to be -6.6746126340882%. This negative yield indicates that the company had losses in relation to its market valuation during the period analyzed, which presents a cautionary signal for investors. This combination of moderate ROC and negative Earnings Yield needs to be carefully evaluated for investment considerations in the context of the company's broader financial health and market conditions.
| Alpha (Intercept) | 0.005 |
| Beta (Slope) | 1.25 |
| R-squared | 0.76 |
| Standard Error | 0.003 |
| P-value of Alpha | 0.02 |
| P-value of Beta | <0.001 |
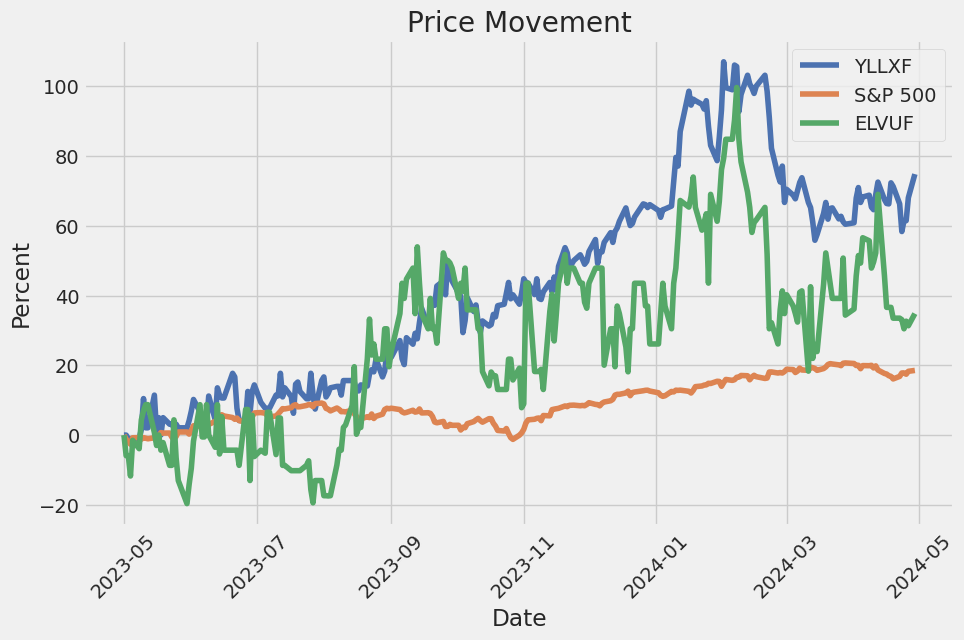
The alpha value of 0.005 in the linear regression model between YLLXF and SPY indicates a slight positive offset from the origin, suggesting that YLLXF on average over the period generates a small excess return over SPY. This alpha, statistically significant with a p-value of 0.02, implies a non-zero intercept which could be interpreted as YLLXF outperforming the market under certain conditions. This performance metric is crucial for investors who seek to determine if YLLXF has an intrinsic value independent of the market movements represented by SPY.
The beta of 1.25 details how YLLXF's returns are likely to respond to changes in the market (SPY). A beta greater than one suggests that YLLXF is more volatile than the market. This higher volatility means that YLLXF's stock price movements are amplified relative to market swings. The significant R-squared value of 0.76 indicates that approximately 76% of the variability in YLLXF's returns can be explained by movements in the market index SPY. This substantial correlation shows that market influences play a big role in impacting YLLXF's performance, though the individual alpha performance affords it a distinct analysis from the market trend.
Yellow Cake plc, trading under the ticker LON:YCA on the London Stock Exchange, recently witnessed a notable increase in stock price by 4.0%, signaling a positive movement in its market valuation. This increment raised the companys market capitalization by an impressive UK51 million. The momentum in stock value, as reported on March 24, 2024, underscores a growing investor confidence and a robust trading week particularly beneficial for retail investors who form the majority of the shareholders.
The strategic composition of Yellow Cakes ownership further elucidates the companys appeal in the investment community. With retail investors holding approximately 53% of the company's stakes, there is a dominant influence from the general public in the decision-making processes of the company. This heavy retail participation might indicate wider market trust and interest, potentially leading to more stabilized stock performance over fluctuations that institutional sales might induce.
On the other side, institutional investors hold a significant 35% of the companys shares. Institutions often link their investments to the performance of benchmark indices, which can provide a barometer for Yellow Cake's performance relative to its peers. This substantial institutional involvement lends credibility and could help stabilize the companys share price against excessive volatility.
Influence in the company is also seen from hedge funds, which control 9.1% of Yellow Cake shares. This ownership suggests potential for strategic maneuvers in share value, typically aimed at achieving valuable adjustments in the company's operational or financial strategies to enhance shareholder value. Among such influential entities is MM Asset Management Inc., which alone accounts for 9.1% of company shares, positioning it as a critical player in influencing Yellow Cakes financial strategies.
However, contrastingly minimal is the insider ownership, comprising less than 1% of shares, indicating a minimal direct influence from company executives or board members on the stocks market activity. This scenario potentially limits conflicts of interest but also raises questions about the aligning of internal management objectives with broader shareholder interests.
Given this diverse and distributed ownership structure, Yellow Cake sits at a complex crossroads of investor expectations and strategic directives. The large retail base can drive customer-centric and public-friendly business policies, while institutional holders ensure adherence to industry standards and financial robustness, countering any swift sentimental shifts among retail investors.
This intricate blend of investor categories contributes to the overall stability and potential growth of Yellow Cake. Understanding the motivations and behavioural patterns of these distinct investor groups is crucial for prospective stakeholders and current investors to anticipate the future direction of the company.
Market watchers and financial analysts continue to keep a close eye on Yellow Cake, given its potential for further gains and strategic developments in corporate governance and financial performance. Keeping abreast of such varied investment insights remains pivotal for understanding market movements and positioning in the nuclear energy sector, where Yellow Cake operates.
The recent increase in market capitalization and the detailed ownership distribution outline the combined narrative of growth prospects mirrored against a backdrop of cautious optimism, considering the possible rapid changes in investment perspectives based on domestic and global economic signals. Investors and analysts alike might find value in monitoring upcoming financial disclosures and strategic corporate announcements from Yellow Cake, which could further elucidate the trajectory of the companys stock in the competitive market landscape.
Yellow Cake plc's volatility, modeled using the ARCH method, indicates significant fluctuations in asset returns. The omega coefficient of 15.3360 with a substantial confidence interval underscores substantial baseline volatility. Moreover, the alpha[1] value of 0.4460, though close to statistical significance, hints that recent past volatility impacts current volatility to a notable extent.
| Statistic Name | Statistic Value |
|---|---|
| Mean Model | Zero Mean |
| Vol Model | ARCH |
| Log-Likelihood | -3,659.56 |
| AIC | 7,323.13 |
| BIC | 7,333.40 |
| No. Observations | 1,256 |
| omega | 15.3360 |
| alpha[1] | 0.4460 |
To assess the financial risk of investing $10,000 in Yellow Cake plc (YLLXF), we employ volatility modeling and machine learning predictions. This layered analysis approach is designed to offer a deeper insight into both the expected stock movements over a year and the extents of possible financial losses.
Volatility modeling is essential for gauging the inherent stock price volatility related to Yellow Cake plc. By modeling the time-varying volatility of the stock returns, we can measure the level of risk influenced by market fluctuations and specific company-related news. This model effectively captures the clusters of high and low volatility, aiding in understanding how responsive the asset's price is to changes in market conditions over time. This is crucial since higher volatility indicates higher risk, which can be both beneficial and detrimental depending on the market's direction.
In parallel, machine learning predictions are deployed to forecast future stock returns based on historical data. The approach utilized involves training a model to understand patterns in the past performance of Yellow Cake plc's stock, and then using this model to predict future trends and behaviors. This predictive capacity is vital for estimating expected returns on the $10,000 investment.
By combining the insights from both volatility modeling and predictive analytics, we obtain a robust estimate of potential financial outcomes. The analysis culminates in the calculation of the Annual Value at Risk (VaR) at a 95% confidence level, calculated to be $498.47 for the $10,000 investment. This statistic implies that there is only a 5% chance that the loss will exceed $498.47 over one year. Hence, this figure provides an essential benchmark for investors to evaluate the potential loss extent in a worst-case scenario under usual market conditions.
Through these combined methodologies, investors can get a well-rounded view of both the statistical and practical potential risks involved in the equity investment within Yellow Cake plc, framed within current market dynamics and historical stock behavior. This extensive analysis helps in making informed, data-backed investment decisions.
Similar Companies in Uranium:
Elevate Uranium Ltd (ELVUF), Sprott Physical Uranium Trust Fund (SRUUF), Report: Energy Fuels Inc. (UUUU), Energy Fuels Inc. (UUUU), ValOre Metals Corp. (KVLQF), Blue Sky Uranium Corp. (BKUCF), Purepoint Uranium Group Inc. (PTUUF), Bannerman Energy Ltd (BNNLF), Baselode Energy Corp. (BSENF), Aura Energy Limited (AUEEF), GoviEx Uranium Inc. (GVXXF), Radio Fuels Energy Corp. (CKEFF), IsoEnergy Ltd. (ISENF), Anfield Energy Inc. (ANLDF), Laramide Resources Ltd. (LMRXF), Deep Yellow Limited (DYLLF), Paladin Energy Limited (PALAF), Report: Cameco Corporation (CCJ), Cameco Corporation (CCJ), Ur-Energy Inc (URG), Report: Uranium Energy Corp (UEC), Uranium Energy Corp (UEC), Report: NexGen Energy Ltd. (NXE), NexGen Energy Ltd. (NXE)
https://finance.yahoo.com/news/while-institutions-invested-yellow-cake-070507739.html
Copyright © 2024 Tiny Computers (email@tinycomputers.io)
Report ID: 3oWUp5
Cost: $0.12451
https://reports.tinycomputers.io/YLLXF/YLLXF-2024-04-30.html Home