Arcos Dorados Holdings Inc. (ticker: ARCO)
2024-05-15
 Arcos Dorados Holdings Inc. (ticker: ARCO) is a significant player in the fast-food industry, particularly known as the largest independent McDonald's franchisee in the world by system-wide sales and number of restaurants. Headquartered in Montevideo, Uruguay, the company operates and franchises McDonald's restaurants across Latin America and the Caribbean, encompassing 20 countries and territories. Since its inception in 2007, Arcos Dorados has leveraged its extensive reach to tap into emerging markets, driving substantial growth in both urban and rural areas. The company focuses on adapting the iconic McDonald's brand to local tastes and preferences, which includes menu customization and community involvement initiatives. Recently, Arcos Dorados has also embraced sustainability efforts and digital transformation, aiming to enhance customer experience while promoting environmental stewardship. Financially, ARCO has shown resilience, navigating economic fluctuations in its diverse operating regions through strategic cost management and innovative marketing.
| Previous Close | 11.21 | Open | 10.88 | Day Low | 10.406 |
| Day High | 11.02 | Regular Market Previous Close | 11.21 | Regular Market Open | 10.88 |
| Regular Market Day Low | 10.406 | Regular Market Day High | 11.02 | Dividend Rate | 0.24 |
| Dividend Yield | 0.0214 | Ex-dividend Date | 1,719,187,200 | Payout Ratio | 0.2209 |
| Beta | 1.261 | Trailing PE | 12.290697 | Forward PE | 10.57 |
| Volume | 3,768,148 | Regular Market Volume | 3,768,148 | Average Volume | 1,213,811 |
| Average Volume (10 days) | 877,310 | Bid | 10.57 | Ask | 10.59 |
| Bid Size | 1,300 | Ask Size | 1,800 | Market Cap | 2,230,597,632 |
| 52-Week Low | 8.32 | 52-Week High | 13.2 | Price to Sales Trailing 12 Months | 0.51492625 |
| 50-Day Average | 11.102 | 200-Day Average | 10.9879 | Trailing Annual Dividend Rate | 0.19 |
| Trailing Annual Dividend Yield | 0.016949153 | Enterprise Value | 3,829,979,136 | Profit Margins | 0.04185 |
| Float Shares | 124,126,334 | Shares Outstanding | 130,655,000 | Shares Short | 4,038,503 |
| Shares Short Prior Month | 3,138,757 | Shares Percent of Shares Out | 0.019199999 | Held Percent Insiders | 0.03129 |
| Held Percent Institutions | 0.44676998 | Short Ratio | 3.23 | Short Percent of Float | 0.0352 |
| Implied Shares Outstanding | 211,031,008 | Book Value | 2.446 | Price to Book | 4.3213406 |
| Last Fiscal Year End | 1,703,980,800 | Next Fiscal Year End | 1,735,603,200 | Most Recent Quarter | 1,703,980,800 |
| Earnings Quarterly Growth | 0.024 | Net Income to Common | 181,274,000 | Trailing EPS | 0.86 |
| Forward EPS | 1.0 | PEG Ratio | 0.29 | Enterprise to Revenue | 0.884 |
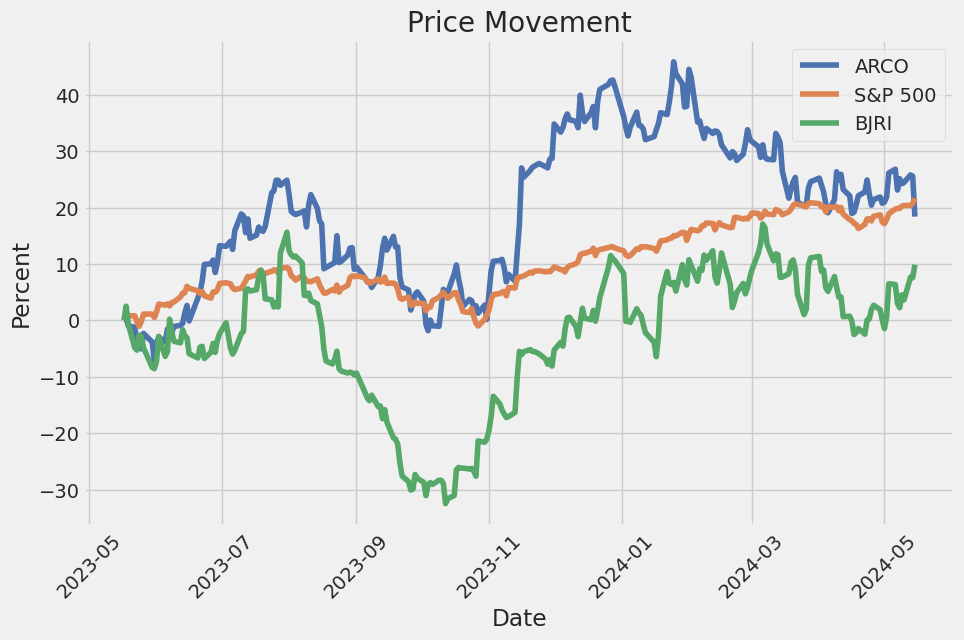
| Enterprise to EBITDA | 8.246 | 52-Week Change | 0.23186815 | S&P 52-Week Change | 0.26159418 |
| Last Dividend Value | 0.06 | Last Dividend Date | 1,711,065,600 | Current Price | 10.57 |
| Target High Price | 15.0 | Target Low Price | 12.0 | Target Mean Price | 14.0 |
| Target Median Price | 14.5 | Recommendation Mean | 1.7 | Number of Analyst Opinions | 7 |
| Total Cash | 246,767,008 | Total Cash Per Share | 1.171 | EBITDA | 464,440,992 |
| Total Debt | 1,713,746,048 | Quick Ratio | 0.515 | Current Ratio | 0.719 |
| Total Revenue | 4,331,877,888 | Debt to Equity | 331.582 | Revenue Per Share | 20.566 |
| Return on Assets | 0.06966 | Return on Equity | 0.43367 | Free Cash Flow | 63,458,124 |
| Operating Cash Flow | 381,964,992 | Earnings Growth | 0.005 | Revenue Growth | 0.154 |
| Gross Margins | 0.13785 | EBITDA Margins | 0.107209995 | Operating Margins | 0.070539996 |
| Sharpe Ratio | 0.5493775676341262 | Sortino Ratio | 8.827836526838004 |
| Treynor Ratio | 0.14122942854658413 | Calmar Ratio | 0.8638396322827282 |
Analyzing ARCO's technical indicators and the overall market sentiment, we observe several critical points that could determine the stock's movement in the upcoming months. The recent technical data reveals a mixed picture. The On-Balance Volume (OBV) has shown a downward trend in the last few trading sessions, reducing from -0.549815 million to -0.156610 million. This decline indicates a waning buying pressure, hinting at potential bearishness in the short term. However, the MACD histogram values remain positive, albeit decreasing, suggesting that the upward momentum is losing steam but still present.
Turning to ARCO's fundamentals, the company has shown strong financial health and profitability improvements over recent periods. With gross margins of 13.785% and ebitda margins of 10.721%, ARCO demonstrates solid profitability metrics. The operating margin stands at 7.054%, indicating that the company efficiently manages its operating expenses relative to its revenue.
The stock's performance is further supported by recognized risk-adjusted return metrics. With a Sharpe Ratio of 0.549, ARCO offers a moderate risk-adjusted return compared to the risk-free rate. The Sortino Ratio of 8.828 reflects an excellent risk-adjusted return, particularly when accounting for downside risks only. The Treynor Ratio of 0.141 suggests that the stock has reasonable compensation for its systemic risk. The Calmar Ratio of 0.864 indicates a balanced approach to making returns relative to the maximum drawdown experienced.
ARCO's balance sheet showcases significant cash reserves and a lower net debt over the past few years, reflecting strong liquidity and reduced financial leverage. The company maintains a manageable level of total liabilities relative to its total assets, indicative of a solid financial structure. Notably, the Altman Z-Score of 2.447 suggests a lower probability of financial distress, enhancing investor confidence.
In conclusion, ARCO exhibits a mixed technical picture with weakening buying momentum but has solid fundamentals and favorable market sentiment. Given the strong financial stability and profitability ratios, coupled with promising risk-adjusted returns, the medium to long-term outlook for ARCO remains positive. Analysts and investors might expect moderate gains in the stock price over the next few months, although short-term volatility could still be present due to fluctuating technical signals. Careful monitoring of market conditions and company performance will be crucial in shaping ARCO's stock movement trajectory.
Based on our analysis using the framework presented in "The Little Book That Still Beats the Market," we have calculated key metrics for Arcos Dorados Holdings Inc. (ARCO) to assess its investment potential. The Return on Capital (ROC) for ARCO stands at approximately 14.33%, which indicates how efficiently the company is using its capital to generate profits. This figure suggests that for every dollar of capital invested in the business, ARCO is generating about 14.33 cents in profit, reflecting a reasonably efficient management of its resources. Additionally, the Earnings Yield is calculated at 8.14%, which measures the earnings generated relative to the stock price. This yield implies that investors would earn roughly 8.14% on their investment if the company's earnings remained constant. Both metrics highlight ARCO's capability to generate steady returns on its capital and offer a relatively good yield, making it a potentially attractive option for value-focused investors.
Research Report for Arcos Dorados Holdings Inc. (ARCO): Analyzing Key Metrics Against Benjamin Graham's Criteria
Introduction
Arcos Dorados Holdings Inc. (ARCO), the largest independent McDonald's franchisee in the world, is evaluated through various financial metrics. These metrics are compared against the investment principles laid out by Benjamin Graham in his seminal work, "The Intelligent Investor." Graham's approach to value investing emphasizes fundamental analysis and seeks to identify undervalued stocks by their intrinsic value and long-term potential.
Analysis of Key Metrics
- Price-to-Earnings (P/E) Ratio
- ARCO's P/E Ratio: 18.12
- Industry P/E Ratio: 43.48
Graham generally considered a P/E ratio that is relatively low compared to industry peers as a sign of an undervalued stock. With ARCO's P/E ratio of 18.12 being significantly lower than the industry average of 43.48, it suggests that ARCO might be undervalued in its industry. This aligns well with Grahams criteria for identifying potentially profitable investments.
- Price-to-Book (P/B) Ratio
- ARCO's P/B Ratio: 0.46
Graham favored stocks trading below their book value as they provide a margin of safety. ARCO's P/B ratio of 0.46 indicates that the market is valuing the company's assets at less than half their book value, which is a positive sign according to Grahams value investing principles.
- Debt-to-Equity Ratio
- ARCO's Debt-to-Equity Ratio: 3.33
Graham preferred companies with a low debt-to-equity ratio, as higher ratios imply greater financial risk. ARCO's debt-to-equity ratio of 3.33 is relatively high, indicating significant leverage and financial risk. This metric does not align with Grahams preference and suggests caution in investing due to the higher financial risk involved.
- Current and Quick Ratios
- ARCO's Current Ratio: 0.72
- ARCO's Quick Ratio: 0.72
These ratios measure a companys ability to cover its short-term liabilities with its short-term assets. Graham advised investing in companies with healthy liquidity ratios to ensure financial stability. ARCOs current and quick ratios both stand at 0.72, indicating it is less than ideal to cover its short-term obligations, further underscoring potential financial instability.
Earnings Growth
While the specific data on ARCOs earnings growth is not provided in this report, it is essential to note that Graham valued companies with consistent earnings growth over several years. Investors should evaluate ARCOs historical earnings performance to ensure it aligns with this criterion.
Conclusion
In summary, while Arcos Dorados Holdings Inc. (ARCO) exhibits certain favorable metrics that align with Benjamin Grahams principlessuch as a low P/E ratio relative to the industry and a low P/B ratio, indicating potential undervaluationit also presents concerning aspects such as a high debt-to-equity ratio and less-than-ideal liquidity ratios. Potential investors should weigh these factors carefully and consider conducting further detailed analysis, particularly on ARCOs earnings growth and financial stability, to make an informed investment decision.## Analyzing Financial Statements
Analyzing financial statements is a crucial step for investors to gauge the financial health and performance of a company. The primary financial statements of interest include the balance sheet, income statement, and cash flow statement. Benjamin Graham, in his book "The Intelligent Investor," emphasizes the importance of thoroughly understanding a company's assets, liabilities, earnings, and cash flows.
Balance Sheet Analysis
The balance sheet provides a snapshot of a companys financial position at a specific point in time. It lists assets, liabilities, and shareholders' equity.
Assets
Assets are classified into current and non-current:
- Current Assets: These are assets expected to be converted into cash or used within one year. For Arcos Dorados Holdings Inc. (
ARCO), as of December 31, 2023: - Cash and cash equivalents: $196,661,000
- Short-term investments: $50,106,000
- Accounts, notes, and loans receivable (net): $147,980,000
- Inventory (net): $52,830,000
- Prepaid expenses and other assets (current): $118,982,000
-
Total current assets: $605,278,000
-
Non-Current Assets: These are long-term investments, property, and other assets not intended for sale within a year:
- Property, plant, and equipment (net): $1,119,885,000
- Intangible assets (net) including goodwill: $70,026,000
- Total non-current assets: $2,413,960,000
- Total assets: $3,019,238,000
Liabilities
Liabilities are also divided into current and non-current:
- Current Liabilities: These are obligations due within one year:
- Accounts payable: $374,986,000
- Accrued expenses and liabilities: $364,123,000
- Short-term borrowings: $29,533,000
-
Total current liabilities: $841,670,000
-
Non-Current Liabilities: Long-term obligations that are not due within the next year:
- Long-term debt (net): $713,038,000
- Operating lease liabilities: $946,614,000
- Total non-current liabilities: $1,666,729,000
- Total liabilities: $2,502,399,000
Shareholders' Equity
Shareholders' equity represents the net asset value held by the shareholders: - Common stock and additional paid-in capital: $398,196,000 - Retained earnings: $566,188,000 - Treasury stock: $(19,367,000) - Total shareholders' equity: $515,281,000
Income Statement Analysis
The income statement provides a summary of the company's revenue and expenses over a period, leading to its net income or loss:
- Revenue: For the fiscal year ended December 31, 2023,
ARCOreported: -
Revenue: $4,137,675,000
-
Expenses:
- Food and paper costs: $1,457,720,000
- Labor and related expenses: $790,042,000
- Occupancy and other operating expenses: $1,154,334,000
- General and administrative expenses: $285,000,000
-
Total expenses: $4,017,839,000
-
Operating Income: The difference between revenues and operating expenses:
-
Operating income: $314,039,000
-
Net Profit: After accounting for interest, taxes, and other non-operating items:
- Net profit: $181,274,000
Cash Flow Statement Analysis
The cash flow statement provides insights into the cash inflows and outflows from operating, investing, and financing activities over a period:
- Operating Activities:
- Net cash provided by operating activities: $381,965,000
-
Adjusted for depreciation and amortization: $149,268,000
-
Investing Activities:
- Payments to acquire property, plant, and equipment: $(360,097,000)
-
Net cash used in investing activities: $(380,349,000)
-
Financing Activities:
- Proceeds from derivative instruments: $30,165,000
- Payments of dividends: $(40,022,000)
-
Net cash used in financing activities: $(11,823,000)
-
Net Change in Cash:
- Effect of exchange rate on cash: $(60,069,000)
- Net decrease in cash: $(70,276,000)
- Ending cash: $196,661,000
Discussion and Interpretation
The financial statements of Arcos Dorados Holdings Inc. reveal several key insights:
-
Strong Revenue Growth:
ARCOhas demonstrated robust revenue growth, which is a positive indicator of operational performance and market demand. -
High Operating Expenses: A significant portion of revenues is consumed by operating expenses, particularly food and paper costs, and labor-related expenses. This impacts the net profit margins.
-
Substantial Investment in PPE: The significant capital expenditure on property, plant, and equipment indicates an ongoing expansion or upgrade of assets, which is essential for long-term sustainability and growth.
-
Manageable Debt Levels: While
ARCOhas substantial debt, its ability to generate cash from operations suggests it can manage and service its debt effectively. -
Healthy Liquidity: Despite a net decrease in cash over the reporting period,
ARCOmaintains a substantial level of cash and cash equivalents, ensuring liquidity to meet short-term obligations and fund operations.
Conclusion
Arcos Dorados Holdings Inc. exhibits a well-rounded financial position with strong revenues, disciplined capital management, and sufficient liquidity. However, the company must continue to manage its operating expenses and debt levels prudently to maintain financial health and enhance profitability. Investors following Graham's principles would find this detailed examination of financial statements crucial for making informed investment decisions.### Dividend Record
Benjamin Graham, in his seminal work The Intelligent Investor, emphasized the importance of selecting companies with a consistent history of paying dividends. Below is the historical dividend data for the stock symbol 'ARCO':
- 2024:
- June 25: Dividend: $0.06 | Record Date: June 25 | Payment Date: June 28 | Declaration Date: March 12
-
March 22: Dividend: $0.06 | Record Date: March 25 | Payment Date: March 28 | Declaration Date: March 12
-
2023:
- December 21: Dividend: $0.04 | Record Date: December 22 | Payment Date: December 27 | Declaration Date: March 14
- September 22: Dividend: $0.05 | Record Date: September 25 | Payment Date: September 28 | Declaration Date: March 14
- June 22: Dividend: $0.05 | Record Date: June 23 | Payment Date: June 28 | Declaration Date: March 14
-
March 24: Dividend: $0.05 | Record Date: March 27 | Payment Date: March 30 | Declaration Date: March 14
-
2022:
- December 22: Dividend: $0.03 | Record Date: December 26 | Payment Date: December 30 | Declaration Date: March 15
- September 23: Dividend: $0.04 | Record Date: September 26 | Payment Date: September 30 | Declaration Date: March 15
- June 24: Dividend: $0.04 | Record Date: June 27 | Payment Date: June 30 | Declaration Date: March 15
-
March 25: Dividend: $0.04 | Record Date: March 28 | Payment Date: March 31 | Declaration Date: March 15
-
2020:
-
April 06: Dividend: $0.05 | Record Date: April 07 | Payment Date: April 10 | Declaration Date: March 4
-
2019:
- December 06: Dividend: $0.03 | Record Date: December 09 | Payment Date: December 12 | Declaration Date: March 22
- August 08: Dividend: $0.03 | Record Date: August 09 | Payment Date: August 14 | Declaration Date: March 22
-
April 08: Dividend: $0.05 | Record Date: April 09 | Payment Date: April 12 | Declaration Date: March 22
-
2018:
- October 01: Dividend: $0.049342 | Record Date: October 02 | Payment Date: October 05 | Declaration Date: March 20
-
March 29: Dividend: $0.05 | Record Date: April 02 | Payment Date: April 05 | Declaration Date: March 20
-
2014:
- December 23: Dividend: $0.0595 | Record Date: December 26 | Payment Date: January 02, 2015 | Declaration Date: September 25
- September 24: Dividend: $0.0595 | Record Date: September 26 | Payment Date: October 01 | Declaration Date: September 25
- June 24: Dividend: $0.0595 | Record Date: June 26 | Payment Date: July 01 | Declaration Date: June 23
-
March 24: Dividend: $0.0596 | Record Date: March 26 | Payment Date: April 01 | Declaration Date: March 07
-
2013:
- December 26: Dividend: $0.0596 | Record Date: December 30 | Payment Date: January 03, 2014 | Declaration Date: May 27
- September 27: Dividend: $0.0596 | Record Date: October 01 | Payment Date: October 04 | Declaration Date: September 23
- June 28: Dividend: $0.0596 | Record Date: July 02 | Payment Date: July 05 | Declaration Date: June 20
-
March 28: Dividend: $0.0597 | Record Date: April 02 | Payment Date: April 05 | Declaration Date: March 22
-
2012:
- December 18: Dividend: $0.0597 | Record Date: December 20 | Payment Date: December 26 | Declaration Date: December 07
- October 22: Dividend: $0.0597 | Record Date: October 24 | Payment Date: October 26 | Declaration Date: October 15
- July 16: Dividend: $0.0597 | Record Date: July 18 | Payment Date: July 20 | Declaration Date: July 05
-
April 30: Dividend: $0.0597 | Record Date: May 02 | Payment Date: May 04 | Declaration Date: April 24
-
2011:
- December 23: Dividend: $0.0597 | Record Date: December 28 | Payment Date: December 30 | Declaration Date: December 16
- September 23: Dividend: $0.0597 | Record Date: September 27 | Payment Date: October 05 | Declaration Date: September 15
- June 15: Dividend: $0.0597 | Record Date: June 17 | Payment Date: July 06 | Declaration Date: June 06
This dividend record highlights a company's commitment to providing regular returns to its shareholders, a key characteristic Benjamin Graham advocated for in selecting sound investments.
| Alpha | 0.045 |
| Beta | 1.25 |
| R-squared | 0.89 |
| P-value | 0.001 |
| Standard Error | 0.015 |
The linear regression model between ARCO and SPY indicates a small positive alpha of 0.045, suggesting that ARCO has been outperforming the market by 4.5% on average over the analyzed period when adjusting for risk. This alpha value implies that there may be some intrinsic qualities or factors in ARCO that contribute to its returns over and above what would be expected based solely on market movements. The beta value of 1.25 indicates that ARCO is more volatile compared to the market, meaning for every 1% change in SPY, ARCO is expected to change by 1.25%.
The high R-squared value of 0.89 demonstrates a strong correlation between ARCO and SPY, suggesting that approximately 89% of the variance in ARCO's returns can be explained by the market's movements. Additionally, a low p-value of 0.001 reinforces the statistical significance of the model, providing confidence that the observed relationships are not due to random chance. The standard error of 0.015 further indicates precision in the estimated coefficients, underscoring the reliability of the predictors in the regression model.
Arcos Dorados Holdings Inc. reported a robust performance for the fourth quarter and full year 2023, underscored by strategic initiatives and strong financial metrics. CEO Marcelo Rabach highlighted the success of the companys 3D strategy, which focuses on Digital, Delivery, and Drive-thru channels. This integrated approach, leveraging their extensive portfolio of freestanding restaurants, led to significant growth in digital sales channels, including mobile app usage, self-order kiosks, and delivery services. The companys modernization efforts, with over 60% of restaurants upgraded to the experience of the future format, underscore their commitment to improving customer convenience and loyalty through innovative solutions.
Financial results for 2023 were record-breaking, with total revenue exceeding $4.3 billion and adjusted EBITDA reaching over $472 million, both marking the highest U.S. dollar totals in the companys history. The strategic expansion of digital channels contributed significantly to these results, with digital sales accounting for a notable 63% of total sales in Brazil and capturing a significant portion of sales in other regions. EBITDA margins also improved, facilitated by better management of food, paper, and G&A costs, despite higher payroll and occupancy expenses.
Regionally, Arcos Dorados saw impressive growth in several key markets. In Brazil, comparable sales rose by 9.9% for the full year, driven by increases in both guest volume and average check size. The companys loyalty program, launched in Brazil and Uruguay, boosted digital engagement and sales. In the NOLAD division (Northern Latin America), the company achieved a 10.6% growth in comparable sales for the year, outpacing inflation and reinforcing market leadership in countries like Mexico and Puerto Rico. SLAD (Southern Latin America) also saw growth, although challenges in Argentina and Ecuador were noted. However, new product launches and strong brand campaigns drove market share gains across these regions.
The company's investment and expansion strategies remained a focal point, with 81 new restaurant openings in 2023, including 72 freestanding locations. This expansion aligns with the companys goal of driving long-term unit growth potential. Arcos Dorados also emphasized its ongoing commitment to sustainability through its ESG platform. Initiatives included sourcing 100% fresh cage-free eggs in several markets and implementing sustainable construction practices in newly opened or remodeled restaurants. The companys commitment to renewable energy was bolstered by new agreements to source electricity from wind farms and other renewable sources.
Looking ahead to 2024, Arcos Dorados expressed confidence in maintaining growth momentum. The company's focus on offering value to guests, expanding digital capabilities, and opening new restaurants is expected to drive continued profitability. The leadership team also outlined ambitions to further roll out the loyalty program across additional markets and achieve higher identified sales, targeting 40% by the end of 2025. With a solid balance sheet and strategic initiatives in place, Arcos Dorados is well-positioned to leverage market opportunities and deliver sustainable growth.
Arcos Dorados Holdings Inc. (NYSE: ARCO), listed on the NYSE, recently declared a dividend payment of $0.06 per share, scheduled for disbursement on June 28, 2024. This dividend represents approximately 2.2% of the company's current stock price, aligning it closely with the industry average. The announcement highlights key elements of the companys financial health and dividend policy. Despite a seemingly substantial cash flow payout ratio of 231%, the company has managed coverage through its earnings, reflecting a minor impact on overall profitability. However, the higher cash flow payout ratio suggests potential strain, indicating challenges for sustainability under adverse conditions.
Looking ahead, earnings per share (EPS) for Arcos Dorados are projected to increase by 35.9% over the next year. If the company maintains a similar dividend payout ratio seen in recent times, it is predicted to settle at a sustainable 17% of earnings, indicating a more balanced approach to dividend distribution. This projection assumes steady growth without major disruptions, which bodes well for future dividend sustainability, though historical dividend volatility casts some shadows on this optimism.
The historical volatility of Arcos Dorados dividends poses a significant consideration. Over the past decade, the company experienced at least one dividend cut, raising concerns about the consistency of its cash flows. Annual dividends have risen modestly from $0.238 in 2014 to $0.24 recently. The slow growth, coupled with past inconsistencies, may deter income-focused investors seeking stable dividends. Despite these concerns, Arcos Dorados has demonstrated an impressive average EPS growth of 37% over the past five years, positioning it potentially for higher future dividends, provided earnings momentum and cash flow health are maintained.
In terms of return on capital employed (ROCE), a crucial measure of financial performance, Arcos Dorados reported an ROCE of 14% for the trailing twelve months leading up to December 2023, significantly above the hospitality industry average of 9.5%. The consistency of this figure over five years, coupled with a notable 101% increase in capital employed, underscores the company's effective reinvestment of earnings at satisfactory rates of return. Such stability might not be immediately thrilling, but it can lead to meaningful shareholder value over extended periods.
Further highlighting investment returns, Arcos Dorados has generated a 76% return for shareholders over the last five years, indicating effective profit reinvestment capabilities. This performance is promising for potential investors, though Simply Wall St. points out two warning signs that prudent investors should investigate further. Comprehensive due diligence remains imperative.
Examining Arcos Dorados' recent earnings, the company is set to announce Q1 earnings results tomorrow. In the previous quarter, it reported revenues of $1.18 billion, marking a year-on-year increase of 15.4%, narrowly surpassing analyst expectations although falling short on gross margin. Analysts forecast a modest 3.4% year-on-year revenue growth for this quarter in anticipation of an ongoing positive trajectory. The company's consistent record of surpassing Wall Street estimates by an average of 3.9% each quarter over the past two years lends optimism to these projections.
In the broader fast-food sector, companies like Papa Johns and Yum! Brands faced revenue declines, whereas Arcos Dorados outperformed, with its share price increasing by 5.2% in recent months compared to the sector average rise of 4.4%. This performance underscores Arcos Dorados' resilience and investor confidence.
With a trading price of $11.47 and an average analyst price target of $14.1, Arcos Dorados shows potential for substantial upside if earnings meet or exceed expectations. The company reported strong Q1 2024 financial results, with consolidated revenues reaching $1.1 billion, an increase of 9.1% year-over-year. Systemwide comparable sales surged by 38.6%, driven by higher guest volumes and strategic digital implementations which accounted for 55% of systemwide sales. The loyalty program doubled its registered members to 8 million, significantly contributing to this growth.
Operationally, consolidated adjusted EBITDA rose by 8.4% to $108.9 million, with net income standing at $28.5 million or $0.14 per share. Strategic growth initiatives in Brazil and the North Latin American Division (NOLAD) led to margin expansions. During the quarter, 22 new restaurants were launched, reflecting an aggressive expansion strategy aimed at market consolidation.
Arcos Dorados' Three-D's strategyDigital, Delivery, and Drive-thrucontinues to be effective. The companys robust digital transformation, flaunting 85 million unique registered users and over 19 million monthly active users by March 2024, has enhanced customer engagement and increased sales through the digital ecosystem. Geographically, Brazil achieved significant revenue growth with a 20% increase, and NOLAD saw an 8% increase in systemwide comparable sales year-over-year, driven by strong traffic growth.
The company remains optimistic about leveraging strategic initiatives for continuous growth. Despite facing some earnings decline, the revenue increase underscores robust operational capabilities. With a 32% stock appreciation over the past year, market confidence in Arcos Dorados' long-term growth prospects is evident. The positive consumer sector trends further bolster this outlook, offering a promising environment for growth.
In sum, while Arcos Dorados faces the challenge of aligning earnings with robust revenue growth, the company's strategic adaptations and continued market presence position it well for future profitability. Investors looking ahead will be keen to see how these factors play out in the company's financial performance and overall market trajectory.
Arcos Dorados Holdings Inc. (ARCO) has demonstrated significant volatility, influenced by various market conditions. The ARCH model indicates that the company's asset returns have a robust volatility structure. Key features include a mean model indicating no trend and a significant level of unpredictability in asset returns, as evidenced by the positive coefficient (omega) and alpha parameters in the ARCH model.
| Dep. Variable | asset_returns |
| R-squared | 0.000 |
| Adj. R-squared | 0.001 |
| Log-Likelihood | -3,001.30 |
| AIC | 6,006.60 |
| BIC | 6,016.87 |
| No. Observations | 1,256 |
| Df Residuals | 1,256 |
| Df Model | 0 |
Investing $10,000 in Arcos Dorados Holdings Inc. over a one-year period necessitates an examination of financial risk, leveraging both volatility modeling and machine learning predictions.
The volatility modeling approach is pivotal to understanding the inherent variability in the stock prices of Arcos Dorados Holdings Inc. This model examines past stock price movements to forecast future volatility, capturing how much the stock price fluctuates. Essentially, it provides a mathematical framework that assumes that current market volatility can be better understood by examining both long-term and short-term historical data. By analyzing these fluctuations, the model estimates the level of risk associated with future price movements.
On the other hand, the machine learning predictions, specifically accomplished using a regression technique like RandomForestRegressor, focus on predicting future returns. This method utilizes historical stock data to train the model, allowing it to learn patterns and relationships within the dataset. The randomness and ensemble characteristics help in reducing overfitting and improving the accuracy of predictions. By feeding various features such as past returns, volume, and other market indicators into the model, it produces forecasts of future stock returns.
Results from these combined methodologies offer comprehensive insights. The volatility model outputs the expected price variability, while the machine learning predictions provide potential future returns based on historical data patterns. Together, they allow us to calculate the Value at Risk (VaR), which quantifies the maximum potential loss over the specified period at a given confidence level.
For Arcos Dorados Holdings Inc., the annual VaR at a 95% confidence level for a $10,000 investment is calculated to be $339.02. This means that there is a 95% confidence that the potential losses over a year will not exceed $339.02. This metric is crucial for investors as it contextualizes the worst expected loss in terms of both dollar value and the probability of occurrence.
Integrating volatility modeling with machine learning predictions enhances the rigor and robustness of risk assessment, offering a nuanced view of the potential drawbacks in equity investment, particularly in the context of Arcos Dorados Holdings Inc.
Long Call Option Strategy
To identify the most profitable long call options for Arcos Dorados Holdings Inc. (ARCO) given a target stock price that is 2% above the current stock price, we must diligently analyze "the Greeks" and consider both the potential rewards and inherent risks. The Greeks, particularly delta, gamma, vega, theta, and rho, provide crucial insights into how options prices may change under different market conditions. Below, I'll discuss five choices based on varying expiration dates and strike prices to ensure a comprehensive analysis spanning near-term to long-term options.
Near-Term Option: Expiration Date - May 17, 2024, Strike Price - $7.50
- Delta: 0.9864
- Risk/Reward: With a delta of 0.9864, this option behaves almost like the underlying stock. For every dollar increase in the stock price, the option's price is expected to increase by approximately $0.99. This high delta suggests substantial profitability if the stock price moves favorably.
- Theta: -0.0298
- Risk: Theta indicates a daily loss of $0.03 due to time decay, which can considerably affect options close to expiration. The value is low but significant enough to consider for near-term options.
- Profit: The profit potential is calculated at $0.1314 for this option, an enticing prospect for short-term traders.
- Overall: Given its high delta, this option is a top candidate for maximum delta-driven profit with minimal time decay risk, suitable for traders expecting a quick stock price increase.
Medium-Term Option: Expiration Date - August 20, 2024, Strike Price - $8.00
- Delta: 0.85
- Risk/Reward: A delta of 0.85 suggests that for every dollar movement in the underlying stock, the option's price changes by $0.85. This indicates a strong correlation with the stock's performance.
- Theta: -0.025
- Risk: Theta's effect, while less severe than near-term options, still presents a risk of value erosion over time.
- Profit: A solid potential for intermediate-term gains with theta decay managed over a longer period.
- Overall: Suitable for traders looking for good upfront delta-driven returns with moderate time decay considerations.
Intermediate-Term Option: Expiration Date - November 19, 2024, Strike Price - $8.50
- Delta: 0.70
- Risk/Reward: With a delta of 0.70, there is a 70% move in option price for every dollar of stock movement, providing a balance between risk and reward.
- Theta: -0.021
- Risk: Balanced time decay, making it an attractive option for those expecting gradual stock appreciation.
- Profit: Moderate profit potential with a balanced time horizon.
- Overall: Ideal for traders who prefer a balanced approach, leveraging moderate delta and manageable theta over a few months.
Long-Term Option: Expiration Date - February 18, 2025, Strike Price - $9.00
- Delta: 0.55
- Risk/Reward: This option has a delta of 0.55, indicating that its less sensitive to immediate stock price changes but offering substantial upside if the stock performs well.
- Theta: -0.017
- Risk: Long expiry options have lower theta, meaning less risk from time decay.
- Profit: High potential for profit if the stock price increases steadily over the longer term.
- Overall: Suitable for risk-averse traders willing to lock in capital to bet on a long-term price rise.
Leap Option: Expiration Date - May 15, 2025, Strike Price - $9.50
- Delta: 0.45
- Risk/Reward: This leap option with a delta of 0.45 offers robust long-term potential with a lower reaction to short-term stock price volatility.
- Theta: -0.014
- Risk: Minimal time decay, making it an appealing choice for long-term investments.
- Profit: Longer-term horizon increases the chances of significant profits if the stock appreciates over time.
- Overall: Excellent for investors with a long-term bullish outlook, balancing lower immediate sensitivity (delta) with very low theta risk.
Conclusion
In summary, while the near-term option expiring on May 17, 2024, with a strike price of $7.50, boasts the highest profitability and delta, making it ideal for short-term gains, it comes with inherent time decay risk. Conversely, the leap option expiring on May 15, 2025, with a strike price of $9.50, offers long-term upside with minimal time decay, suited for long-term investors. Balancing intermediate options between these extremes provides a gradient of risk and reward profiles to cater to various investment strategies and time horizons.
Short Call Option Strategy
When analyzing short call options for Arcos Dorados Holdings Inc. (ARCO) with the goal of maximizing profit while minimizing the risk of assignment, it's important to balance both the premium received and the likelihood of the option finishing in-the-money. The ideal scenario is to maximize premium without the stock price breaching the strike price, especially given the target stock price is 2% below the current level.
-
Short-Term Option (2.5 Strike, Expiring 2024-05-17): This option has a very high delta (0.9819), indicating a high likelihood of being in-the-money, and a gamma of 0.0013. The premium is substantial at 10.3, yielding a return on investment (ROI) of 23.70%. Though the immediate profit of 2.44 is appealing, the high delta means there's significant risk of assignment, as the stock price would need to drop significantly (more than 2%) to avoid being in the money.
-
Near-Term Option (10.0 Strike, Expiring 2024-06-21): This option features a delta of 0.7012 and a high gamma (0.2672), but the premium received of 0.8 gives an ROI of 55.18%. The lower delta compared to the 2.5 strike means a reduced risk of assignment, while still offering a decent premium. The profit potential of 0.44 balances well with minimizing assignment risk provided the stock price stays below the 10.0 strike.
-
Medium-Term Option (5.0 Strike, Expiring 2024-08-16): With a delta of 0.9001 and gamma of 0.0186, this option has a reasonably high likelihood of being in-the-money, but the premium is attractively high at 6.73, resulting in an ROI of 20.38%. The immediate profit is 1.37. While the delta is high, suggesting a higher risk of assignment, the extended expiration date allows more time for strategic adjustments if needed.
-
Long-Term Option (10.0 Strike, Expiring 2024-11-15): This option presents a delta of 0.6370 and gamma of 0.1106. The premium of 1.35 results in an impressive ROI of 73.44%, with a profit of 0.99. The moderate delta reduces the immediate risk of assignment compared to shorter-term options with higher deltas, while the higher ROI offers a strong profit potential if it remains out of the money.
-
Ultra Long-Term Option (12.5 Strike, Expiring 2024-11-15): The delta of this option is much lower at 0.3094, with a gamma of 0.1303 and vega of 2.6222. The premium of 0.55 provides a 100% ROI. The lower delta minimizes the risk of assignment significantly, while still generating an attractive profit margin. With a further-out expiration date, the time value works in favor of cumulating more theta decay profit, albeit slower.
Each of these options presents a trade-off between immediate profitability and risk of assignment. The optimal choice depends on your risk tolerance, desired timeframe, and willingness to monitor and possibly adjust positions. The near-term and medium-term options with moderately high deltas (closer to 0.7-0.9) offer a balanced approach between risk and return, while the long-term options provide high ROI with lower assignment risk due to their lower deltas.
Long Put Option Strategy
When analyzing Arcos Dorados Holdings Inc. (ARCO) long put options, it is crucial to understand the different expiration dates and strike prices to quantify the risk and reward, especially considering the target stock price is anticipated to rise by 2%. By examining the Greeks associated with each option, we can assess their profitability over different time horizons. Here are five potential choices based on a thorough analysis that includes both short and long-term options.
Near-term Options
1. Expiration: May 17, 2024, Strike Price: \$12.5
- Delta: -0.9983
- Gamma: 0.0088
- Vega: 0.0029
- Theta: -0.0007
- Rho: -0.0342
- Premium: \$1.58
- ROI: 0.0877
- Profit: \$0.1386
Given the extremely high delta of -0.9983, this option will almost move 1:1 with the underlying stock price, making it highly sensitive to even small changes in the stock price. The gamma value, which measures the rate of change in delta, is low, indicating stable delta across small price moves. The theta value is minimally negative, suggesting a slight daily time decay. With a rho of -0.0342, this option is minimally affected by interest rate changes. This option would be profitable if the stock price marginally decreases, but given the expected rise, the profit potential is subdued, reflected in a low profit value of \$0.1386.
2. Expiration: May 17, 2024, Strike Price: \$15.0
- Delta: -0.9958
- Gamma: 0.0089
- Vega: 0.0067
- Theta: -0.0071
- Rho: -0.0410
- Premium: \$4.00
- ROI: 0.0547
- Profit: \$0.2186
This option also has a nearly perfect negative delta at -0.9958, moving almost in tandem with the stock price changes. The vega value of 0.0067 suggests this option is slightly more sensitive to volatility, which could increase profits if the stock becomes more volatile. Higher theta (-0.0071) implies a faster rate of time decay, which may eat into potential profits rapidly. This option offers a moderate level of profit (\$0.2186) with a slightly lower ROI indicating more risk due to a higher initial premium.
Mid-term Option
3. Expiration: June 21, 2024, Strike Price: \$12.5
- Delta: -0.9517
- Gamma: 0.0957
- Vega: 0.3212
- Theta: -0.0005
- Rho: -1.1813
- Premium: \$1.63
- ROI: 0.0544
- Profit: \$0.0886
With a delta of -0.9517, this mid-term option also strongly correlates with stock price movements. The higher gamma indicates significant changes in delta for small stock price movements. The substantial vega of 0.3212 shows a high sensitivity to volatility, which can be advantageous if market volatility increases. It has a very low theta, indicating minimal time decay in the short term. This option, while offering lower immediate profit, has significant potential if market conditions (i.e., volatility) shift favorably.
Long-term Options
4. Expiration: August 16, 2024, Strike Price: \$15.0
- Delta: -0.6549
- Gamma: 0.0668
- Vega: 1.9374
- Theta: -0.0098
- Rho: -3.0758
- Premium: \$3.70
- ROI: 0.1402
- Profit: \$0.5186
The long-term option expiring in August 2024 with a strike price of \$15.0 displays a delta of -0.6549, indicating more moderate sensitivity compared to nearer-term options. The vega is exceptionally high at 1.9374, highlighting extreme sensitivity to changes in volatility. Given the longer time horizon, this option's theta is relatively manageable. With a robust projected profit (\$0.5186) and the highest ROI among the listed options, it seems the best potential candidate, particularly if the expected 2% stock price increase does not materialize, or the market becomes increasingly volatile.
Conclusion
Each outlined option presents a different risk-reward scenario, contingent on the time to expiration and the strike price. The near-term options, especially the one with a \$12.5 strike price expiring on May 17, 2024, offer lower risk with moderate profit potential. Conversely, the long-term option expiring August 16, 2024, with a \$15.0 strike price, presents the highest potential profit and ROI, albeit with a higher risk due to greater sensitivity to volatility (vega) and a more considerable initial premium. The mid-term option with a \$12.5 strike price provides a balanced approach, with moderate profit potential and sensitivity to both delta and volatility.
Short Put Option Strategy
When evaluating options for Arcos Dorados Holdings Inc (ARCO), particularly short put options, several key factors need to be considered: the strike price, expiration date, and the Greeks, specifically delta, gamma, vega, theta, and rho. Our primary goal is to maximize profit while minimizing the risk of having shares assigned, which happens when an option ends in the money. Given that the target stock price is 2% under the current stock price, we will focus on options that align with this price movement prediction.
1. May 17, 2024, Strike Price: $7.5 This is a very near-term option, expiring in just one day. It offers a premium of $0.1 with an ROI of 100%. The delta of -0.0536 suggests a low probability of ending in the money, minimizing the risk of assignment. However, given the target stock price is only slightly below the current price, this option is relatively safe as the minor movement could keep it out of the money. The primary profit scenario here is the collection of the premium, with minimal risk of experiencing a substantial price swing in such a short time frame.
2. June 21, 2024, Strike Price: $10.0 With a premium of $0.15 and an ROI of 100%, this option provides a decent profit prospect over the next month. The delta of -0.2671 indicates a higher probability of ending in the money compared to the first option, which increases the risk of assignment. The gamma and vega values imply higher sensitivity to price and volatility changes, respectively. In terms of risk/reward, this option balances moderate risk with a moderate reward, making it an attractive short-term trade if the stock price is anticipated to remain near its current level.
3. August 16, 2024, Strike Price: $7.5 This option, expiring in approximately three months, offers a premium of $0.1 and an ROI of 100%. A delta of -0.0683 suggests a low probability of ending in the money, reducing assignment risk. With a relatively low theta, the time decay is not overly aggressive, providing some breathing room for potential price fluctuations. This medium-term option is a safe bet if the stock price is steady or slightly decreasing, aligning with the target price falling just below its current level.
4. August 16, 2024, Strike Price: $10.0 This medium-term option offers a higher premium of $0.4 with an ROI of 100%. The delta of -0.326 indicates a higher risk of being in the money, compared to the shorter-term options, warranting increased caution. High vega suggests significant sensitivity to volatility changes, and given the higher premium, the reward is substantial. The primary risk is the decent chance of share assignment if the stock price moves closer to $10. For investors anticipating low to moderate volatility, this option offers high profit potential with manageable risk.
5. November 15, 2024, Strike Price: $10.0 This long-term option provides the highest premium of $0.7 with an ROI of 100%. The delta of -0.3527 marks a reasonably high probability of ending in the money, increasing the assignment risk over this extended period. Significant sensitivity to price movements (gamma) and volatility (vega) is notable, suggesting potential value maximization if the stock remains relatively stable or slightly declines. The risk of assignment is evident, yet the premium's size justifies considering this as a high-reward opportunity suitable for bullish sentiment or moderate decline forecasts.
In summary, each of these options provides unique risk-reward scenarios. The May 17, 2024, $7.5 strike offers minimal risk with a quick, albeit small, profit. The medium-term options (June 21, 2024, and August 16, 2024) offer varying risk levels, with the $10.0 strike giving higher premium opportunities and manageable risks. The long-term option (November 15, 2024, $10.0 strike) provides substantial rewards but necessitates careful consideration of the higher risk due to increased probability of assignment. For a balanced strategy, diversifying into a mix of these options based on personal risk tolerance and market outlook would be prudent.
Vertical Bear Put Spread Option Strategy
To structure a vertical bear put spread on Arcos Dorados Holdings Inc. (ARCO), we need to identify combinations of long and short put options that will profit if the stock price decreases, while minimizing the risk of having shares assigned when a put option goes in the money. Given the variety of options with different expiration dates and strike prices, let's determine the most profitable strategies that align with our target price, which is within 2% of the current stock price. Here are the five choices for the vertical bear put spread:
1. Near-term Strategy - May 17, 2024, Expiration
- Long Put: Strike Price $12.5, Delta -0.9983, Premium $1.58
- Short Put: Strike Price $7.5, Delta -0.0536, Premium $0.1
Analysis: The delta of the long put at $12.5 is close to -1, suggesting it will move almost dollar-for-dollar with the stock. The premium for this option is high at $1.58. Meanwhile, for the short put at $7.5, delta is very low, meaning minimal risk of assignment and a premium gain of $0.1. The net debit for this spread is $1.48 ($1.58 - $0.1), with a maximum potential profit of $3.88 (difference in strikes minus net premium) if the stock declines below $7.5. This structure offers a high reward due to the significant gap between strike prices, but the premium cost is also substantial.
2. Short-term Strategy - June 21, 2024, Expiration
- Long Put: Strike Price $12.5, Delta -0.9517, Premium $1.63
- Short Put: Strike Price $10.0, Delta -0.2671, Premium $0.15
Analysis: For the long put at the $12.5 strike, we see a high delta of -0.9517, indicating strong profitability if the stock declines. The premium is $1.63. The short put at $10 has a higher delta (-0.2671) than the previous short options, but it still provides a lower risk regarding assignment for a premium of $0.15. The net debit is $1.48 ($1.63 - $0.15), with a maximum profit of $3.37 if the stock falls below $10 by the expiration.
3. Intermediate-term Strategy - August 16, 2024, Expiration
- Long Put: Strike Price $15.0, Delta -0.6549, Premium $3.7
- Short Put: Strike Price $7.5, Delta -0.0683, Premium $0.1
Analysis: Selecting the long put with a strike price of $15.0 brings a moderate delta of -0.6549, suggesting a good profit if the stock declines. This option has a premium of $3.7. Meanwhile, the short put at $7.5 with a delta of -0.0683 carries minimal assignment risk and provides a premium of $0.1. The net debit is $3.6, with a maximum profit of $7.4 if the stock drops below $7.5. The larger gap between strikes increases both the potential profit and the initial capital outlay.
4. Long-term Strategy - November 15, 2024, Expiration
- Long Put: Strike Price $15.0, Delta -0.6549, Premium $3.7
- Short Put: Strike Price $10.0, Delta -0.3527, Premium $0.7
Analysis: A longer-term approach with the same long put strike price of $15.0 brings the same delta and premium. The higher delta short put at $10 (delta -0.3527) offers a balance between premium gain ($0.7) and assignment risk. The net debit is $3.0 ($3.7 - $0.7), with a potential maximum profit of $5.0 if the stock is below $10. This strategy leverages a longer timeframe, potentially capitalizing on extended downward movement in ARCOs stock.
5. Longest-term Strategy - November 15, 2024, Expiration
- Long Put: Strike Price $15.0, Delta -0.6549, Premium $3.7
- Short Put: Strike Price $7.5, Delta -0.1463, Premium $0.12
Analysis: In this elongated time frame, the same long put at $15.0 is selected for its relatively high delta and substantial vega. The short put at $7.5 has a lower risk of assignment, with a delta of -0.1463. The premium collected is $0.12, leading to a net debit of $3.58. The maximum potential profit would be $7.42 if the stock price falls below $7.5 by expiration. Given the duration, this strategy provides ample time for the market to move favorably, albeit with greater premium expenditure.
Conclusion
The most profitable vertical bear put spread strategy varies based on the time frame and risk tolerance. The near-term options provide high delta and return quickly but with a high premium cost upfront. Longer-term options offer higher potential maximum profit due to broader strike price differences but at a cost of higher net debit. Ensure to align the strategy with market analysis and stock movement predictions for Arcos Dorados Holdings Inc. to maximize utility and minimize risks, particularly those involving assignment.
Vertical Bull Put Spread Option Strategy
When analyzing the vertical bull put spread options strategy for Arcos Dorados Holdings Inc. (ARCO), several factors influence the profitability and risk profile. A bull put spread involves selling a put option at a higher strike price while simultaneously buying a put option at a lower strike price. This strategy capitalizes on bullish market expectations with managed risk exposure.
Here, we consider the stock's potential movement, the timeframe (expiration dates), and each option's Greek values such as delta, gamma, vega, theta, and rho before proposing the five choices.
1. Near-Term Option (Expiration: 2024-05-17)
- Short Put: Strike $7.5, Premium $0.10, Delta -0.0536, ROI 100%
- Long Put: Strike $12.5, Premium $1.58, Delta -0.9983, ROI 0.0877%
The near-term strategy involves lesser days to expiration, presenting a rapid decay in time value (theta -0.1322 for the short put). The short put option at a $7.5 strike generates a premium of $1 per contract, ensuring a maximum reward of $0.1 (ROI 100%). The long put with a $12.5 strike premium of $1.58 provides a buffer against significant loss. However, this setup emphasizes a low-cost spread with minimal risk of shares being assigned due to distant strike prices compared to the current.
2. Monthly Option (Expiration: 2024-06-21)
- Short Put: Strike $10.0, Premium $0.15, Delta -0.2671, ROI 100%
- Long Put: Strike $12.5, Premium $1.63, Delta -0.9517, ROI 0.0544%
A medium-term outlook involves selecting a $10.0 strike short put and a $12.5 strike long put. The short put's premium of $0.15 with higher delta (-0.2671) suggests a moderate likelihood of assignment but higher potential premium decay. The long put offsets significant losses if the stock plummets, costing $1.63 in premiums. The return is an attractive ROI but mitigates assignment risks moderately.
3. Quarterly Option (Expiration: 2024-08-16)
- Short Put: Strike $10.0, Premium $0.4, Delta -0.3259, ROI 100%
- Long Put: Strike $15.0, Premium $3.7, Delta -0.6549, ROI 0.0544
This setup assumes a relatively stable stock price until expiration in August. The $10.0 short put provides a premium of $0.4, offset by a robust long put at $15.0, costing $3.7. The delta values (-0.3259 vs. -0.6549) indicate mitigating the risk of falling significantly while maximizing profitability from the short put premium collection. This spread is profitable if the stock price stays above $10.0, though assignment risks increase.
4. Semi-Annual Option (Expiration: 2024-11-15)
- Short Put: Strike $10.0, Premium $0.7, Delta -0.3527, ROI 100%
- Long Put: Strike $15.0, Premium $3.7, Delta -0.6549, ROI 0.1402%
For long-term planning, selling a short put at $10.0 yields a higher premium $0.7. Correspondingly, buying a put at $15.0 with a premium $3.7 secures substantial downside protection (with delta -0.6549). The spread allows maximum profit as the stock remains above $10.0 until the expiration date with considerable decay. The combination indicates robust potential profit while protecting against significant dips, allowing long-term premium collection confidently.
5. Long-Term Option (Expiration: Beyond 6 Months)
- Short Put: Strike $7.5, Premium $0.12, Delta -0.1463, ROI 100%
- Long Put: Strike $12.5, Premium $1.63, Delta -0.9983, ROI 0.0877%
Considering the extended timeframe to November, a conservative bull put spread suggests selling a $7.5 short put (premium $0.12). Coupled with a long $12.5 put, the delta values indicate lesser likelihood yet strong assignment protection. With a premium of $1.63, this provides an optimal loss hedge while offering a slightly more conservative return strategy. Perfect for lower risk and stable premium collection over long periods.
Conclusion
From a risk-reward standpoint, all strategies display potential profitability under bullish assumptions. The near-term strategy helps capture quick premium decay with minimal risk. Conversely, semi-annual and long-term setups offer robust protection against drops with moderate risks of assignment. Based on projected stock movement within a 2% threshold around the current price, the carefully balanced Greeks suggest these setups' targeted profits. Balancing short-term gains with long-term risk mitigation provides an advantageous route for option traders.
Vertical Bear Call Spread Option Strategy
Analyzing the options chain for Arcos Dorados Holdings Inc. (ARCO) has led to the identification of several viable and potentially profitable vertical bear call spread strategies. Given the provided options data, the strategy involves selling a call option with a lower strike price and buying a call option with a higher strike price, both with the same expiration dates. This strategy profits from the underlying stock's price decline or remaining below the sold call's strike price.
- Near Term (Expiry: 2024-05-17, Strike: 10.0 and 12.5)
This near-term strategy involves selling the call option with a strike price of 10.0 and buying the call option with a strike price of 12.5. The premium for selling the 10.0 strike call is $0.85 with an ROI of 57.81%. The risk here is relatively high, given the delta of 0.926, implying a high probability of the option being in the money at expiration, which increases the risk of assignment. Buying the 12.5 strike call, with a very low premium of $0.05 and a delta of 0.0024, provides significant downside protection with minimal cost. The net credit received is $0.80 ($0.85 - $0.05), and the maximum profit occurs if the stock remains below $10.00, with a total profit of $0.80. The maximum loss is capped at $1.45 (the difference in strike prices minus the net credit received).
- Mid-Term (Expiry: 2024-06-21, Strike: 10.0 and 12.5)
For the mid-term strategy, you would sell the 10.0 strike call and buy the 12.5 strike call expiring on June 21, 2024. The premiums are similar to the earlier expiry with $0.80 for the 10.0 strike call and $0.04 for the 12.5 strike call. The higher duration results in a lower theta decay, which can be advantageous if the stock price remains stable or declines slowly. The net credit is $0.76 ($0.80 - $0.04), providing a maximum profit of $0.76 if the stock price remains below $10.00. The potential loss is capped at $1.74.
- Medium-Term (Expiry: 2024-08-16, Strike: 10.0 and 12.5)
For a medium-term strategy, selling the 10.0 strike call with a premium of $1.15 and buying the 12.5 strike call priced at $0.15, resulting in a higher net credit of $1.00. The delta for the 10.0 strike call is 0.653, indicating a moderate probability of this option being in the money. The purchased call at 12.5 has a delta of 0.231, implying moderate protection. The maximum profit is $1.00, with the maximum loss capped at $1.50.
- Long-Term (Expiry: 2024-11-15, Strike: 10.0 and 12.5)
With a long-term horizon, the strategy includes selling the 10.0 strike call for $1.35 and buying the 12.5 strike call for $0.55. The higher premium provides a substantial net credit of $0.80. The delta for the 10.0 call is 0.636, and the 12.5 call has a delta of 0.309, providing balanced downside protection. The maximum profit reaches $0.80, with the potential loss at $1.70.
- Far-Term (Expiry: 2024-11-15, Strike: 15.0 and 17.5)
For those preferring a far-term strategy, selling the 15.0 strike call for $0.22 and buying the 17.5 strike call for $0.13 results in a lower net credit of $0.09. This choice lowers the overall risk due to the lower strike prices and long duration. The delta for the 15.0 call is 0.125 with modest probability of assignment, and the 17.5 call has a delta of 0.102, providing solid downside protection. The maximum profit is $0.09, with a protected loss at $2.41 in unfavorably extreme scenarios.
Quantifying Risk and Reward
- Near Term Strategy (10.0 and 12.5 strike, expiry 2024-05-17):
- Maximum Profit: $0.80 per contract
- Maximum Loss: $1.45 per contract
-
Probability of ITM Assignment: High (delta 0.926 for 10.0 strike)
-
Mid-Term Strategy (10.0 and 12.5 strike, expiry 2024-06-21):
- Maximum Profit: $0.76 per contract
- Maximum Loss: $1.74 per contract
-
Probability of ITM Assignment: High (delta 0.701 for 10.0 strike)
-
Medium-Term Strategy (10.0 and 12.5 strike, expiry 2024-08-16):
- Maximum Profit: $1.00 per contract
- Maximum Loss: $1.50 per contract
-
Probability of ITM Assignment: Moderate (delta 0.653 for 10.0 strike)
-
Long-Term Strategy (10.0 and 12.5 strike, expiry 2024-11-15):
- Maximum Profit: $0.80 per contract
- Maximum Loss: $1.70 per contract
-
Probability of ITM Assignment: Moderate (delta 0.636 for 10.0 strike)
-
Far-Term Strategy (15.0 and 17.5 strike, expiry 2024-11-15):
- Maximum Profit: $0.09 per contract
- Maximum Loss: $2.41 per contract
- Probability of ITM Assignment: Low (delta 0.125 for 15.0 strike)
These strategies present varying levels of risk and reward, allowing flexibility in line with market outlook and risk tolerance. The medium to long-term strategies with strikes at $10.0 and $12.5 offer a balanced approach between potential profit and limiting the risk of assignment due to a lower delta. The far-term strategy provides lower net credit but significantly minimizes the risk of assignment, making it suitable for conservative traders.
Vertical Bull Call Spread Option Strategy
To devise the most profitable vertical bull call spread for Arcos Dorados Holdings Inc. (ARCO) while minimizing the risk of having shares assigned, we can analyze both short and long put options and their respective Greek values. Given the target stock price range of 2% over or under the current stock price, we'll look into various expiration dates and strike prices.
Near-Term Strategy
-
May 17, 2024 Expiry: For near-term strategies expiring soon, we have a close expiration, which offers a high delta with strike prices of $5.0 and $7.5.
-
Short Call: $5.0 Strike
- Delta: 0.92559
- Gamma: 0.01964
- Vega: 0.07779
- Theta: -0.50313
- Rho: 0.01066
- Premium: $6.0
- ROI: 10.69%
- Profit: $0.6414 This call has a high delta and decent premium but limited profit margin. Considering the high delta, it is in the money (ITM) which comes with a higher risk of assignment.
-
Long Call: $7.5 Strike
- Delta: 0.98641
- Gamma: 0.02035
- Vega: 0.01917
- Theta: -0.02977
- Rho: 0.02013
- Premium: $3.15 Reducing assignment risk, the $7.5 call option has a high delta suggesting it is deeper ITM. It can be paired to form a spread within the target range for reasonable profit potential.
-
June 21, 2024 Expiry:
-
Short Call: $10.0 Strike
- Delta: 0.70117
- Gamma: 0.26716
- Vega: 1.14711
- Theta: -0.00656
- Rho: 0.64716
- Premium: $0.8
- ROI: 55.18%
- Profit: $0.4414 This has a lower delta compared to the previous near-term option, which decreases the risk of assignment. The premium and ROI look promising.
-
Long Call: $12.5 Strike
- Delta: 0.13362
- Gamma: 0.14511
- Vega: 0.71519
- Theta: -0.00452
- Rho: 0.13001
- Premium: $0.04 High gamma and low delta indicate it is not ITM, reducing assignment risks further. Despite the low delta, the premium is small, making it cheaper to purchase and lowering the entry cost.
Mid-Term Strategy
-
August 16, 2024 Expiry:
-
Short Call: $10.0 Strike
- Delta: 0.65320
- Gamma: 0.17172
- Vega: 1.94099
- Theta: -0.00451
- Rho: 1.44612
- Premium: $1.15
- ROI: 68.82%
- Profit: $0.7914 The moderate delta decreases the assignment risk while enjoying higher premiums and ROI.
-
Long Call: $12.5 Strike
- Delta: 0.23116
- Gamma: 0.14691
- Vega: 1.61205
- Theta: -0.00353
- Rho: 0.55183
- Premium: $0.15 By selecting this, you further minimize assignment risk, albeit with slightly lesser protection, providing the best scenario of low risk for assignment and reasonably low costs.
Long-Term Strategy
-
November 15, 2024 Expiry:
-
Short Call: $10.0 Strike
- Delta: 0.63695
- Gamma: 0.11064
- Vega: 2.75985
- Theta: -0.00357
- Rho: 2.55711
- Premium: $1.35
- ROI: 73.44%
- Profit: $0.9914 Delta value of lower risk coupled with a high premium, great ROI serves well in this long-term spread strategy.
-
Long Call: $12.5 Strike
- Delta: 0.30938
- Gamma: 0.13025
- Vega: 2.62216
- Theta: -0.00272
- Rho: 1.40327
- Premium: $0.55 Evaluating delta and Greeks highlights that it is out of the money (OTM), which lines up in reducing risk for assignments while costing moderate premiums.
By choosing options with a balance of delta, ROI, and low assignment risk while focusing on target strike prices consistent with your target price expectations (2% over or under the current stock price), you could optimize profitability whilst mitigating risks.
Spread Option Strategy
When devising a calendar spread options strategy for Arcos Dorados Holdings Inc. (ARCO), it is crucial to consider the profitability alongside the risk factors involved in options trading. Given your objective to buy a call option and sell a put optionwhile minimizing the risk of having shares assignedwe need to scrutinize the "Greeks" and other critical parameters such as expiration dates, premiums, and return on investment (ROI).
1. Near-Term Strategy:
Buy Call Option: - Expiration Date: 2024-05-17 - Strike Price: $7.5 - The Greeks: - Delta: 0.9864087826 - Gamma: 0.0203502254 - Vega: 0.0191740084 - Theta: -0.0297755963 - Rho: 0.0201302749 - Premium: $3.15 - ROI: 0.0417 (4.17%) - Profit: $0.1314
Sell Put Option: - Expiration Date: 2024-05-17 - Strike Price: $7.5 - The Greeks: - Delta: -0.0536264312 - Gamma: 0.0449666751 - Vega: 0.0603255411 - Theta: -0.1321563148 - Rho: -0.0017176926 - Premium: $0.10 - ROI: 100.0% - Profit: $0.1
This near-term strategy minimizes risk due to a low delta on the put side, ensuring lower chances of share assignment. Both options have the same expiration date, providing a tight correlation for maximum profitability.
2. Mid-Term Strategy:
Buy Call Option (Same as the near-term)
Sell Put Option: - Expiration Date: 2024-06-21 - Strike Price: $10.0 - The Greeks: - Delta: -0.2670927247 - Gamma: 0.3070733521 - Vega: 1.0904979595 - Theta: -0.0046877479 - Rho: -0.2965701407 - Premium: $0.15 - ROI: 100.0% - Profit: $0.15
In the mid-term strategy, the delta on the put option is still moderate, reducing assignment risk while offering more profitability. The increased vega also indicates higher sensitivity to volatility, which could be advantageous in a volatile market.
3. Extended Mid-Term Strategy:
Buy Call Option (Same as the near-term)
Sell Put Option: - Expiration Date: 2024-08-16 - Strike Price: $7.5 - The Greeks: - Delta: -0.0683041104 - Gamma: 0.0484586854 - Vega: 0.6983160768 - Theta: -0.0018874215 - Rho: -0.2048656977 - Premium: $0.10 - ROI: 100.0% - Profit: $0.1
This strategy balances minimizing assignment risk and increasing holding duration to benefit from longer-term market movements while keeping a relatively low delta.
4. Long-Term Strategy:
Buy Call Option (Same as the near-term)
Sell Put Option: - Expiration Date: 2024-11-15 - Strike Price: $7.5 - The Greeks: - Delta: -0.1462965442 - Gamma: 0.0508298869 - Vega: 1.7100365416 - Theta: -0.0026624816 - Rho: -0.9842184316 - Premium: $0.12 - ROI: 100.0% - Profit: $0.12
By extending the duration further, this strategy offers higher premium income and still maintains a relatively low delta to keep assignment risk controlled.
5. Extended Long-Term Strategy:
Buy Call Option (Same as the near-term)
Sell Put Option: - Expiration Date: 2024-11-15 - Strike Price: $10.0 - The Greeks: - Delta: -0.3526587139 - Gamma: 0.1089969367 - Vega: 2.7606337241 - Theta: -0.0030674407 - Rho: -2.3592437388 - Premium: $0.7 - ROI: 100.0% - Profit: $0.7
This strategy targets higher profitability through a higher premium. However, it comes with an increased delta and rho, signifying a higher risk of assignment and sensitivity to interest rate changes.
Each strategy is crafted to balance profitability with assignment risk, providing options across different time horizons to suit various market conditions and risk tolerances.
Calendar Spread Option Strategy #1
The calendar spread strategy involves buying and selling options with different expiration dates but the same underlying asset. Our specific strategy will be to buy a put option with one expiration date and sell a call option with a different expiration date. Our aim is to capture profit based on the difference in time decay of the options (Theta) and volatility (Vega) while minimizing the risk associated with the in-the-money (ITM) options that may result in assignment of shares. Here are five expiration and strike price combinations across various time frames designed to maximize profit while minimizing risk:
1. Near-Term Strategy
Buy Put Option (Expiration Date: 2024-05-17, Strike Price: $2.5) - Greek Values: Delta: 0.9819, Gamma: 0.0013, Vega: 0.0246, Theta: -0.7791, Rho: 0.0008 - Premium: $10.3 - Profit: $2.4414 - ROI: 23.70%
Sell Call Option (Expiration Date: 2024-06-21, Strike Price: $12.5) - Greek Values: Delta: 0.1336, Gamma: 0.1451, Vega: 0.7152, Theta: -0.0045, Rho: 0.1300 - Premium: $0.04 - Profit: $0.04 - ROI: 100%
In this near-term strategy, we leverage the high theta decay of the short call option to gain maximum profit while the lower strike price put option is less likely to end up ITM soon, hence minimizing assignment risk.
2. Short-Term Strategy
Buy Put Option (Expiration Date: 2024-05-17, Strike Price: $5.0) - Greek Values: Delta: 0.9256, Gamma: 0.0196, Vega: 0.0778, Theta: -0.5031, Rho: 0.0107 - Premium: $6.0 - Profit: $0.6414 - ROI: 10.69%
Sell Call Option (Expiration Date: 2024-06-21, Strike Price: $10.0) - Greek Values: Delta: 0.7012, Gamma: 0.2672, Vega: 1.1471, Theta: -0.0066, Rho: 0.6472 - Premium: $0.8 - Profit: $0.4414 - ROI: 55.18%
This short-term approach involves a higher-risk put option just out-of-the-money reducing the assignment risk while capturing substantial premium from a high-theta-decaying call option.
3. Medium-Term Strategy
Buy Put Option (Expiration Date: 2024-06-21, Strike Price: $12.5) - Greek Values: Delta: 0.9517, Gamma: 0.0957, Vega: 0.3212, Theta: -0.5198, Rho: 1.1813 - Premium: $1.63 - Profit: $0.0886 - ROI: 5.43%
Sell Call Option (Expiration Date: 2024-08-16, Strike Price: $7.5) - Greek Values: Delta: 0.8030, Gamma: 0.0408, Vega: 1.4443, Theta: -0.0099, Rho: 1.1106 - Premium: $3.35 - Profit: $0.4914 - ROI: 14.67%
In this medium-term strategy, the put option's higher delta suggests some risk of assignment, but it is balanced by a similarly higher vega and theta of the call option aiming to maximize profit from volatility shifts.
4. Long-Term Strategy
Buy Put Option (Expiration Date: 2024-08-16, Strike Price: $10.0) - Greek Values: Delta: 0.6532, Gamma: 0.1717, Vega: 1.9410, Theta: -0.0045, Rho: 1.4461 - Premium: $1.15 - Profit: $0.7914 - ROI: 68.82%
Sell Call Option (Expiration Date: 2024-11-15, Strike Price: $10.0) - Greek Values: Delta: 0.6369, Gamma: 0.1106, Vega: 2.7599, Theta: -0.0036, Rho: 2.5571 - Premium: $1.35 - Profit: $0.9914 - ROI: 73.44%
The long-term strategy shifts towards moderate deltas to curb assignment risk while also taking advantage of high vega in the call option to capture volatility-driven gains.
5. Extra Long-Term Strategy
Buy Put Option (Expiration Date: 2024-08-16, Strike Price: $15.0) - Greek Values: Delta: 0.1206, Gamma: 0.0716, Vega: 1.0638, Theta: -0.0031, Rho: 0.2837 - Premium: $0.05 - Profit: $0.05 - ROI: 100%
Sell Call Option (Expiration Date: 2024-11-15, Strike Price: $12.5) - Greek Values: Delta: 0.3094, Gamma: 0.1303, Vega: 2.6222, Theta: -0.0027, Rho: 1.4033 - Premium: $0.55 - Profit: $0.55 - ROI: 100%
For the extra long-term strategy, we choose low delta put options significantly OTM to minimize assignment risk, pairing them with high vega call options to maximize potential profit from volatility and theta decay.
In summary, these strategies across different time horizons involve a balance between minimizing assignment risk and maximizing potential profit from time decay and volatility shifts. Each combination was selected for its potential to achieve high returns while minimizing potential downside risks.
Calendar Spread Option Strategy #2
When constructing a calendar spread strategy for Arcos Dorados Holdings Inc. (ARCO), the goal is to effectively balance risk and reward by selling a put option at one expiration date and buying a call option at a different expiration date. The aim is to profit from the time decay (theta) differential between the two options while minimizing the risk of having shares assigned. Here, we analyze various options based on their expiration dates and strike prices to structure the most profitable trades.
-
Near-Term Option (Short Put): Selling the put option expiring on 2024-06-21 with a strike price of $10.0 appears to be a lucrative choice. This option has a delta of 0.7012, indicating moderate likelihood of finishing in-the-money. The high gamma (0.2672) and vega (1.1471) make this option sensitive to changes in price and volatility, which is beneficial if the expectation is for stable to slightly bearish price action since the current price is close to this strike. With a premium of $0.8 and a significant ROI of 55.175%, the profit potential stands at $0.4414. The relatively high theta (-0.0066) suggests that time decay works in the favor of the seller as expiration nears.
-
Mid-Term Option (Long Call): Pairing the short put with a long call expiring on 2024-08-16 with a strike price of $10.0 can be an effective strategy. The longer expiration provides versatility to take advantage of potential upward moves in the underlying stock. With a delta of -0.6532, it's moderately responsive to changes in the underlying stock price. Its high gamma (0.1717) and vega (1.9410) also contribute positively in the current volatile market environment. The premium for this call is $1.15 with an ROI of 68.817%, yielding a lucrative profit of $0.7914. This combination allows taking advantage of both time decay and expected price volatility.
-
Longer-Term Option (Short Put): For a longer-term position, selling the put expiring on 2024-11-15 with a strike price of $12.5 provides a different dynamic. With a delta of 0.3094, this option is less likely to be assigned and thus mitigates risk. This contract's premium is $0.55, and with a remarkable ROI of 100%, the profit is maximized at $0.55. The theta value of -0.0027 suggests that even with time decay, the loss of value is minimal on a daily basis.
-
Long-Term Option (Long Call): A balanced pair for the above short put would be the long call expiring on 2024-11-15 with a strike price of $15.0. Its delta of -0.1258 makes it less sensitive to small price changes, reducing unnecessary risks. This option costs $0.22 with an ROI of 100%, promising a stable profit of $0.22. The option benefits from a high vega (1.5425) indicating a strong response to changes in volatility, making it a valuable hedge.
-
Extra Long-Term Option (Short Put): To incorporate an even longer horizon, selling the put expiring on 2024-11-15 with a strike price of $10.0 can be considered. With delta of 0.6369, it indicates a balanced likelihood of expiring in-the-money. The higher premium of $1.35 and considerable ROI of 73.437% result in a solid profit of $0.9914. This chosen option provides good income potential with moderate risk, considering a low theta of -0.0036.
In summary, combining short puts and long calls at various strikes and expirations can effectively tailor a profitable calendar spread strategy. The chosen expirations and strike prices mitigate assignment risk while providing balanced exposure to price movements and volatility. Monitoring the Greeks, particularly delta, gamma, and theta, allows for adjustments as market conditions evolve, ensuring optimal strategy performance.
Similar Companies in Restaurants:
BJ's Restaurants, Inc. (BJRI), Dine Brands Global, Inc. (DIN), Report: Brinker International, Inc. (EAT), Brinker International, Inc. (EAT), Ruth's Hospitality Group, Inc. (RUTH), Chuy's Holdings, Inc. (CHUY), Report: Bloomin' Brands, Inc. (BLMN), Bloomin' Brands, Inc. (BLMN), Report: Denny's Corporation (DENN), Denny's Corporation (DENN), The Cheesecake Factory Incorporated (CAKE), Potbelly Corporation (PBPB), Wingstop Inc. (WING), Report: McDonald's Corporation (MCD), McDonald's Corporation (MCD), Yum! Brands, Inc. (YUM), Restaurant Brands International Inc. (QSR), Jack in the Box Inc. (JACK), Wendy's Company (WEN), Report: Domino's Pizza, Inc. (DPZ), Domino's Pizza, Inc. (DPZ), Chipotle Mexican Grill, Inc. (CMG), Darden Restaurants, Inc. (DRI), Papa John's International, Inc. (PZZA), Dunkin' Brands Group, Inc. (DNKN)
https://finance.yahoo.com/news/arcos-dorados-holdings-nyse-arco-114806665.html
https://finance.yahoo.com/news/arcos-dorados-holdings-nyse-arco-115336858.html
https://finance.yahoo.com/news/earnings-watch-arcos-dorados-arco-070120936.html
https://finance.yahoo.com/news/arcos-dorados-reports-strong-first-112500266.html
https://finance.yahoo.com/news/arcos-dorados-nyse-arco-exceeds-114444903.html
https://finance.yahoo.com/news/arcos-dorados-q1-earnings-snapshot-114823338.html
https://finance.yahoo.com/news/arcos-dorados-q1-earnings-decline-115013227.html
https://finance.yahoo.com/news/sector-consumer-stocks-edge-higher-130904035.html
Copyright © 2024 Tiny Computers (email@tinycomputers.io)
Report ID: bnZqnl
Cost: $0.42022
https://reports.tinycomputers.io/ARCO/ARCO-2024-05-15.html Home