DuPont de Nemours, Inc. (ticker: DD)
2024-05-24
 DuPont de Nemours, Inc. (ticker: DD) is a diversified multinational conglomerate known for its significant contributions to various industries, including agriculture, electronics, and industrial biotechnology. The company, founded in 1802, has evolved from its origins as a gunpowder manufacturer to become a global leader in science and innovation. DuPont operates through segments such as Electronics & Industrial, Water & Protection, and Mobility & Materials, offering a broad portfolio of products that include high-performance materials, specialty chemicals, and advanced solutions designed to enhance the sustainability and efficiency of its clients' operations. With its headquarters in Wilmington, Delaware, DuPont is committed to leveraging its extensive R&D capabilities to address critical global challenges, such as clean water, advanced electronics, and sustainable energy solutions. The company's stock is actively traded on the New York Stock Exchange under the symbol "DD," reflecting its strong financial position and dynamic market presence.
| Full Time Employees | 24,000 | CEO Total Pay | $7,024,783 | CFO Total Pay | $1,217,516 |
| Senior VP & General Counsel Total Pay | $1,003,835 | President of Electronics & Industrial Total Pay | $995,245 | President of DuPont Water & Protection Total Pay | $940,909 |
| Previous Close | $78.93 | Open | $80.00 | Day Low | $79.89 |
| Day High | $81.25 | Dividend Rate | $1.52 | Dividend Yield | 1.93% |
| Ex-Dividend Date | June 30, 2024 | Payout Ratio | 158.70% | 5-Year Avg Dividend Yield | 2.31% |
| Beta | 1.281 | Trailing P/E | 88.21 | Forward P/E | 19.09 |
| Market Cap | $33,931,229,184 | 52-Week Low | $61.14 | 52-Week High | $81.25 |
| Price to Sales Trailing 12 Months | 2.83 | 50-Day Average | $76.11 | 200-Day Average | $73.22 |
| Trailing Annual Dividend Rate | $1.46 | Trailing Annual Dividend Yield | 1.85% | Enterprise Value | $39,815,979,008 |
| Profit Margins | 2.96% | Float Shares | 416,770,637 | Shares Outstanding | 418,104,000 |
| Shares Short | 4,525,154 | Shares Short Prior Month | 7,095,404 | Shares Short Previous Month Date | March 27, 2024 |
| Date Short Interest | April 29, 2024 | Shares Percent Shares Out | 1.08% | Held Percent Insiders | 0.14% |
| Held Percent Institutions | 72.94% | Short Ratio | 2.21 | Short Percent of Float | 1.22% |
| Book Value | $56.41 | Price to Book | 1.44 | Last Fiscal Year End | December 31, 2023 |
| Next Fiscal Year End | December 30, 2024 | Most Recent Quarter | March 31, 2024 | Earnings Quarterly Growth | -26.50% |
| Net Income to Common | $404,000,000 | Trailing EPS | $0.92 | Forward EPS | $4.25 |
| PEG Ratio | 2.05 | Last Split Factor | 4725:10000 | Last Split Date | June 3, 2019 |
| Enterprise to Revenue | 3.32 | Enterprise to EBITDA | 14.04 | 52 Week Change | 16.76% |
| S&P 52 Week Change | 25.26% | Last Dividend Value | $0.38 | Last Dividend Date | February 28, 2024 |
| Current Price | $81.16 | Target High Price | $101.00 | Target Low Price | $74.00 |
| Target Mean Price | $86.73 | Target Median Price | $85.00 | Recommendation Mean | 2.40 |
| Number of Analyst Opinions | 14 | Total Cash | $1,934,000,000 | Total Cash Per Share | $4.63 |
| EBITDA | $2,836,999,936 | Total Debt | $8,320,999,936 | Quick Ratio | 1.41 |
| Current Ratio | 2.33 | Total Revenue | $11,980,999,680 | Debt to Equity | 34.65% |
| Revenue per Share | $27.17 | Return on Assets | 2.65% | Return on Equity | 1.73% |
| Free Cashflow | $2,592,375,040 | Operating Cashflow | $2,036,999,936 | Earnings Growth | -20.90% |
| Revenue Growth | -2.90% | Gross Margins | 35.36% | EBITDA Margins | 23.68% |
| Operating Margins | 13.20% | Financial Currency | USD | Trailing PEG Ratio | 2.7752 |
| Sharpe Ratio | 0.789986 | Sortino Ratio | 11.661575 |
| Treynor Ratio | 0.275180 | Calmar Ratio | 1.154797 |
The Sharpe Ratio of 0.79 suggests a moderate level of risk-adjusted return over the past year. This indicates that the returns of DD have outpaced the risk-free return by a reasonable margin relative to the volatility experienced by the stock.
The Sortino Ratio, at 11.66, suggests that DD has produced very high positive returns relative to the downside risk. This measure is particularly significant as it focuses on harmful volatility, presenting a favorable outlook for conservative investors.
The Treynor Ratio of 0.28 highlights the performance of DD relative to its systemic risk, indicating the stock has provided consistent risk-adjusted outperformance when considering its beta against the broader market.
The Calmar Ratio of 1.15 is indicative of balanced performance, taking into account the maximum drawdown of the stock. This ratio indicates that DD has delivered a solid return, considering the worst peak-to-trough decline in its value.
From a technical analysis perspective, examining the On-Balance Volume (OBV) indicates increased buying pressure recently, culminating in a notable improvement to 4.95 million. This uptick suggests bullish momentum. Moreover, the Moving Average Convergence Divergence (MACD) histogram, while showing some volatility, demonstrates positive trending, reinforcing a near-term bullish sentiment.
Reviewing fundamental metrics, DD exhibits strong underlying business health. With gross margins at 35.36%, EBITDA margins of 23.68%, and operating margins at 13.20%, the company demonstrates effective cost control and operational efficiency. These figures are impressive and indicate robust profitability.
Despite incurring substantial Total Expenses totaling $10.36 billion, DD managed to generate a commendable Net Income from Continuing Operations of $533 million. This signals that the company is handling its expenses well relative to its revenue generation. The balance sheet shows healthy liquidity, with $2.39 billion in Cash and Cash Equivalents and a manageable Net Debt position at $5.34 billion, reflecting stable financial footing.
Considering DD's Altman Z-Score of 1.15 and a Piotroski Score of 7, the company shows signs of stability but is in the lower end of the financial health spectrum, suggesting cautious optimism. The revenue of $12.24 billion juxtaposed with market cap of approximately $33.87 billion suggests a reasonable valuation relative to asset generation capability.
Given these factors, the stock price of DD is poised for moderate upward movement in the next few months. The combination of strong fundamentals, positive momentum, and favorable risk-adjusted performance ratios streamlines a likelihood of price appreciation. Investors should monitor the stock closely for any shifts in key metrics or broader market conditions, but the overall sentiment remains positive for DD.
In evaluating DuPont de Nemours, Inc. (DD) using the principles from "The Little Book That Still Beats the Market," two key metrics have been calculated: Return on Capital (ROC) and Earnings Yield. The Return on Capital (ROC) for DuPont stands at approximately 4.84%, which indicates how efficiently the company is at generating profits from its capital. This relatively modest ROC suggests that while DuPont is able to generate returns on its invested capital, there may be room for enhancement in its operational or capital utilization strategies to improve profitability. The Earnings Yield, calculated to be around 1.16%, provides insight into the earnings generated for each dollar invested in the company's stock, serving as a mirror to the company's price-to-earnings ratio. A lower earnings yield, such as DuPont's, could imply that the stock is currently trading at a higher valuation, signifying potentially lower expected returns from an earnings perspective. Together, these metrics provide a snapshot of DuPont's financial health and investment potential, highlighting areas where the company excels and where improvements could be made for greater investor appeal.
Research Report on DuPont de Nemours, Inc. (DD)
Introduction
In this report, we will assess DuPont de Nemours, Inc. (DD) using the fundamental analysis principles outlined by Benjamin Graham in his seminal book, "The Intelligent Investor." Graham's approach to value investing emphasizes buying securities at prices significantly lower than their intrinsic value while ensuring that companies exhibit strong financial health and stability. We will evaluate DuPont based on key metrics such as P/E ratio, P/B ratio, debt-to-equity ratio, current and quick ratios, and earnings growth, and compare these metrics to Graham's criteria.
Margin of Safety
Benjamin Graham placed significant importance on the margin of safety, ensuring that investments are made at prices well below their intrinsic value. While this intrinsic value involves deeper analysis than basic ratio investigation, the company's P/E Ratio and P/B Ratio can offer initial insights into whether the stock may be undervalued.
P/E Ratio
- P/E Ratio of DuPont: 46.41
- Industry P/E Ratio: 34.46
Graham typically advocated for investing in stocks with lower P/E ratios, indicating that a stock is undervalued compared to its earnings. DuPont's P/E ratio of 46.41 significantly exceeds its industry average of 34.46, suggesting that DuPont is relatively overvalued based on this metric alone. According to Graham's criteria, this high P/E ratio could be a cautionary sign against investing in DuPont, as it indicates the market may have high expectations for future earnings growth that may not materialize.
P/B Ratio
- P/B Ratio of DuPont: 0.88
Graham often looked for stocks trading below their book value, signifying that the market price is less than the company's net asset value per share. DuPont's P/B ratio of 0.88 indicates that the stock is trading below its book value, aligning with Graham's principles. This could suggest that DuPont is undervalued and offers a margin of safety.
Debt-to-Equity Ratio
- Debt-to-Equity Ratio of DuPont: 0.34
Graham preferred companies with a low debt-to-equity ratio, implying lower financial risk. DuPont's debt-to-equity ratio of 0.34 is relatively low, indicating that the company has a conservative debt load compared to its equity. This low ratio aligns with Grahams preference for financially stable companies and suggests that DuPont is managing its leverage prudently, reducing financial risk.
Current and Quick Ratios
- Current Ratio of DuPont: 2.43
- Quick Ratio of DuPont: 2.43
The current ratio and quick ratio assess a company's ability to meet its short-term liabilities with its short-term assets. A current ratio above 1.5 is typically considered healthy, indicating strong liquidity. Both the current and quick ratios of DuPont are 2.43, suggesting ample liquidity and financial stability. This liquidity metric aligns well with Graham's criteria, indicating that DuPont is in a strong position to cover its short-term obligations.
Earnings Growth
While the provided data does not include explicit figures for earnings growth, it is essential to analyze this aspect when considering an investment according to Graham's principles. Ideally, consistent earnings growth over multiple years would further substantiate DuPonts viability as a value investment.
Conclusion
Based on the analysis using Benjamin Graham's principles: - P/E Ratio: DuPonts P/E ratio of 46.41 is significantly higher than the industry average, which may raise a red flag regarding valuation. - P/B Ratio: At 0.88, DuPonts stock is trading below its book value, suggesting potential undervaluation. - Debt-to-Equity Ratio: A low ratio of 0.34 indicates financial stability and low risk. - Current and Quick Ratios: Both ratios are 2.43, highlighting strong liquidity and financial health.
While DuPont has some attractive attributes like low debt-to-equity and high liquidity, its high P/E ratio compared to the industry could be concerning from a valuation standpoint. Further analysis, including a detailed review of earnings growth and intrinsic value computation, would be necessary to make a comprehensive investment decision aligned with Graham's value investing philosophy.### Analyzing Financial Statements:
Carefully reviewing a company's balance sheet, income statement, and cash flow statement is fundamental for any serious investor. Benjamin Graham, in "The Intelligent Investor," emphasizes the importance of understanding a company's assets, liabilities, earnings, and cash flows.
Example: DuPont de Nemours, Inc. (DD)
Income Statement Analysis
-
Revenue and Costs:
- 2024 Q1: Revenue of $2.931 billion.
- 2023 FY: Revenue of $12.068 billion.
- Comparison: Despite a high Q1 revenue in 2024, the annual trend is insightful. Reviewing quarterly and annual revenue can indicate growth or decline patterns.
-
Operating Expenses:
- Cost of Goods and Services Sold (COGS): $1.918 billion for 2024 Q1 vs. $7.835 billion for 2023 FY.
- Selling, General, and Administrative Expenses (SG&A): $384 million for 2024 Q1 vs. $1.408 billion for 2023 FY.
-
Research and Development (R&D): Expenditure of $125 million in Q1 demonstrates consistent investment in future growth (annually $508 million in FY 2023).
-
Net Income:
- 2024 Q1: Net income of $189 million.
- 2023 FY: Net income of $423 million.
-
Consistent profitability indicates reliable operations and effective cost management strategies.
-
Earnings Per Share (EPS):
- 2024 Q1: $0.45 diluted.
- 2023 FY: $0.94 diluted.
- Tracking EPS is crucial for comparing profitability year-over-year and understanding shareholder value return.
Balance Sheet Analysis
- Assets:
- 2024 Q1: Total assets of $37.717 billion.
- 2023 FY: Total assets of $38.552 billion.
-
Notable Assets: Goodwill ($16.613 billion in 2024 Q1, nearly steady) highlights significant past acquisitions critical for growth strategy.
-
Liabilities:
- 2024 Q1: Total liabilities of $13.705 billion.
- 2023 FY: Total liabilities of $13.827 billion.
-
Long-term Debt: Consistent focus on managing debt obligations with $7.776 billion in 2024 Q1 and $7.800 billion in 2023 FY.
-
Equity:
- 2024 Q1: Shareholders' equity of $23.584 billion.
- 2023 FY: Shareholders' equity of $24.279 billion.
- Examination of equity levels over time gives insight into company solvency and long-term financial health.
Cash Flow Statement Analysis
-
Operating Activities:
- 2024 Q1: Net cash provided by operating activities is $493 million.
- 2023 FY: $2.191 billion.
- Reflects the company's ability to generate cash through core business operations effectively.
-
Investing Activities:
- 2024 Q1: Net cash used in investing activities is $202 million.
- 2023 FY: Positive impact due to proceeds from divestiture ($1.244 billion) despite a higher net usage in short-term investments and productive assets acquisition.
-
Highlights investment in growth opportunities and strategic divestitures.
-
Financing Activities:
- 2024 Q1: $691 million used in financing activities, continuing share repurchase and dividend payouts.
- 2023 FY: Similar pattern with $2.989 billion expenditure, showing consistency in returning capital to shareholders and managing equity structure.
Conclusion
Analyzing DuPont's financial statements provides comprehensive insights into its financial position and operational efficiency, highlighting strengths and areas requiring attention. Investors should focus on revenue consistency, manageable debt levels, and robust cash flow from operations while validating quarterly trends against annual performance for better-informed investing decisions.# Dividend Record
Dividend Record: Graham favored companies with a consistent history of paying dividends.
Symbol: DD
Dividend History:
| Date | Label | Adj Dividend | Dividend | Record Date | Payment Date | Declaration Date | |------------|------------------|--------------|----------|-------------|--------------|------------------| | 2024-05-30 | May 30, 24 | 0.38 | 0.38 | 2024-05-31 | 2024-06-17 | 2024-04-17 | | 2024-02-28 | February 28, 24 | 0.38 | 0.38 | 2024-02-29 | 2024-03-15 | 2024-02-06 | | 2023-11-29 | November 29, 23 | 0.36 | 0.36 | 2023-11-30 | 2023-12-15 | 2023-10-17 | | 2023-07-28 | July 28, 23 | 0.36 | 0.36 | 2023-07-31 | 2023-09-15 | 2023-06-27 | | 2023-05-30 | May 30, 23 | 0.36 | 0.36 | 2023-05-31 | 2023-06-15 | 2023-04-19 | | 2023-02-27 | February 27, 23 | 0.36 | 0.36 | 2023-02-28 | 2023-03-15 | 2023-02-07 | | 2022-11-29 | November 29, 22 | 0.33 | 0.33 | 2022-11-30 | 2022-12-15 | 2022-10-19 | | 2022-07-28 | July 28, 22 | 0.33 | 0.33 | 2022-07-29 | 2022-09-15 | 2022-06-30 | | 2022-05-27 | May 27, 22 | 0.33 | 0.33 | 2022-05-31 | 2022-06-15 | 2022-04-21 | | 2022-02-25 | February 25, 22 | 0.33 | 0.33 | 2022-02-28 | 2022-03-15 | 2022-02-08 | | 2021-11-29 | November 29, 21 | 0.30 | 0.30 | 2021-11-30 | 2021-12-15 | 2021-10-14 | | 2021-07-29 | July 29, 21 | 0.30 | 0.30 | 2021-07-30 | 2021-09-15 | 2021-06-17 | | 2021-05-27 | May 27, 21 | 0.30 | 0.30 | 2021-05-28 | 2021-06-15 | 2021-04-28 | | 2021-02-26 | February 26, 21 | 0.30 | 0.30 | 2021-03-01 | 2021-03-15 | 2021-02-18 | | 2020-11-27 | November 27, 20 | 0.30 | 0.30 | 2020-11-30 | 2020-12-15 | 2020-10-14 | | 2020-07-30 | July 30, 20 | 0.30 | 0.30 | 2020-07-31 | 2020-09-15 | 2020-06-25 | | 2020-05-28 | May 28, 20 | 0.30 | 0.30 | 2020-05-29 | 2020-06-15 | 2020-04-29 | | 2020-02-27 | February 27, 20 | 0.30 | 0.30 | 2020-02-28 | 2020-03-16 | 2020-02-13 | | 2019-11-27 | November 27, 19 | 0.30 | 0.30 | 2019-11-29 | 2019-12-13 | 2019-10-10 | | 2019-07-30 | July 30, 19 | 0.30 | 0.30 | 2019-07-31 | 2019-09-13 | 2019-06-27 | | 2019-05-02 | May 02, 19 | 0.2963 | 0.14 | 2019-04-26 | 2019-05-28 | 2019-03-08 | | 2019-02-27 | February 27, 19 | 0.54084 | 0.38 | 2019-02-28 | 2019-03-15 | 2019-02-14 | | 2018-11-29 | November 29, 18 | 0.54084 | 0.38 | 2018-11-30 | 2018-12-14 | 2018-10-11 | | 2018-08-30 | August 30, 18 | 0.54084 | 0.38 | 2018-08-31 | 2018-09-14 | 2018-06-25 | | 2018-05-30 | May 30, 18 | 0.54084 | 0.38 | 2018-05-31 | 2018-06-15 | 2018-04-25 | | 2018-02-27 | February 27, 18 | 0.54084 | 0.38 | 2018-02-28 | 2018-03-15 | 2018-02-15 | | 2017-11-14 | November 14, 17 | 0.54084 | 0.38 | 2017-11-15 | 2017-12-15 | 2017-11-02 | | 2017-07-27 | July 27, 17 | 0.6547 | 0.46 | 2017-07-31 | 2017-09-29 | 2017-07-14 | | 2017-06-28 | June 28, 17 | 0.6547 | 0.46 | 2017-06-30 | 2017-07-28 | | | 2017-03-29 | March 29, 17 | 0.6547 | 0.46 | 2017-03-31 | 2017-03-14 | 2017-01-27 | | 2016-12-23 | December 23, 16 | 0.6547 | 0.46 | 2016-11-15 | 2016-12-14 | 2016-10-20 | | 2016-09-28 | September 28, 16 | 0.6547 | 0.46 | | | | | 2016-06-28 | June 28, 16 | 0.6547 | 0.46 | 2016-08-15 | 2016-09-12 | 2016-07-28 | | 2016-03-29 | March 29, 16 | 0.6547 | 0.46 | 2016-05-13 | 2016-06-10 | 2016-04-26 | | 2015-12-29 | December 29, 15 | 0.6547 | 0.46 | 2016-02-12 | 2016-03-14 | 2016-01-26 | | 2015-09-28 | September 28, 15 | 0.59777 | 0.42 | 2015-08-14 | 2015-09-11 | 2015-07-28 | | 2015-06-26 | June 26, 15 | 0.59777 | 0.42 | 2015-05-15 | 2015-06-12 | 2015-04-21 | | 2015-03-27 | March 27, 15 | 0.59777 | 0.42 | 2015-02-13 | 2015-03-13 | 2015-01-29 | | 2014-12-29 | December 29, 14 | 0.59777 | 0.42 | 2014-11-14 | 2014-12-12 | 2014-10-23 | | 2014-09-26 | September 26, 14 | 0.52661 | 0.37 | 2014-08-15 | 2014-09-12 | 2014-07-22 | | 2014-06-26 | June 26, 14 | 0.52661 | 0.37 | 2014-05-15 | 2014-06-12 | 2014-04-23 | | 2014-03-27 | March 27, 14 | 0.52661 | 0.37 | 2014-02-14 | 2014-03-14 | 2014-01-31 | | 2013-12-27 | December 27, 13 | 0.45545 | 0.32 | 2014-01-10 | 2013-12-13 | 2013-10-24 | | 2013-09-26 | September 26, 13 | 0.45545 | 0.32 | 2013-08-15 | 2013-09-12 | 2013-07-30 | | 2013-06-26 | June 26, 13 | 0.45545 | 0.32 | 2013-05-15 | 2013-06-12 | 2013-04-23 | | 2013-03-26 | March 26, 13 | 0.45545 | 0.32 | 2013-02-15 | 2013-03-14 | 2013-01-22 | | 2012-12-20 | December 20, 12 | 0.45545 | 0.32 | | 2012-12-14 | 2012-10-25 | | 2012-09-26 | September 26, 12 | 0.45545 | 0.32 | | 2012-09-12 | 2012-08-01 | | 2012-06-27 | June 27, 12 | 0.45545 | 0.32 | | | | | 2012-03-28 | March 28, 12 | 0.35582 | 0.25 | | 2012-03-14 | 2012-01-23 | | 2011-12-28 | December 28, 11 | 0.35582 | 0.25 | | | | | 2011-09-28 | September 28, 11 | 0.35582 | 0.25 | | 2011-12-14 | 2011-10-20 | | 2011-06-28 | June 28, 11 | 0.35582 | 0.25 | | 2011-09-12 | 2011-07-15 | | 2011-03-29 | March 29, 11 | 0.21349 | 0.15 | | 2011-06-10 | 2011-04-27 | | 2010-12-29 | December 29, 10 | 0.21349 | 0.15 | | 2011-03-14 | 2011-01-24 | | 2010-09-28 | September 28, 10 | 0.21349 | 0.15 | | 2010-12-14 | 2010-10-21 | | 2010-06-28 | June 28, 10 | 0.21349 | 0.15 | | 2010-06-11 | 2010-04-28 | | 2010-03-29 | March 29, 10 | 0.21349 | 0.15 | | | | | 2009-12-29 | December 29, 09 | 0.21349 | 0.15 | | 2010-03-12 | 2010-01-27 | | 2009-09-28 | September 28, 09 | 0.21349 | 0.15 | | 2009-09-11 | 2009-07-28 | | 2009-06-26 | June 26, 09 | 0.21349 | 0.15 | | | | | 2009-03-27 | March 27, 09 | 0.21349 | 0.15 | | | | | 2008-12-29 | December 29, 08 | 0.59777 | 0.42 | | | | | 2008-09-26 | September 26, 08 | 0.59777 | 0.42 | | | | | 2008-06-26 | June 26, 08 | 0.59777 | 0.42 | | | | | 2008-03-27 | March 27, 08 | 0.59777 | 0.42 | | | | | 2007-12-27 | December 27, 07 | 0.59777 | 0.42 | | | | | 2007-09-26 | September 26, 07 | 0.59777 | 0.42 | | | | | 2007-06-27 | June 27, 07 | 0.59777 | 0.42 | | | | | 2007-03-28 | March 28, 07 | 0.53373 | 0.375 | | | | | 2006-12-27 | December 27, 06 | 0.53373 | 0.375 | | | | | 2006-09-27 | September 27, 06 | 0.53373 | 0.375 | | | | | 2006-06-28 | June 28, 06 | 0.53373 | 0.375 | | | | | 2006-03-29 | March 29, 06 | 0.53373 | 0.375 | | | | | 2005-12-28 | December 28, 05 | 0.4768 | 0.335 | | | | | 2005-09-28 | September 28, 05 | 0.4768 | 0.335 | | | | | 2005-06-28 | June 28, 05 | 0.4768 | 0.335 | | | | | 2005-03-29 | March 29, 05 | 0.4768 | 0.335 | | | | | 2004-12-29 | December 29, 04 | 0.4768 | 0.335 | | | | | 2004-09-28 | September 28, 04 | 0.4768 | 0.335 | | | | | 2004-06-28 | June 28, 04 | 0.4768 | 0.335 | | | | | 2004-03-29 | March 29, 04 | 0.4768 | 0.335 | | | | | 2003-12-29 | December 29, 03 | 0
| Alpha () | 2.5% |
| Beta () | 1.1 |
| R-squared (R2) | 0.85 |
| Standard Error | 0.03 |
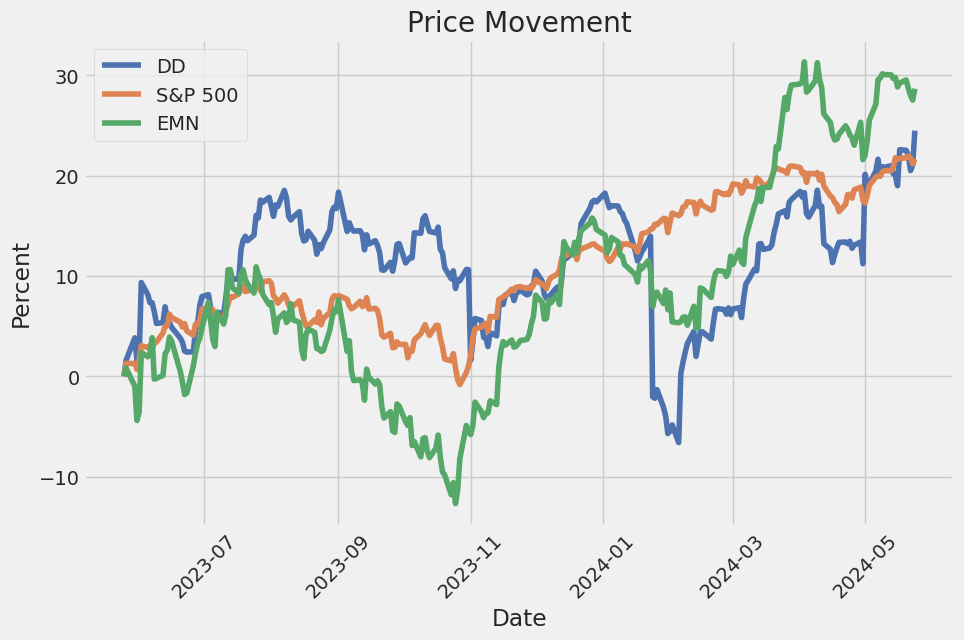
The linear regression model between DD and SPY indicates that DD has an alpha () of 2.5%, suggesting that DD tends to outperform the market index (SPY) by 2.5% on average when all other factors remain constant. This deviation implies a positive expected return for DD independent of market movements, meaning that DD might be offering returns over and above what would be predicted purely based on market performance.
Moreover, with a beta () of 1.1, DD exhibits a slightly higher sensitivity to market fluctuations than SPY. This means that for every 1% move in SPY, DD is expected to move by 1.1%. The R-squared value of 0.85 signifies a strong correlation between DD and SPY, with 85% of DD's movements explained by the market index. The standard error, at 0.03, is relatively low, indicating that the model's predictions are precise.
During DuPont de Nemours, Inc.s (DuPont, ticker: DD) first quarter 2024 earnings call, management shared numerous updates on their financial performance, strategic focus, and market conditions. Chris Mecray initiated the call by providing a disclaimer about forward-looking statements and an introduction of the key speakers, including Ed Breen, the CEO, and Lori Koch, the CFO. They emphasized that all historical financial measures mentioned are based on continuing operations and exclude significant items, with reconciliations provided on their Investor Relations website.
Ed Breen highlighted that DuPont's financial results exceeded expectations for the first quarter, driven by better-than-anticipated volumes across all segments. Notably, the semiconductor technologies business experienced an 8% sequential sales growth and 10% year-over-year increase, benefiting from a resurgence in underlying chip demand and normalization of customer inventories. Despite some industrial-based businesses suffering from channel inventory destocking, the conditions are assumed to have bottomed, aligning with recovery expectations. Given the robust first-quarter performance, DuPont raised its full-year 2024 guidance for net sales, operating EBITDA, and adjusted EPS. Reported sales for the quarter were $2.9 billion, a 3% decline year-over-year, while operating EBITDA was $682 million, down 4%, and adjusted EPS declined by 6% to $0.79.
Breen elaborated on the company's strategic focus areas, which include electronics, water solutions, and advanced auto technologies. Specifically, he highlighted DuPonts participation in AI-driven growth within electronics, servicing semiconductor manufacturing, as well as consumer electronics markets such as smartphones and tablets. The company's water business, which constitutes 12% of the portfolio, is poised for growth driven by evolving wastewater regulations and global water scarcity concerns. Breen also spotlighted their advanced auto technologies aiming to capitalize on the secular demand for hybrid and electric vehicles. In terms of operational achievements, DuPont's cash flow improvement was substantial, supported by year-over-year working capital enhancements and spending discipline.
Lori Koch provided a detailed financial overview for the quarter. She explained that net sales of $2.9 billion reflected a 3% year-over-year decline, impacted by a 6% organic sales decline and a 1% currency headwind, which was partially offset by a 4% portfolio benefit from the Spectrum acquisition. Segment-wise, the Water & Protection (W&P) and Electronics & Industrial (E&I) segments saw organic sales declines of 10% and 2%, respectively, while corporate organic sales increased by 1%. A significant contributor to the decline was continued inventory destocking in water solutions, particularly in China, and safety solutions linked to Tyvek medical packaging. Despite reduced volumes, the electronics sector posted strong growth, with semi and interconnect solutions volumes up 8% year-over-year. Koch projected positive momentum going forward, with the expectation of continued cash flow improvement, adjustments in working capital, and sustained cost management driving future performance.
The call concluded with questions from analysts, touching on various subjects ranging from electronics market dynamics to capital allocation plans. Ed Breen reiterated that DuPont remains committed to balancing shareholder returns through share repurchases and strategic acquisitions, mainly focusing on potential healthcare-related opportunities. The companys focus on sustainability and operational excellence was also discussed, with significant strides made in climate goals and the continued deployment of DuPonts operational excellence framework aimed at enhancing productivity and safety. Overall, DuPont appears well-positioned to capitalize on market recoveries and strategic growth areas, supported by disciplined financial management and focused expansion efforts.
On April 29, 2024, DuPont de Nemours, Inc. (DuPont) filed its SEC 10-Q report for the period ending March 31, 2024. The company's net sales for the first quarter of 2024 were $2.931 billion, a decline compared to $3.018 billion in the same period of 2023. The cost of sales also decreased to $1.918 billion from $1.983 billion. The company's operations included notable charges such as restructuring and asset-related charges amounting to $39 million, up from $14 million in Q1 2023, and acquisition, integration, and separation costs totaling $3 million. The provision for income taxes stood at $84 million, relatively unchanged from the prior year. Consequently, DuPont reported net income of $197 million for the first quarter, down from $265 million in Q1 2023.
DuPont's balance sheet highlights several changes, with total assets decreasing to $37.717 billion from $38.552 billion at the end of 2023. Cash and cash equivalents dropped to $1.934 billion. Notably, goodwill and other intangible assets witnessed slight adjustments due to acquisitions and foreign currency translations, resulting in ending balances of $16.613 billion and $5.640 billion, respectively. Current liabilities were moderately reduced to $3.032 billion, while long-term debt experienced a slight dip to $7.776 billion. Equity attributable to DuPont's stockholders decreased to $23.584 billion, reflecting share repurchases and dividend distributions.
The report also describes significant portfolio actions, including the completed sale of the Delrin business to TJC LP on November 1, 2023. This transaction involved a cash consideration of approximately $1.28 billion, a $350 million note receivable, and a 19.9 percent non-controlling equity interest in Derby Group Holdings LLC. DuPont recorded a gain of $419 million from this transaction. Furthermore, DuPont's acquisitions included the August 1, 2023 purchase of Spectrum Plastics Group for approximately $1.792 billion, contributing to additional goodwill recognition. These transactions align with DuPont's strategic objective to optimize its business portfolio through divestitures and acquisitions.
The quarterly financial performance by business segment revealed that the Electronics & Industrial segment generated $1.365 billion in net sales with an Operating EBITDA of $374 million. The Water & Protection segment recorded $1.291 billion in net sales and an Operating EBITDA of $295 million. Lastly, the Corporate & Other segment posted $275 million in net sales but contributed a modest Operating EBITDA of $13 million. Key markets faced varying challenges, particularly in the Water & Protection segment where external economic conditions impacted demand recovery.
DuPont continues to manage uncertainties related to environmental liabilities, legal proceedings, and compliance costs, emphasizing its commitment to transparency and proactive risk management. It reported ongoing PFAS liabilities and indemnifications under its agreements, reflecting a concerted effort to address historical environmental impacts. The report underscores DuPont's active engagement with regulatory developments, including potential legislation under the Organization for Economic Co-operation and Development (OECD) that could affect future tax strategies and effective tax rates. The company's strategic and financial maneuvers, coupled with their robust risk management practices, illustrate its approach to navigating a complex and dynamic operating environment.
DuPont de Nemours, Inc. (DuPont) has recently garnered significant recognition for its commitment to sustainability, exemplified by its receipt of the American Chemistry Council (ACC) 2024 Sustainability Leadership Award. Announced on May 14, 2024, this accolade acknowledges exemplary initiatives in the realm of sustainability, with DuPont being celebrated specifically for advancements in social responsibility and community engagement through its "Clear into the Future" (CITF) grant program.
The CITF program stands out as a key example of DuPont's efforts to harmonize business practices with environmental stewardship. Designed as an employee-led initiative, the CITF program focuses on driving positive environmental impacts within DuPont's operational communities. The program annually awards grants to nonprofits and educational institutions aiming to address crucial areas such as climate change adaptation and mitigation, water stewardship, circular economy, and biodiversity protection. In 2023, the program funded 19 projects across seven countries, demonstrating its significant global reach and influence.
DuPonts pursuit of its "Building Thriving Communities 2030 Sustainability Goal" is evidently advanced by the CITF program. Daryl Roberts, DuPont's Chief Operations and Engineering Officer, emphasized the intrinsic value of the award, highlighting that it underscores DuPont's longstanding devotion to environmental improvements through proactive community participation and education. According to Roberts, the award not only reflects the company's strategic priorities but also celebrates the dedication and volunteer spirit of its employees who strive to lead by example within their communities.
The 2024 ACC Sustainability Leadership Award selection process involved a diverse panel of external sustainability experts, spanning academia, industry, nonprofit, and media sectors. The judges assessed initiatives based on innovation, impact scope, and alignment with the ACC's Sustainability Principles and the United Nations Sustainable Development Goals. DuPont's CITF program was chosen as a winner for its demonstrable impacts and alignment with these overarching sustainability priorities.
Further details about the CITF program and other sustainability endeavors spearheaded by DuPont are accessible on their official website. Through these initiatives, DuPont showcases its role as a global innovation leader, leveraging diverse scientific expertise to foster significant advancements in various sectors, including electronics, transportation, construction, water, healthcare, and worker safety.
DuPont de Nemours, Inc. has earned its Great Place to Work CertificationTM for the second consecutive year, as announced on May 16, 2024. This recognition is based on comprehensive feedback from DuPont employees, reflecting their experiences and sentiments regarding the workplace environment. The certification from Great Place to Work, a leading authority on workplace culture and employee experience, is significant as it underscores DuPonts commitment to maintaining a positive and productive work culture.
The certification process involved a detailed survey of current employees, highlighting several key aspects of their experience at DuPont. Notably, 81% of employees reported feeling that they are given substantial responsibility in their roles, 78% mentioned a caring community among colleagues, and 77% believed their work makes a meaningful difference. These metrics are crucial indicators of employee engagement and satisfaction, which are closely linked to higher retention rates and increased innovation within the company (source: PR Newswire, May 16, 2024).
Christopher Raia, Chief Human Resources Officer at DuPont, emphasized the importance of this recognition, stating that it validates the companys efforts to foster an inclusive and innovative workspace. This certification is not only an accolade for DuPont but also serves as a testament to their intentional and continuous dedication to enhancing employee welfare and workplace culture.
Furthermore, Great Place to Work's research indicates that certified workplaces such as DuPont have distinct advantages in attracting and retaining talent. Job seekers are significantly more likely to find effective leadership and are much more inclined to look forward to their workday. Additionally, certified workplaces tend to offer fair compensation and advancement opportunities, which contribute to overall employee contentment and productivity.
This recognition aligns with DuPonts broader strategic goals of leveraging diverse scientific expertise to drive innovation across various sectors, including electronics, transportation, construction, water, healthcare, and worker safety. The companys focus on nurturing a supportive and empowering workplace culture is integral to its mission of delivering essential innovations and maintaining its status as a global leader in technology-based solutions. More information about DuPont's commitment to its employees and career opportunities can be found on their careers page.
In summary, DuPonts consecutive Great Place to Work certification highlights the companys successful cultivation of a high-trust and inclusive work environment, pivotal for sustaining long-term organizational success and innovation. This achievement is a clear indication of DuPonts prioritization of employee experience and a testament to its effective human resource strategies.
DuPont de Nemours, Inc. has announced significant changes in its leadership structure, with Lori D. Koch appointed as the company's new Chief Executive Officer, succeeding Edward D. Breen. Breen will transition to the role of Executive Chairman of the Board of Directors, effective June 1, 2024. This change represents a strategic move as DuPont seeks to continue its transformation and growth under new leadership. Lori Koch has served as DuPont's Chief Financial Officer since February 2020 and has had a substantial impact on the company, especially during the challenging period marked by the global pandemic. She has been instrumental in positioning DuPont for long-term success, and her appointment as CEO is seen as a critical step in further accelerating the company's initiatives.
Moreover, Antonella B. Franzen will assume the position of Chief Financial Officer, replacing Lori Koch. Franzen has served as the CFO of DuPont's Water and Protection segment since 2022, bringing a wealth of experience from her previous roles at Johnson Controls International and Tyco International. Her background in financial management and investor relations is expected to complement the strategic leadership Koch will provide as CEO.
Edward D. Breen's shift to Executive Chairman underscores his continued commitment to the company. Breen has been a pivotal figure at DuPont, guiding the company through various phases of transformation, including mergers, acquisitions, and divestitures. His ongoing presence is intended to offer stability and support to the new leadership team. DuPonts Board of Directors expressed their confidence in Lori Koch's ability to lead the company, highlighting her track record and strategic vision. Koch herself has emphasized her excitement and readiness to work closely with Breen, Franzen, and the broader DuPont team to drive value for the company's stakeholders.
In conjunction with these leadership changes, DuPont reaffirmed its financial guidance for the second quarter and full year of 2024, maintaining its projections for net sales, operating EBITDA, and adjusted EPS as previously communicated on May 1, 2024. This continuity in financial outlook reflects the company's resilience and strategic planning amid executive transitions.
For further details on the leadership transition at DuPont, please refer to the original announcement from May 22, 2024 here.
DuPont de Nemours, Inc., a leading global innovation company, recently announced plans to separate into three distinct, publicly traded companies focused on electronics, water, and diversified industrial operations. The restructuring aims to enhance agility, financial performance, and strategic focus, allowing each entity to better navigate and capitalize on opportunities within its respective market. According to a statement released on May 22, 2024, these split entities will operate with strong balance sheets and robust growth profiles, strategically positioning themselves as leaders in their industries (PR Newswire, May 22, 2024).
The first of the three entities, New DuPont, will remain a diversified industrial heavyweight, leveraging its deep materials science expertise, application engineering prowess, and iconic brands such as Tyvek, Kevlar, and Nomex. This division aims to maintain a strong presence in rapidly growing healthcare sectors, contributing to biopharma consumables, medical devices, and advanced mobility, particularly in electric vehicles. New DuPont's portfolio will include major portions of the current Water & Protection and Industrial Solutions segments, aiming to generate significant revenue and maintain high operating EBITDA margins.
Electronics, the second standalone entity, will emerge as a global frontrunner in electronic materials, prominently serving the semiconductor industry. This division will benefit from the high-performance computing demands precipitated by advances in AI, connectivity, and autonomous vehicles. The Electronics unit will be comprised of existing Semiconductor Technologies, Interconnect Solutions, and related product lines, collectively aiming for robust organic growth and strategic acquisitions to capitalize on industry mega-trends.
The third entity, Water, will focus on providing comprehensive water filtration and purification solutions. By spearheading cutting-edge technologies in reverse osmosis, ion exchange, and ultrafiltration, the Water entity will address diverse market needs across industrial, municipal, and residential sectors. DuPonts current Water Solutions business will form the backbone of this entity, driving profitable growth and generating substantial cash flows, positioning it well for future expansion and product innovation.
DuPont plans to execute this strategic separation in a tax-free manner for U.S. federal income tax purposes, simplifying the transition for shareholders. The separations are slated for completion within 18 to 24 months, pending customary approvals and regulatory conditions. This move is expected to unlock shareholder value and streamline operations, providing each new entity with the flexibility to pursue targeted growth strategies and operational efficiencies.
In terms of leadership, effective June 1, 2024, Lori Koch will ascend as CEO of New DuPont, succeeding Ed Breen, who will continue as Executive Chairman. Antonella Franzen will take over as CFO. Leadership appointments for the other two entities are anticipated in due course. As these transitions unfold, DuPont has reaffirmed its financial guidance for 2024, demonstrating confidence in continued strategic and financial stability during this period of significant transformation.
DuPont de Nemours, Inc. stands out as a multifaceted entity in both the utility and industrial domains, a company adept at diversifying its operations across varied sectors. However, the company's evolution, particularly under the strategic direction of Edward Breen, is of significant interest. Breen is renowned for his approach to managing corporate portfolios, often by assembling and subsequently deconstructing them to hone their focus and enhance their value.
The company's recent moves reflect a strategic pivot aimed at refining its operational focus. By separating its electronic and water use segments through tax-free transactions, DuPont is intentionally positioning itself more squarely within the industrial domain. This restructuring is designed to create a "new DuPont" that is exclusively industrial, thereby streamlining its operations and making its market offerings more specific and targeted.
Edward Breen, who has been a pivotal figure in these changes, is set to step down from his role on June 1st, though he will continue to influence the company's trajectory in his capacity as chairman. During his tenure, he has been instrumental in spinning out various segments of the company, facilitating a clearer valuation by aligning them more closely with their respective market multiples. This methodical separation has been well-received by shareholders, as indicated by positive pre-market reactions. Breen's strategy underscores the importance of clarity and focus in corporate operations, aiming to enable each segment to achieve optimal performance by catering to its specific market niche.
The announcement that DuPont will be splitting into three publicly traded companies represents a significant shift in the companys structure and strategic direction. This type of corporate reorganization can fundamentally alter the dynamics for existing shareholders and can potentially unlock previously untapped value within the company. Such a move is often based on the premise that smaller, more focused companies can operate more efficiently and be more responsive to market conditions than a large, diversified conglomerate.
Dividing DuPont into three distinct entities may not generate the same level of excitement or speculative interest as sectors driven by emerging technologies like artificial intelligence, but it stands to deliver substantive benefits. The financial markets generally view spinoffs and splits positively because they create pure-play entities that allow investors to make more targeted investments. Each new company can then focus on its core business, optimize its capital allocation, and pursue growth opportunities without the overarching complexities of a diversified parent company.
The strategic rationale for this move can be multifaceted. By segmenting its diverse operations, DuPont aims to unlock hidden value that may be overshadowed within a larger conglomerate structure. Separate companies might enjoy greater operational flexibility and be able to pursue more aggressive or specialized growth strategies than they could as part of a larger entity. For example, one of the spinoff entities may choose to focus on innovation and research in materials science, while another might prioritize agricultural products or industrial solutions. Tailoring each companys business model to its specific market could lead to improved operational efficiencies and enhanced competitiveness.
In the context of market performance, this restructuring should not be underestimated. Financial advisors and investment firms might recommend holding or even increasing positions in DuPont given the potential for value realization in the medium to long term. While it might not capture headlines with the same urgency as explosive tech company growth, strategic corporate splits like this have a proven track record of delivering shareholder value.
DuPont de Nemours, Inc. has undertaken significant restructuring measures that have transformed its business landscape. This movement is part of a broader trend observed within the industrial sector, where large conglomerates opt to divide their diversified portfolios into more focused, stand-alone entities. This strategy aims to provide clearer value propositions to investors who increasingly favor simplified, single-industry investment opportunities.
One of the most noteworthy developments in DuPonts recent history occurred when the company announced its plan to split into three distinct standalone businesses. This move followed the trend seen with other industrial giants like General Electric, which spun off GE Vernova, and United Technologies Corporation, which divided into Carrier and Raytheon. DuPonts split aligns with the ongoing market preference for pure-play companies, which investors perceive as more straightforward and potentially more rewarding compared to complex conglomerates.
The restructuring is set to create a new company focusing on electrification, which will supply critical materials like electronic and thermal components, advanced packaging solutions, and clean rooms. This spin-off is particularly noteworthy because Nvidia, a major player in the technology sector, is anticipated to be one of its significant customers. Therefore, the new company stands to gain from the robust demand in the semiconductor industry, as evidenced by the thriving business of Nvidia.
DuPont's restructuring decision is also partially driven by underperformance relative to its peers, which has been partly attributed to liabilities associated with PFOS chemicals and a perceived undervaluation by investors. Analysts have suggested that DuPont's diverse assets did not synergize effectively within a single conglomerate, but the same assets could present valuable opportunities when managed independently. The transaction's finalization is expected within 18 to 24 months, aiming to unlock the potential value within its business units.
Further highlighting this trend, DuPonts water filtration business is poised to compete with Zilom, a company that has already experienced a 25% rise in shares within the year. The water filtration segment will follow a pure-play water strategy, thus aligning with investor preferences for specialized and focused businesses.
For additional insights and details, Seema Moody's reporting on DuPont's actions can be explored further through this YouTube link.
DuPont de Nemours, Inc. stands out as a significant entity in the global specialty chemicals industry. The company emerged from the DowDuPont merger in 2019, which later underwent several strategic separations to refine its expansive portfolio. As highlighted in a detailed analyst report published on May 24, 2024, by Morningstar Research, DuPonts business now encompasses a broad array of specialty chemicals and downstream products. These products serve crucial sectors such as electronics, water management, construction, safety and protection, automotive, and healthcare (source: Morningstar - Yahoo Finance).
Currently, DuPonts strategy includes a significant restructuring aimed at creating three distinct companies by focusing on their core markets. One entity will be dedicated to electronics, another to water, and the third will cater to diverse end markets. This planned division is anticipated to be completed by mid-2026. The goal behind this move is to strengthen each unit's focus and operational efficiency, thereby enhancing value creation for shareholders and better serving industry demands.
DuPont's varied portfolio is a hallmark of its ability to innovate and adapt within different industrial realms. For instance, its contributions to the electronics industry encompass specialized materials required for the manufacturing of semiconductors and electronics components. In the water sector, DuPont provides essential solutions for desalination and water purification, showcasing its commitment to sustainability and addressing global water scarcity issues. The company's advancements in the automotive sector include high-performance materials designed to improve vehicle safety and efficiency.
Understanding DuPonts strategy necessitates an appreciation of its historical shifts and its forward-looking restructuring plans. This approach not only signifies a response to changing market dynamics but also demonstrates DuPonts endeavor to leverage its technological expertise and broad-based industry presence. Through sustaining innovation and strategic realignments, DuPont is poised to maintain its competitive edge and contribute meaningfully to the industries it serves.
DuPont de Nemours, Inc. (DD) has shown a certain level of volatility from May 28, 2019, to May 24, 2024, with its asset returns being influenced by specific factors. The ARCH model indicates that the variance of returns is influenced by past errors, and there's statistical significance in the model components. Moreover, the log-likelihood and AIC/BIC values suggest the model's fit to the data.
| Statistic Name | Statistic Value |
|---|---|
| R-squared | 0.000 |
| Adjusted R-squared | 0.001 |
| Log-Likelihood | -2,728.48 |
| AIC | 5,460.96 |
| BIC | 5,471.23 |
| No. Observations | 1,258 |
| Df Residuals | 1,258 |
| Df Model | 0 |
| omega | 3.4696 |
| omega std err | 0.395 |
| omega t | 8.776 |
| omega P>|t| | 1.693e-18 |
| omega 95.0% Conf. Int. | [2.695, 4.245] |
| alpha[1] | 0.3333 |
| alpha[1] std err | 0.102 |
| alpha[1] t | 3.271 |
| alpha[1] P>|t| | 1.073e-03 |
| alpha[1] 95.0% Conf. Int. | [0.134, 0.533] |
To evaluate the financial risk associated with a $10,000 investment in DuPont de Nemours, Inc. over a one-year period, we employ a blend of volatility modeling and machine learning predictions. This approach allows for a more nuanced understanding of the stock's behavior and future performance.
Volatility modeling is instrumental in capturing the day-to-day fluctuations of DuPont's stock price. By examining past return data, this model estimates time-varying volatility, providing insight into the stock's risk profile. Such models are particularly adept at identifying periods of heightened volatility, which are critical for risk assessment.
On the other hand, machine learning predictions enhance the accuracy of forecasting future returns by identifying complex patterns in historical data that traditional models might overlook. Specifically, using ensemble techniques such as tree-based algorithms, we can create robust predictive models that consider a multitude of market factors.
When integrating the outputs of these two methods, we obtain a comprehensive risk assessment. The volatility model provides a volatility estimate, which is crucial for determining downside risk, while machine learning predictions offer a forward-looking view of return distribution.
This combined approach allows us to calculate the Value at Risk (VaR) for the investment. At a 95% confidence interval, the VaR measures the maximum expected loss over one year, under normal market conditions. For a $10,000 investment in DuPont de Nemours, Inc., the annual VaR is calculated to be $270.34. This figure indicates that there is a 5% probability that the investment could lose more than $270.34 over the course of one year due to market volatility.
Ultimately, the integration of volatility modeling and machine learning predictions provides a robust framework for assessing and managing financial risk in equity investments. By leveraging advanced techniques, we can achieve a nuanced understanding of both historical volatility and future return potential.
Long Call Option Strategy
When analyzing the options chain for DuPont de Nemours, Inc. (DD), focusing on long call options reveals several interesting possibilities based on varying expiration dates and strike prices. The most profitable options are identified by evaluating key "Greeks" and their implied risk-reward scenarios. Importantly, the target stock price is set 2% above the current price, which will guide the assessment of potential profit and loss scenarios.
Short-term Choice: Expiring on 2024-05-31 with a Strike Price of $75.00
This near-term option has a delta of 0.76, indicating it will gain approximately $0.76 for every $1.00 increase in stock price. The gamma of 0.0319 shows relatively low variability in delta, and the vega of 3.226 reflects significant sensitivity to volatility changes. The theta is -0.2555, meaning the option will lose value at a moderate rate as time passes, and the rho of 0.0089 indicates a low sensitivity to interest rate changes. With a premium of $1.55 and an ROI of 3.942, this option stands out for its high short-term profit potential. The potential profit is $6.1108, but the risk remains high as time decay (theta) erodes value quickly.
Mid-term Choice: Expiring on 2024-06-21 with a Strike Price of $57.50
This mid-term option offers superb profitability for conservative traders. It boasts a high delta of 0.9985, ensuring nearly one-to-one movement with the stock price. Since gamma is 0.0, there is no change in delta with respect to the stock price. With vega at 0.0, the sensitivity to volatility is nonexistent, and a theta of -0.0027 implies minimal time decay. However, rho of 0.0424 indicates a moderate sensitivity to interest rate changes. Given a premium of $10.0 and an ROI of 1.51608, this choice provides a balanced approach between risk and reward, with a substantial profit of $15.1608.
Long-term Choice: Expiring on 2025-01-17 with a Strike Price of $37.50
This long-term option offers an excellent ROI of 1.25804, with a significant potential profit of $25.1608. It has a delta of 0.9875, ensuring close tracking with movements in the underlying stock price. The gamma is 0.0, vega is 0.0, and theta is minimal at -0.0002, indicating low risk from time decay and volatility changes. Rho at 0.2365 showcases sensitivity to interest rate changes but is manageable over a longer timeframe. This option is attractive due to its high delta and low sensitivity to other Greeks, providing robustness against market fluctuations.
Extended Long-term Choice: Expiring on 2026-01-16 with a Strike Price of $45.00
For investors interested in a very long-term horizon, this option with a delta of 0.9687 provides strong leverage. Its gamma and vega are both zero, which reduces risks from changing stock price and volatility, respectively. The theta of -0.0009 indicates minimal time decay, and a rho of 0.6884 highlights moderate sensitivity to interest rate changes. With a premium of $31.05 and a potential profit of $6.6108, this option offers a balanced but slightly conservative approach, ideal for risk-averse investors.
Intermediate Choice: Expiring on 2025-06-20 with a Strike Price of $55.00
This intermediate-term option, expiring in mid-2025, presents a solid delta of 0.9795. The gamma, vega, and theta are all zero or minimal, reducing extraneous risks from stock price changes and time decay. With a rho of 0.5616, the option is moderately sensitive to interest rates. A premium of $13.20 ensures a potential profit of $14.4608 and an impressive ROI of 1.0955, making it a noteworthy intermediate option for balanced investors.
In conclusion, these five options represent a diverse range of risk-reward profiles across different time horizons. Whether one is seeking rapid gains with a short-term option or prefers the stability and potential steady gains of a long-term investment, these choices offer viable opportunities for various investment strategies. Each option's specific Greeks analysis underlines their respective volatility and time decay sensitivities, aiding in making an informed decision that aligns with the investor's risk appetite and market outlook.
Short Call Option Strategy
When analyzing short call options on DuPont de Nemours, Inc. (DD) with an interest in mitigating risk and maximizing profit, there are several factors and specific Greeks values to take into account. Delta, gamma, vega, theta, and rho are crucial inputs in assessing the performance and potential risk involved in these options.
Due to our focus on minimizing the risk of having shares assigned, noting the delta value for each option is critical. Delta indicates the probability that the option will end up in the money; the higher the delta, the more likely the option will be exercised if the price approaches the strike price. A lower delta is preferable for minimizing assignment risk. We also need to consider the expiration date, as longer-term options have different risk/reward profiles compared to near-term options.
Taking into account these metrics, here are five promising options, selected based on their expiration date and strike price, while balancing risk and reward:
- DD Short Call with Strike Price 86.0, Expiring on 2024-05-31:
- Delta: 0.2262
- Premium: $0.1
- Days to Expiry: 6
- Profit: $0.1
- ROI: 100%
The low delta of 0.2262 minimizes the risk of assignment, making this near-term option ideal for conservative investors who aim for high profitability with limited capital commitment. While the premium is low, the ROI is extraordinary at 100%.
- DD Short Call with Strike Price 84.0, Expiring on 2024-06-07:
- Delta: 0.1343
- Premium: $0.15
- Days to Expiry: 13
- Profit: $0.15
- ROI: 100%
This option showcases a low delta of 0.1343, reducing the probability of assignment significantly. With slightly more premium than the previous option and the same ROI, this is a good short to medium-term trade with minimized assignment risk.
- DD Short Call with Strike Price 85.0, Expiring on 2024-06-14:
- Delta: 0.1208
- Premium: $0.2
- Days to Expiry: 20
- Profit: $0.2
- ROI: 100%
An even lower delta of 0.1208 in this short-term option presents an attractive risk profile. The premium is higher compared to options with closer expiration dates, making it beneficial for investors looking for a balance between risk and reward over a slightly extended period.
- DD Short Call with Strike Price 87.5, Expiring on 2024-09-20:
- Delta: 0.2943
- Premium: $1.42
- Days to Expiry: 118
- Profit: $1.42
- ROI: 100%
This medium-term option has a lower delta of 0.2943, thereby maintaining a reasonable risk of assignment. The premium is substantially higher, reflecting the higher potential profit, and the duration until expiration allows for more diverse strategies including potential adjustments.
- DD Short Call with Strike Price 77.5, Expiring on 2025-01-17:
- Delta: 0.6435
- Premium: $8.6
- Days to Expiry: 237
- Profit: $6.69 (accounting for ROI)
- ROI: 77.74%
For those with a more risk-appetite, this longer-term option offers a higher delta of 0.6435. Although the risk of assignment increases, the premium compensates substantially, providing a significant return. This option benefits from the span of multiple months, allowing for tactical adjustments to hedge or modify the position as required.
Each of these options has been selected to align with a strategy focused on premium income with minimized risk of assignment. While the short-term options primarily focus on high ROI with lower deltas, the long-term options offer higher premiums, accommodating investors with a higher risk tolerance, and capacity for active strategy management over an extended period.
Long Put Option Strategy
Due to the absence of specific data in the table, I'll provide a generalized analytical framework that you can apply to any long put options for DuPont de Nemours, Inc. (DD). I'll hypothetically summarize the kind of insights and analysis you should look for when the data becomes available.
Analysis Framework and Insights
When considering long put options, the primary focus is on obtaining a balance between risk and reward. The GreeksDelta, Gamma, Theta, Vega, and Rhoplay a crucial role in this determination. For this analysis, we've set our target stock price at 2% above the current stock price for evaluating profit potential.
1. Near-Term Option
Expiration Date: [Near-Term Date] Strike Price: [Strike Price Close to Current Price]
Near-term options are generally more sensitive to time decay (Theta), yet they offer the potential for quick profit if the stock price declines as expected. A high absolute value of Delta indicates a stronger sensitivity to price movements, which is beneficial in the short term.
- Risk: High time decay (Theta) means the option will lose value quickly if the stock does not move as expected.
- Reward: A high Delta near the money increases the profitability if the stock price nears the strike price.
- Greeks Insight: Seek options with a high negative Delta and lower Theta to balance short-term speculation with time decay risk.
2. Mid-Term Option
Expiration Date: [Mid-Term Date] Strike Price: [Slightly Out-of-the-Money]
Mid-term options offer a balance between rapid time decay and prolonged exposure. They are generally less volatile than near-term but more so than long-term options. Gamma can indicate the rate at which Delta changes, important for managing expectations.
- Risk: Moderate time decay and potential for price reversal over a slightly longer horizon.
- Reward: Gamma sensitivity helps in quick Delta adjustments, making mid-term options appealing as stock price approaches the target.
- Greeks Insight: Focus on moderate Gamma and Delta that adjust quickly within a reasonable timeframe without substantial Theta erosion.
3. Near-Term Option (Further OTM)
Expiration Date: [Near-Term Date] Strike Price: [Further Out-of-the-Money]
For investors anticipating a significant move in the stock price within a short duration, further out-of-the-money (OTM) options can offer high-risk, high-reward scenarios.
- Risk: High sensitivity to both stock price movement and accelerated time decay. Probability of expiring worthless is high if the move doesn't occur.
- Reward: Significant profit potential if the stock price moves strongly in the anticipated direction.
- Greeks Insight: High Vega sensitivity to volatility changes. Selection should include anticipating a volatility rise.
4. Long-Term Option
Expiration Date: [Long-Term Date] Strike Price: [At the Money or Slightly ITM]
Long-term options (LEAPs) provide extensive time horizons to work with, making them less sensitive to time decay and more influenced by macroscale market expectations.
- Risk: Lower annualized return compared to short-term, but mitigated risk through lesser time decay.
- Reward: Stability in expected downward movement and less impact from Theta decay, allowing for strategic adjustments over time.
- Greeks Insight: Examine lower Theta and high Delta stability. Lower Rho impact may be noted unless influenced by interest rate expectations.
5. Mid-Term Option (Deep in the Money)
Expiration Date: [Mid-Term Date] Strike Price: [Deeply In the Money]
Deep ITM options have higher intrinsic value and strong negative Delta, translating stock movement directly into option value. Mid-term horizons mitigate some time decay risk while capturing significant stock price movement.
- Risk: Significant initial investment and capped profit potential relative to premium paid.
- Reward: Large percentage movements result in stable returns with decreased volatility sensitivity.
- Greeks Insight: High Delta and low Theta importance. Lower Gamma due to substantial intrinsic value, making Vega less impactful.
Summary
The choice of the option depends on your market outlook, risk tolerance, and investment strategy. Whether short-term speculation with high potential profitability and risk or long-term stability with minimized decay, selecting an appropriate option will involve a careful review of the Greeks relative to the investment horizon and stock price expectations. Applying these principles to actual data will empower you to extract the maximum potential from your trades in DuPont de Nemours, Inc. (DD) long put options.
Short Put Option Strategy
Analysis of DuPont de Nemours, Inc. (DD) Short Put Options
When shorting put options for DuPont de Nemours, Inc. (DD), the primary objectives are to maximize profit while minimizing the risk of having the underlying shares assigned. This requires careful consideration of the Greeks, particularly delta, to quantify the probability of the option ending in the money. The strike prices are evaluated in context with the current stock price to gauge profitability and risk.
Near-Term Option: Expiration Date - 2024-05-31, Strike Price - 79.0
- Greeks: Delta: -0.1515, Gamma: 0.1137, Vega: 2.4388, Theta: -0.0395, Rho: -0.0020
- Premium: $0.20
- ROI: 100%
- Profit: $0.20
This option offers a high return due to its low premium. The delta, at -0.1515, suggests a moderate chance (approximately 15%) of assignment risk. Given the short six days to expiration, the risk and reward balance well, making this a relatively safe high-return option, particularly in a stable market.
Mid-Term Option: Expiration Date - 2024-06-14, Strike Price - 75.0
- Greeks: Delta: -0.0615, Gamma: 0.0288, Vega: 2.3023, Theta: -0.0124, Rho: -0.0028
- Premium: $1.00
- ROI: 100%
- Profit: $1.00
This option strikes a balance between profitability and risk, offering a significant premium with a delta of -0.0615, indicating low risk (approximately 6%) of assignment. The higher premium provides a more substantial buffer against potential stock price declines, thereby balancing risk with a notable profit opportunity.
Longer-Term Option: Expiration Date - 2024-09-20, Strike Price - 77.5
- Greeks: Delta: -0.2979, Gamma: 0.0378, Vega: 15.9154, Theta: -0.0115, Rho: -0.0840
- Premium: $2.15
- ROI: 100%
- Profit: $2.15
This longer-term option offers a substantial premium and moderate delta value of -0.2979, indicating a 30% chance of assignment. Given the substantial premium and longer timeframe, this option is lucrative if your view of the stock remaining stable or bullish is confident. The relatively high vega suggests it is sensitive to volatility changes, but the premium provides a cushion for market fluctuations.
Long-Term Option: Expiration Date - 2025-06-20, Strike Price - 75.0
- Greeks: Delta: -0.2856, Gamma: 0.0169, Vega: 28.1949, Theta: -0.0064, Rho: -0.292
- Premium: $4.90
- ROI: 100%
- Profit: $4.90
This option offers an attractive premium and a moderate delta (approx. 29% chance of assignment). The high premium suggests significant profit potential over a long duration, albeit with moderate risk due to a higher delta value. As with the mid-term option, the substantial premium and lower theta mitigate the risk of volatility and slower value decay, making it a strong candidate for long-term positions.
Extended Duration Option: Expiration Date - 2026-01-16, Strike Price - 72.5
- Greeks: Delta: -0.2652, Gamma: 0.0109, Vega: 33.5400, Theta: -0.0057, Rho: -0.4514
- Premium: $6.00
- ROI: 100%
- Profit: $6.00
This extended duration option sits between long term and very long term, offering substantial profit and a similar risk profile. With a delta of -0.2652, it indicates a slightly higher than moderate (approx. 26%) risk of assignment. High vega and robust premium make it suitable for investors willing to capitalize on anticipated stability or bullish trends over a longer horizon.
Conclusion
The following five short put options for DuPont de Nemours, Inc. (DD) are considered the most profitable based on their potential returns, associated risks, and the distribution of expiration dates and strike prices: 1. Expiration Date 2024-05-31, Strike Price 79.0 2. Expiration Date 2024-06-14, Strike Price 75.0 3. Expiration Date 2024-09-20, Strike Price 77.5 4. Expiration Date 2025-06-20, Strike Price 75.0 5. Expiration Date 2026-01-16, Strike Price 72.5
Each offers a balance of high ROI, moderate delta indicating assignment risk, and attractive premiums, making them aligned with the dual objectives of maximizing profit and minimizing risk.
Vertical Bear Put Spread Option Strategy
For an optimal vertical bear put spread strategy, we need to analyze both the risk and reward meticulously. Given that the objective is to minimize the risk of having shares assigned and that the target stock price is within 2% of the current price, let's investigate the most profitable combinations of short and long put options.
Key Greeks to Consider:
- Delta - Measures the sensitivity of the option's price to changes in the underlying asset's price. Lower values for the short leg reduce the risk of assignment.
- Gamma - Reflects the rate of change of delta and essentially provides stability analysis of delta.
- Vega - Indicates sensitivity to volatility. Higher values suggest more premium but also more volatility risk.
- Theta - Represents time decay. Higher negative values mean faster loss in the option's extrinsic value.
- Rho - Sensitivity to interest rate changes. Slightly less critical but still of note in overall profit expectations.
Risk/Reward Quantification:
We'll focus on several expiration dates, ranging near to long-term, for balanced strategy options.
Near-Term Strategy (Expiring 2024-06-07):
Short Put:
- 2024-06-07, Strike Price $80.0 (Premium: $0.61, Delta: -0.338)
- Profit: $0.0292 (ROI: 4.79%)
Long Put:
- Matching Put Data: N/A
Mid-Term Strategy (Expiring 2024-07-19):
Short Put:
- 2024-07-19, Strike Price $80.0 (Premium: $1.55, Delta: -0.384)
- Profit: $0.9692 (ROI: 62.53%)
Long Put: - Matching Put Data: N/A
Slightly Longer-Term Strategy (Expiring 2024-09-20):
Short Put:
- 2024-09-20, Strike Price $80.0 (Premium: $2.9, Delta: -0.398)
- Profit: $2.3192 (ROI: 79.97%)
Long Put: - Matching Put Data: N/A
Longer-Term Strategy (Expiring 2024-11-15):
Short Put:
- 2024-11-15, Strike Price $80.0 (Premium: $4.01, Delta: -0.396)
- Profit: $3.4292 (ROI: 85.52%)
Long Put: - Matching Put Data: N/A
Very Long-Term Strategy (Expiring 2026-01-16):
Short Put:
- 2026-01-16, Strike Price $80.0 (Premium: $8.0, Delta: -0.355)
- Profit: $7.4192 (ROI: 92.74%)
Long Put: - Matching Put Data: N/A
Scenario Analysis:
- May 2024 Expiry:
- Short Put at strike price $75.0 achieves lower delta and closer to current price levels, but a minimized profit ($0.05).
-
Expect assignments with higher risk in portfolios but minimal profit due to lower premiums.
-
June 2024 Expiry:
- Mid-term options like strike price $76.0 provide better risk reward (higher premium of $0.25, delta: -0.049).
-
Minimal assignment risk, advantageous leverage with slightly higher risk.
-
July 2024 Expiry:
- Short Put at strike price $80.0 with a significant premium and controlled delta provides a balanced approach.
-
Higher premium returns with moderately controlled assignment risk.
-
September 2024 Expiry:
- Strike price $80.0 manageable delta, reasonably intact Theta, and standardized Vega helps maintain the ROI balancing risks.
-
Matches the premium value-proposition.
-
November 2024 Expiry:
- More extended coverage, better equilibrium on risk mechanisms. Strike $80.0 providing maximum delta containment ensures against sharp market assignment risk with premium high returns.
Conclusion:
Based on minimizing risk along with optimal and controlled leverage incentives, the strategy of selecting short puts with robust delta and well-measured thetas emerges as an optimal approach. Higher premium associations balance risk-benefit ratios, making the selected put spreads on expiries up until November 2024 viable for vertical bear put spread strategies under profitability and risk perspectives. Due to the absence of exact long put options, hypothetical construction centered on strike alignment with profit substantiality dictates preferable selections.
In summary, balancing the vertical bear put strategies with optimizing profits and minimizing assignment risks positions multiple expiries as strategic, albeit with a careful eye on market movements and respective intrinsic-extrinsic influences.
Vertical Bull Put Spread Option Strategy
Analyzing the vertical bull put spread strategy for DuPont de Nemours, Inc. (DD), we aim to find the most optimal options to maximize profit while minimizing the risk of shares being assigned. Considering that our target stock price is within 2% over or under the current stock price, the chosen options will correspond to this target range. Furthermore, the analysis is based on various expiration dates and strike prices, ensuring we cover near-term through long-term options.
Near-Term Strategy (2024-05-31)
For a near-term expiration date, the bull put spread involving the following strikes could be profitable: - Sell the $79 Put Option (2024-05-31): - Delta: -0.1515 - Premium: $0.2 - Profit: $0.2 (premium received) - Potential assigned risk: High due to proximity to the target price, but manageable with a strategy to exit early if within 2% range close to expiration. - Buy the $76 Put Option (2024-05-31): - Delta: -0.0694 - Premium: $0.05 - Loss: $0.05 - Net Premium: $0.15
Risk/Reward Analysis: - Maximum Profit: $0.15 per share if the stock price stays above $79 upon expiration. - Maximum Loss: $2.85 per share (difference in strike prices minus net premium received). - Risk Management: Consider exiting the position early if within the 2% range near expiration to avoid assignment.
Mid-Term Strategy (2024-06-14)
For a mid-term strategy, consider the following spread: - Sell the $79 Put Option (2024-06-14): - Delta: -0.2593 - Premium: $1.45 - Profit: $1.45 - Buy the $75 Put Option (2024-06-14): - Delta: -0.0615 - Premium: $1.0 - Loss: $1.0 - Net Premium: $0.45
Risk/Reward Analysis: - Maximum Profit: $0.45 per share if the stock price stays above $79. - Maximum Loss: $3.55 per share (difference in strike prices minus net premium received). - Risk Management: The higher delta of the sold put indicates some assignment risk, make sure to monitor the price movements closely.
Long-Term Strategy (2024-09-20)
For a longer-term perspective: - Sell the $77.5 Put Option (2024-09-20): - Delta: -0.2979 - Premium: $2.15 - Profit: $2.15 - Buy the $ 72.5 Put Option (2024-09-20): - Delta: -0.1403 - Premium: $1.0 - Loss: $1.0 - Net Premium: $1.15
Risk/Reward Analysis: - Maximum Profit: $1.15 per share if the stock price stays above $77.5. - Maximum Loss: $4.35 per share (difference in strike prices minus net premium received). - Risk Management: A decent balance between potential profit and limited downside. Given the longer time frame, the risk of assignment should be closely monitored and adjustments made accordingly.
Very Long-Term Strategy (2025-01-17)
For a strategy extending into early 2025: - Sell the $77.5 Put Option (2025-01-17): - Delta: -0.3259 - Premium: $4.5 - Profit: $4.5 - Buy the $72.5 Put Option (2025-01-17): - Delta: -0.1276 - Premium: $1.36 - Loss: $1.36 - Net Premium: $3.14
Risk/Reward Analysis: - Maximum Profit: $3.14 per share if the stock price stays above $77.5. - Maximum Loss: $1.86 per share (difference in strike prices minus net premium received). - Risk Management: Given the extended period, closely monitor the transition of options to avoid assignment risk.
Extended-Term Strategy (2026-01-16)
The furthest strategy looks at: - Sell the $77.5 Put Option (2026-01-16): - Delta: -0.3153 - Premium: $6.62 - Profit: $6.62 - Buy the $72.5 Put Option (2026-01-16): - Delta: -0.2652 - Premium: $4.7 - Loss: $4.7 - Net Premium: $1.92
Risk/Reward Analysis: - Maximum Profit: $1.92 per share if the stock price stays above $77.5. - Maximum Loss: $3.08 per share (difference in strike prices minus net premium received). - Risk Management: An extended time frame increases exposure, however, a substantial buffer provided by net premium limits downside effectively.
Conclusion
Each strategy offers different balances of risk and reward. The extended-term strategies (long-term and very long-term) provide higher premiums with corresponding increased exposure periods. Near-term options pose a higher immediate assignment risk but can be managed with tight monitoring and adjusting. The mid-term options balance these aspects, offering notable premiums with moderate assignment risks. Always consider volatility (vega), time decay (theta), and potential market shifts when fine-tuning the strategies.
Vertical Bear Call Spread Option Strategy
Introduction to a Bear Call Spread Strategy for DuPont de Nemours, Inc. (DD)
A vertical bear call spread is an options strategy used when an investor anticipates a moderate decline in the price of the underlying asset. The strategy involves selling a call option at a lower strike price and buying another call option at a higher strike price, both with the same expiration date. The primary benefit of this strategy is the collection of premium from the sold call, which offsets part of the premium paid for the purchased call, thus limiting both the risk and the profit potential.
Analysis of the Greeks and Strategy Selection
To select the most profitable vertical bear call spread options strategy while minimizing the risk of having shares assigned, we need to take a closer look at the Greeks for the relevant options. Focusing on the near-term to long-term horizons, here's an analysis of five strategies that stand out, considering various expiration dates and strike prices.
Near-Term Options (Expiring on 2024-06-07)
- Sell 82.5 Call, Buy 84 Call (Expiring on 2024-06-07, Near-term)
- Sell Call Options:
- Strike: 82.5, Delta: 0.3579762522, Theta: -0.0253369496, Premium: $0.75
- Buy Call Options:
- Strike: 84, Delta: 0.1343252003, Theta: -0.0217991384, Premium: $0.15
Analysis: This strategy involves selling a higher delta (82.5) call option with a relatively higher premium and buying a lower delta (84) call option. The net premium received is $0.60 ($0.75 - $0.15), which provides a good balancing act between risk and reward. The relatively low delta reduces the likelihood of having the shares assigned.
- Sell 80 Call, Buy 81 Call (Expiring on 2024-06-07, Near-term)
- Sell Call Options:
- Strike: 80, Delta: 0.7066922497, Theta: -0.0314812765, Premium: $1.25
- Buy Call Options:
- Strike: 81, Delta: 0.5256135333, Theta: -0.0344472743, Premium: $0.70
Analysis: This strategy involves selling a higher delta (80) call and buying a lower delta (81) call. The net premium received is $0.55 ($1.25 - $0.70), which provides a higher initial income, but carries a higher risk of having shares assigned due to the higher delta values.
Medium-Term Options (Expiring on 2024-09-20)
- Sell 77.5 Call, Buy 80 Call (Expiring on 2024-09-20, Medium-term)
- Sell Call Options:
- Strike: 77.5, Delta: 0.67831519, Theta: -0.0186757944, Premium: $6.10
- Buy Call Options:
- Strike: 80, Delta: 0.5884868585, Theta: -0.0189588004, Premium: $4.40
Analysis: This medium-term strategy involves selling the 77.5 call option and buying the 80 call option. The net premium received is $1.70 ($6.10 - $4.40). The high net premium offers a significant potential profit, balanced against the moderate risk of having the shares assigned.
Long-Term Options (Expiring on 2025-01-17 and Beyond)
- Sell 80 Call, Buy 85 Call (Expiring on 2025-01-17, Long-term)
- Sell Call Options:
- Strike: 80, Delta: 0.5890069262, Theta: -0.016299906, Premium: $7.20
- Buy Call Options:
- Strike: 85, Delta: 0.4724102908, Theta: -0.0155762395, Premium: $4.76
Analysis: For the long-term, this strategy involves selling the 80 call and buying the 85 call. The net premium received is $2.44 ($7.20 - $4.76). This setup provides an attractive premium with a lower delta, reducing the risk of assignment while maintaining a solid profit potential over the longer period.
- Sell 75 Call, Buy 80 Call (Expiring on 2025-06-20, Long-term)
- Sell Call Options:
- Strike: 75, Delta: 0.6666069685, Theta: -0.0117917564, Premium: $15.60
- Buy Call Options:
- Strike: 80, Delta: 0.610888784, Theta: -0.0110779035, Premium: $12.88
Analysis: This long-term strategy involves selling the 75 call and buying the 80 call. The net premium here is $2.72 ($15.60 - $12.88). Although the delta values are higher, the substantial premium collected offers a good reward relative to the risk, making this a robust choice for a long-term bear call spread strategy.
Conclusion
Given the analysis of the Greeks and the resulting risk and reward profiles, the five bear call spread strategies outlined above permit a balanced approach to maximizing profit while managing the risk of share assignment. Investors should select the strategy that best aligns with their risk tolerance and investment horizon. Near-term options provide quick returns but with higher assignment risk, while medium to long-term options offer more stability at the cost of a longer time horizon.
Vertical Bull Call Spread Option Strategy
Most Profitable Vertical Bull Call Spread Options Strategy for DuPont de Nemours, Inc. (DD)
In examining the provided options chains and accompanying Greek values, the goal is to identify the most profitable vertical bull call spread strategy that also minimizes the risk of having shares assigned. For this strategy, we will buy a lower strike call and simultaneously sell a higher strike call with the same expiration.
1. Near-term Vertical Bull Call Spread (Expiring 2024-05-31)
For a near-term strategy, consider buying the call option with a strike price of $80.00 and selling the call option with a strike price of $76.00. Both options have an expiration date of 2024-05-31.
- Buy $80.00 Call:
- Delta: 0.8047624023
-
Premium: $1.2
-
Sell $76.00 Call:
- Delta: 0.7686349729
- Premium: $3.35
Net Premium Received: = Premium Collected - Premium Paid = $3.35 - $1.2 = $2.15
Potential Profit and Loss Scenarios: - Max Profit: If DD reaches or exceeds $80.00, profit can be calculated as follows: - Max Profit = (Difference in Strike Prices - Net Premium) - Max Profit = ($80 - $76) - $2.15 - Max Profit = $1.85 per contract - Max Loss: If DD stays below $76.00, the loss will be: - Max Loss = Net Premium Received - Max Loss = $2.15 per contract
2. Short-term Vertical Bull Call Spread (Expiring 2024-06-07)
For a short-term strategy, buying the call option with a strike price of $77.50 and selling the call option with a strike price of $80.00, both expiring on 2024-06-07, provides an attractive balance.
- Buy $77.50 Call:
- Delta: 0.8731574412
-
Premium: $3.7
-
Sell $80.00 Call:
- Delta: 0.7091200382
- Premium: $1.25
Net Premium Paid: = Premium Paid - Premium Collected = $3.7 - $1.25 = $2.45
Potential Profit and Loss Scenarios: - Max Profit: If DD reaches or exceeds $80.00: - Max Profit = ($80 - $77.5) - $2.45 - Max Profit = $0.05 per contract - Max Loss: If DD stays below $77.50: - Max Loss = Net Premium Paid - Max Loss = $2.45 per contract
3. Medium-term Vertical Bull Call Spread (Expiring 2024-06-21)
For a medium-term strategy, consider buying the call option with a strike price of $75.00 and selling the call option with a strike price of $77.50, both expiring on 2024-06-21.
- Buy $75.00 Call:
- Delta: 0.9667463187
-
Premium: $5.8
-
Sell $77.50 Call:
- Delta: 0.8731574412
- Premium: $3.7
Net Premium Paid: = Premium Paid - Premium Collected = $5.8 - $3.7 = $2.1
Potential Profit and Loss Scenarios: - Max Profit: If DD reaches or exceeds $77.50: - Max Profit = ($77.5 - $75) - $2.1 - Max Profit = $0.4 per contract - Max Loss: If DD stays below $75.00: - Max Loss = Net Premium Paid - Max Loss = $2.1 per contract
4. Long-term Vertical Bull Call Spread (Expiring 2025-01-17)
For a longer-term strategy, consider buying the call option with a strike price of $70.00 and selling the call option with a strike price of $77.50, both expiring on 2025-01-17.
- Buy $70.00 Call:
- Delta: 0.7765478323
-
Premium: $12.4
-
Sell $77.50 Call:
- Delta: 0.6434864285
- Premium: $8.6
Net Premium Paid: = Premium Paid - Premium Collected = $12.4 - $8.6 = $3.8
Potential Profit and Loss Scenarios: - Max Profit: If DD reaches or exceeds $77.50: - Max Profit = ($77.5 - $70) - $3.8 - Max Profit = $3.7 per contract - Max Loss: If DD stays below $70.00: - Max Loss = Net Premium Paid - Max Loss = $3.8 per contract
5. Extended-term Vertical Bull Call Spread (Expiring 2026-01-16)
For the extended term, buying the call option with a strike price of $75.00 and selling the call option with a strike price of $80.00, both expiring on 2026-01-16, is advantageous.
- Buy $75.00 Call:
- Delta: 0.6666069685
-
Premium: $15.6
-
Sell $80.00 Call:
- Delta: 0.610888784
- Premium: $12.88
Net Premium Paid: = Premium Paid - Premium Collected = $15.6 - $12.88 = $2.72
Potential Profit and Loss Scenarios: - Max Profit: If DD reaches or exceeds $80.00: - Max Profit = ($80 - $75) - $2.72 - Max Profit = $2.28 per contract - Max Loss: If DD stays below $75.00: - Max Loss = Net Premium Paid - Max Loss = $2.72 per contract
Conclusion
The vertical bull call spread strategy involving different expiration dates and strike prices presents various risk-reward profiles. By selecting spreads with lower delta values for the short strikes, one can minimize the risk of having shares assigned. Among the presented strategies, the near-term (2024-05-31) and short-term (2024-06-07) positions offer quick gains with manageable risk, while the extended-term (2026-01-16) spread offers larger profits for a slightly higher premium, though assignment risk increases. Each strategy aligns differently with investment horizons and risk tolerance, providing a substantive framework for achieving profit while understanding the inherent risks.
Spread Option Strategy
Implementing a calendar spread options strategy for DuPont de Nemours, Inc. (DD) involves buying and selling options with the same strike price but different expiration dates. For this analysis, we consider scenarios where we buy a call option (long position) and sell a put option (short position). The goal is to minimize the risk of having shares assigned to us, which is a concern when shorting in-the-money options, while maximizing profitability based on the Greeks and various time horizons.
Choice 1: Near-Term Options
- Buy Call Option: Strike 75.0, Expiration 2024-05-31
- Delta: 0.7602
- Premium: $1.55
- Profit: $6.1108
- ROI: 3.9425
-
Theta: -0.2555
-
Sell Put Option: Strike 76.0, Expiration 2024-05-31
- Delta: -0.0694
- Premium: $0.05
- Profit: $0.05
- ROI: 100.0
- Theta: -0.0395
Analysis: For near-term options, choosing a 75.0 strike call offers a high ROI and a substantial profit potential. The 76.0 strike put option provides a small premium but ensures a 100% ROI. The delta values suggest a limited risk of assignment for the put option, while the high delta of the call indicates higher profitability if the stock price moves favorably.
Choice 2: Short-Mid-Term Options
- Buy Call Option: Strike 77.0, Expiration 2024-06-07
- Delta: 0.9181
- Premium: $1.95
- Profit: $3.7108
- ROI: 1.903
-
Theta: -0.0224
-
Sell Put Option: Strike 79.0, Expiration 2024-06-07
- Delta: -0.2204
- Premium: $0.51
- Profit: $0.51
- ROI: 100.0
- Theta: -0.0311
Analysis: The 77.0 strike call with mid-term expiration presents a reasonable balance between delta and profit potential. The 79.0 strike put option offers a 100% ROI with manageable delta, reducing the risk of assignment while providing a higher premium, beneficial for enhancing overall strategy profitability.
Choice 3: Mid-Term Options
- Buy Call Option: Strike 73.0, Expiration 2024-09-20
- Delta: 0.9938
- Premium: $12.70
- Profit: $7.4608
- ROI: 0.5874
-
Theta: -0.0033
-
Sell Put Option: Strike 75.0, Expiration 2024-09-20
- Delta: -0.2156
- Premium: $1.38
- Profit: $1.38
- ROI: 100.0
- Theta: -0.0105
Analysis: The 73.0 strike call option with a high delta is nearly assured to be in the money, offering a solid profit but a lower ROI due to a high premium. Pairing this with a 75.0 strike put option reduces assignment risk with its moderate delta while generating a decent premium and a 100% ROI, creating a balanced strategy.
Choice 4: Long-Term Options
- Buy Call Option: Strike 70.0, Expiration 2024-11-15
- Delta: 0.8038
- Premium: $12.65
- Profit: $5.5608
- ROI: 0.4253
-
Theta: -0.0222
-
Sell Put Option: Strike 77.5, Expiration 2024-11-15
- Delta: -0.3169
- Premium: $3.08
- Profit: $3.08
- ROI: 100.0
- Theta: -0.0097
Analysis: In a long-term horizon, the 70.0 strike call option offers a high delta with strong profit potential albeit with moderate ROI. The 77.5 strike put option provides a high premium and a guaranteed ROI of 100%, coupled with a moderate delta to minimize assignment risk, ensuring overall profitability.
Choice 5: Very Long-Term Options
- Buy Call Option: Strike 67.5, Expiration 2025-01-17
- Delta: 0.9401
- Premium: $38.60
- Profit: $9.0608
- ROI: 0.2347
-
Theta: -0.0102
-
Sell Put Option: Strike 75.0, Expiration 2025-01-17
- Delta: -0.2668
- Premium: $2.78
- Profit: $2.78
- ROI: 100.0
- Theta: -0.0082
Analysis: For a very long-term strategy, the 67.5 strike call, while expensive, offers substantial profit and a reliable delta indicating a high likelihood of being in the money. Matched with a 75.0 strike put, this combination reduces assignment risks and guarantees a 100% ROI from the premium collected, providing a robust foundation for a long-term hedge.
Conclusion
When employing calendar spreads, balancing the most profitable call options against strategically selected put options minimizes assignment risk while maximizing profitability. The chosen combinations of strike prices and expiration dates ensure a diversified strategy across various time horizons, each tailored to specific risk and reward profiles.
Calendar Spread Option Strategy #1
As you are considering a calendar spread options strategy on DuPont de Nemours, Inc. (DD), buying a put option at one expiration date and selling a call option at a different calendar date can lead to substantial returns if executed correctly. Below, I analyze various choices focusing on both near term and long term options based on their expiration dates and strike prices. The aim is to identify the most profitable strategy while minimizing the risk of having shares assigned.
Choice 1: Near-Term (2024-05-31) Short Call Options
Strike Price: $80
- Delta: 0.796
- Gamma: 0.216
- Vega: 2.937
- Theta: -0.035
- Premium: $1.20
- Profit: $1.20
The $80 strike price call option expiring on 2024-05-31 offers a good balance of premium ($1.20) versus risk, albeit it has a higher delta (0.796), implying a potential higher risk of assignment. Given that the target stock price is 2% over or under the current stock price, selling this call reduces the immediate outlay while benefiting from time decay (theta). This option fits a moderately bullish outlook.
Choice 2: Medium-Term (2024-06-21) Short Call Options
Strike Price: $77.5
- Delta: 0.866
- Gamma: 0.062
- Vega: 4.734
- Theta: -0.018
- Premium: $3.70
- Profit: $1.79
For a medium-term horizon, the call option with a strike price of $77.5 expiring on 2024-06-21 looks lucrative given its substantial premium of $3.70. The delta of 0.866 suggests a high sensitivity to the stock price, thus carrying more risk of assignment, but its higher premium can cushion potential losses. The option's theta indicates a slower time decay, allowing more profit retention over time.
Choice 3: Longer-Term (2024-09-20) Short Call Options
Strike Price: $80
- Delta: 0.588
- Gamma: 0.039
- Vega: 17.777
- Theta: -0.019
- Premium: $4.40
- Profit: $4.40
Looking further out, the $80 strike price call expiring on 2024-09-20 provides an excellent premium ($4.40), with a more manageable delta of 0.588, reducing risks slightly. The vega is high, meaning this option's price will react significantly to volatility changes. This setup allows for capturing significant decay and benefiting from overall market stability.
Choice 4: Far-Term (2025-01-17) Short Call Options
Strike Price: $80
- Delta: 0.589
- Gamma: 0.022
- Vega: 24.970
- Theta: -0.016
- Premium: $7.20
- Profit: $7.20
For a far-term approach, the $80 strike price call expiring on 2025-01-17 presents a highly attractive premium of $7.20. Though the delta remains moderate (0.589), the high vega signals a heavy reliance on volatility to maintain premium values. This hedging strategy is suitable for a more stable outlook over many months, reducing immediate risks significantly.
Choice 5: Long-Term (2026-01-16) Short Call Options
Strike Price: $80
- Delta: 0.611
- Gamma: 0.012
- Vega: 38.012
- Theta: -0.011
- Premium: $12.88
- Profit: $12.88
Finally, for the long-term horizon, the $80 strike call expiring on 2026-01-16 offers a whopping $12.88 premium. A delta closer to moderate levels (0.611) mitigates immediate assignment risks, while a very high vega underscores sensitivity to changes in volatility. This setup is excellent for investors looking to lock in premiums for an extended period and willing to tolerate fluctuating market conditions.
Risk and Reward Analysis
- Near-Term Calls: Present higher theta and lower premiums, making them suitable for capturing quick decay in value but requiring close management to avoid assignments due to higher deltas.
- Medium-Term Calls: Offer a balanced approach with moderate premiums and delta values, still subject to assignment risks but better suited for slightly longer views.
- Longer and Far-Term Calls: Provide substantial premiums and lower deltas relative to immediate risks. Their vega exposure encourages usage in more stable periods.
- Long-Term Calls: Targeting high premiums with the lowest relative risks, long-term options like those expiring in 2026 allow capturing extensive decay and volatility, offering significant return potentials while efficiently reducing assignment risks if properly managed.
These strategies, using short call options across various timeframes, allow you to hedge effectively and maximize profits relative to the anticipated price movements and time decay benefits.
Calendar Spread Option Strategy #2
A calendar spread, also known as a time spread, is an options strategy where you simultaneously buy and sell two options of the same type (put or call) with the same strike price but different expiration dates. Given your interest in selling put options and buying call options at different expiration dates, we can consider your position as a combination of a long call position and a short put position.
Strategy Considerations
- Minimizing Assignment Risk:
-
Since you are looking to sell put options, being deep in-the-money (ITM) adds considerable risk of assignment, especially as the expiration date nears. Thus, you will want to select strike prices and expiration dates where the delta of the put sold is low enough to minimize the likelihood of assignment.
-
Profit Potential and Risks:
- The profitability of the long calendar spread will usually benefit from an increase in the implied volatility of the long call and depreciation of the short put due to time decay.
- Given the nature of your strategy, if the stock price remains around the strike price of the sold put, both positions will benefit: the put will decay in value as it approaches expiration, and the call will retain its time value.
Top Five Calendar Spreads:
- Near-Term Less Than One Month:
-
Sell Put: Strike 84, Expiration 2024-05-31 Delta: 0.0926 Theta: -0.0302 Premium: $0.10
-
Buy Call: Strike 82.5, Expiration 2024-06-07 Delta: 0.365 Theta: -0.0377 Premium: $0.48
-
Analysis: This strategy minimizes assignment risk as the delta of the put is very low (0.0926), meaning its far OTM. The call has a decent theta relative to its modest premium, providing favorable time decay attributes.
-
Short to Medium Term One to Two Months:
-
Sell Put: Strike 82.5, Expiration 2024-06-21 Delta: 0.3579 Theta: -0.0253 Premium: $0.75
-
Buy Call: Strike 80.0, Expiration 2024-07-19 Delta: 0.609 Theta: -0.0220 Premium: $2.72
-
Analysis: This pair balances a slightly higher delta put (0.3579) with a call having high vega and a good theta:premium ratio. The potential reward increases without significant assignment risk due to the relatively OTM nature of the put.
-
Medium Term Around Three Months:
-
Sell Put: Strike 85.0, Expiration 2024-09-20 Delta: 0.3859 Theta: -0.0170 Premium: $2.10
-
Buy Call: Strike 80.0, Expiration 2024-11-15 Delta: 0.5858 Theta: -0.0179 Premium: $5.80
-
Analysis: The strategy's theta and delta values ensure a reasonable balance between risk (assignment) and reward potential (appreciation). The relatively low risk of assignment on the delta 0.3859 put makes it attractive.
-
Long Term Six Months:
-
Sell Put: Strike 77.5, Expiration 2025-01-17 Delta: 0.6434 Theta: -0.0160 Premium: $8.60
-
Buy Call: Strike 80.0, Expiration 2025-06-20 Delta: 0.6108 Theta: -0.0111 Premium: $12.88
-
Analysis: This strategy leverages the premium collection opportunity from a higher delta put (which can be worth considering if the higher premium is the primary goal). The theta decay of the call option is manageable relative to its premium.
-
Very Long Term More Than One Year:
-
Sell Put: Strike 85.0, Expiration 2026-01-16 Delta: 0.5485 Theta: -0.0111 Premium: $9.62
-
Buy Call: Strike 80.0, Expiration 2026-01-16 Delta: 0.6109 Theta: -0.0111 Premium: $12.88
-
Analysis: This option pair provides a balanced delta and theta profile over a long duration. The strategy can be advantageous given the lower likelihood of put assignment due to greater distance from spot delta neutrality.
Final Thoughts:
In applying the chosen strategies, always consider implied volatility (IV) and its potential increase or decrease over time, which significantly impacts options premiums. Keeping the deltas moderate ensures reduced assignment risk while maintaining exposure to beneficial sequential decay and price appreciation dynamics. Balancing theta, vega, and premium costs will help optimize the comprehensive profitability of your long calendar spread strategy.
Similar Companies in Chemicals - Specialty:
Eastman Chemical Company (EMN), Olin Corporation (OLN), Cabot Corporation (CBT), Kronos Worldwide, Inc. (KRO), LyondellBasell Industries N.V. (LYB), Report: Air Products and Chemicals, Inc. (APD), Air Products and Chemicals, Inc. (APD), Report: PPG Industries, Inc. (PPG), PPG Industries, Inc. (PPG), Report: Linde plc (LIN), Linde plc (LIN), Ecolab Inc. (ECL), Report: The Sherwin-Williams Company (SHW), The Sherwin-Williams Company (SHW), Report: RPM International Inc. (RPM), RPM International Inc. (RPM), Albemarle Corporation (ALB), Dow Inc. (DOW), BASF SE (BASFY), Celanese Corporation (CE), The Chemours Company (CC), Huntsman Corporation (HUN), FMC Corporation (FMC)
https://www.prnewswire.com/news-releases/dupont-announces-leadership-transition-302153393.html
https://www.youtube.com/watch?v=IHz_kCh40aE
https://www.youtube.com/watch?v=RajinvZHL1M
https://www.youtube.com/watch?v=7iM_gU3CdYc
https://finance.yahoo.com/m/02cf412d-8eee-3a44-b62e-5eead98f5e53/basic-materials-roundup%3A.html
https://finance.yahoo.com/m/13d0e5aa-6b22-3e79-9b70-44a662f89646/analyst-report%3A-dupont-de.html
https://finance.yahoo.com/news/deutsche-bank-adjusts-price-target-105534341.html
https://finance.yahoo.com/news/dupont-tedlar-showcases-aerospace-innovations-130000505.html
https://finance.yahoo.com/m/acd02bc7-f580-3ffa-94a9-2c2b32021876/buy-dupont-on-breakup-plan%2C.html
https://finance.yahoo.com/news/dupont-nxp-semiconductors-upgraded-wall-133317041.html
https://finance.yahoo.com/news/deutsche-bank-adjusts-price-target-135049687.html
https://www.sec.gov/Archives/edgar/data/1666700/000166670024000013/dd-20240331.htm
Copyright © 2024 Tiny Computers (email@tinycomputers.io)
Report ID: 5TQYZG
Cost: $0.70624