Orange S.A. (ticker: ORAN)
2024-02-04
 Orange S.A. (ticker: ORAN), a prominent multinational telecommunications company, has established itself as a leader in the global telecom industry, with a significant presence in Europe, Africa, and the Middle East. The company offers a wide range of services, including fixed telephony, mobile communication, and broadband Internet, catering to both individual consumers and businesses. Throughout its operations, Orange S.A. has demonstrated a strong commitment to innovation, particularly in the areas of 5G technology and digital transformation. Financially, it has shown resilience and adaptability in a highly competitive market, maintaining steady revenue growth and investing in strategic partnerships and acquisitions to expand its service offerings and geographical reach. As of the latest reports, Orange S.A. continues to focus on customer satisfaction, network expansion, and sustainability initiatives, positioning itself for long-term success in the evolving global telecommunications landscape.
| Full Time Employees | 136,430 | CEO Pay | 1,566,892 | Previous Close | 11.94 |
| Dividend Rate | 0.75 | Dividend Yield | 0.0631 | Payout Ratio | 1.1538 |
| 5 Year Avg Dividend Yield | 6.57 | Beta | 0.083 | Trailing PE | 17.984848 |
| Forward PE | 9.891666 | Volume | 270,377 | Average Volume | 253,418 |
| Market Cap | 31,546,066,944 | 52 Week Low | 10.21 | 52 Week High | 13.08 |
| Price to Sales Trailing 12 Months | 0.72156423 | Enterprise Value | 68,299,497,472 | Profit Margins | 0.04129 |
| Total Cash | 12,712,999,936 | Total Debt | 46,428,999,680 | Revenue Per Share | 16.374 |
| Return on Assets | 0.03115 | Return on Equity | 0.06375 | Free Cashflow | 2,561,625,088 |
| Earnings Growth | -0.286 | Revenue Growth | 0.012 | Gross Margins | 0.37542 |
| EBITDA Margins | 0.28994 | Operating Margins | 0.101739995 | Current Price | 11.87 |
| Sharpe Ratio | 1.153126154578183 | Sortino Ratio | 18.923915201193484 |
| Treynor Ratio | 3.0968542602493976 | Calmar Ratio | 1.7863103519732986 |
Upon reviewing the provided financial and technical analysis data for ORAN, several key observations and ensuing prognostications can be made regarding its future stock price movement. It is imperative to take into account the amalgamation of technical indicators alongside fundamental and balance sheet data to forecast the stock's trajectory in the forthcoming months comprehensively.
The technical indicators reveal a nuanced tapestry of ORAN's recent market behavior. Notably, the On-Balance Volume (OBV) demonstrates a positive trend, indicating growing buying interest among investors. When juxtaposed with the MACD histogram's transition from positive to negative, this delineates a mixed technical outlook. Initially, the positive OBV suggests an accumulation phase; however, the declining MACD histogram alludes to diminishing momentum, suggesting that caution is warranted in the short term.
Diving into the fundamental analysis, ORAN exhibits robust financial health, as evidenced by considerable gross and EBITDA margins of 0.37542 and 0.28994, respectively. Despite a commendable operating margin, the absence of a trailing Peg Ratio and the nuanced data surrounding earnings and revenue estimates signal a landscape of uncertainty and potential volatility in investor sentiment.
The balance sheet and cash flows delineate a company with a solid financial stance yet burdened by a significant debt load, highlighted by a net debt of over 31 billion EUR by the end of 2022. The ability to generate free cash flow to the tune of approximately 2.5 billion EUR is admirable, yet the financial obligations posed by the debt must be meticulously managed to ensure long-term sustainability and investor confidence.
The risk-adjusted performance metrics, including the Sharpe, Sortino, Treynor, and Calmar ratios, illuminate the investment's attractiveness under varying market conditions. Specifically, the exceptionally high Sortino ratio of 18.923 hints at ORAN's favourable returns when accounting for negative volatility, underscoring its potential resilience during downward market shifts. These ratios collectively paint ORAN as a potentially viable investment when risk-adjusted returns are a consideration, albeit with caveats centered around external market conditions and inherent company-specific risks.
In summary, while there are areas of optimism rooted in ORAN's financial health and certain technical and risk-adjusted performance metrics, these are tempered by concerns around debt levels, mixed technical signals, and looming market uncertainties. The next few months are likely to see ORAN's stock price experience periods of volatility, with potential for both appreciation and depreciation hingeing closely on broader market trends, investor sentiment, and the company's strategic maneuverings in managing its debt and capitalizing on its strengths. Investors are encouraged to stay abreast of market developments and company announcements, as these will play critical roles in the stock's short- to medium-term price movements.
In our analysis of Orange S.A. (ORAN), two critical financial metrics were calculated to assess the company's value and efficiency: the Return on Capital (ROC) and the Earnings Yield. The ROC, amounting to 5.969%, is a pivotal measure that indicates how effectively the company utilizes the capital (both debt and equity) it has been entrusted with to generate profit. A ROC near 6% is generally considered respectable in many industries, demonstrating that Orange S.A. is making efficient use of its capital, albeit there's room for enhancement when compared to the highest performing companies in the sector. On the other hand, the Earnings Yield, calculated at approximately 6.15%, serves as an inverse of the P/E ratio, providing insight into the companys profitability from the shareholders' perspective. A higher earnings yield implies a potentially undervalued stock or a robust earnings generation capability relative to the share price. At just over 6%, Orange S.A.'s earnings yield suggests that the company may present a favorable investment opportunity, assuming the market price of its shares does not fully reflect its earnings capacity. Together, these figures offer a nuanced view of Orange S.A.'s operational efficiency and its attractiveness as an investment prospect.
Analyzing Orange S.A. (ORAN) through the lens of Benjamin Graham's investing principles provides a multifaceted view of its investment potential. Here's how Orange S.A. stands relative to each criterion:
1. Price-to-Earnings (P/E) Ratio:
- ORAN's P/E Ratio: 12.996
- Graham's Criterion: Prefers low P/E ratios.
- Analysis: ORAN's P/E ratio of approximately 13 suggests that the stock may not be overpriced relative to earnings. This could potentially meet Graham's criteria for investment, considering it's lower than many high-growth companies. However, comparison to the industry average P/E (not provided) is necessary for a conclusive analysis.
2. Price-to-Book (P/B) Ratio:
- ORAN's P/B Ratio: 0.287
- Graham's Criterion: Looks for stocks trading below their book value.
- Analysis: With a P/B ratio well below 1, ORAN appears to be trading at a significant discount to its book value, making it attractive by Graham's standards.
3. Debt-to-Equity Ratio:
- ORAN's Debt-to-Equity Ratio: 1.446
- Graham's Criterion: Prefers low debt-to-equity ratios.
- Analysis: ORAN's debt-to-equity ratio exceeds 1, suggesting higher financial risk and reliance on debt. This might not align well with Graham's preference for lower debt levels.
4. Dividend Record:
- ORAN's Dividend History: Shows consistent dividend payments over the years, with variations in the amount.
- Graham's Criterion: Values a consistent history of paying dividends.
- Analysis: ORAN demonstrates a strong track record of dividend payments, aligning well with Graham's emphasis on dividend consistency.
5. Current and Quick Ratios:
- ORAN's Current and Quick Ratios: Both are 0.916
- Graham's Criterion: Higher ratios indicate better financial stability.
- Analysis: ORAN's current and quick ratios, both below 1, suggest that it might have challenges covering its short-term liabilities with its short-term assets, which could be a red flag under Graham's analysis.
Conclusion:
Orange S.A. aligns with several of Benjamin Graham's criteria, such as a low P/B ratio and a consistent dividend record, which highlights its potential as a value investment. However, its debt-to-equity ratio and liquidity ratios (current and quick ratios) suggest some areas of financial risk. Investors following Graham's philosophy might see ORAN as a mixed opportunity, appealing in terms of valuation and dividends but warranting caution due to its financial structure. The final decision should be informed by an individual investor's tolerance for risk and further comparison to industry benchmarks not provided in the current data set.
| Statistic Name | Statistic Value |
| R-squared | 0.219 |
| Adj. R-squared | 0.218 |
| F-statistic | 351.6 |
| Prob (F-statistic) | 2.39e-69 |
| Log-Likelihood | -2017.5 |
| No. Observations | 1256 |
| AIC | 4039 |
| BIC | 4049 |
| Const | -0.0183 |
| Beta | 0.4847 |
| Alpha | -0.0183 |
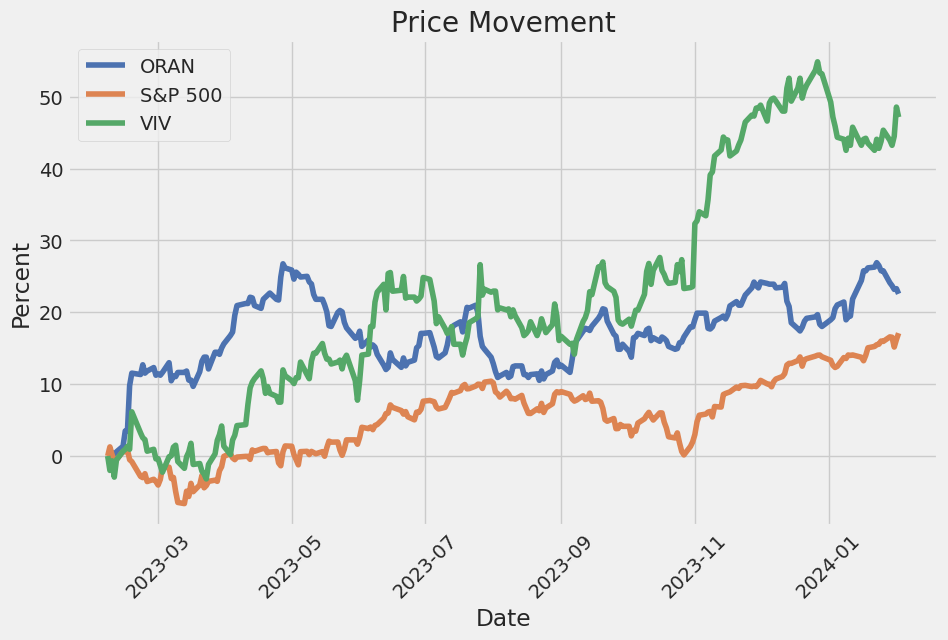
In exploring the linear relationship between ORAN and SPY, illustrated by a linear regression model, significant insights were divulged, particularly regarding the model's alpha. The calculated alpha, a proxy for the intercept of the equation when SPY equals zero, is observed to be approximately -0.0183. This indicates that when the market's performance (as benchmarked by SPY) is neutral, the expected return of ORAN anti-correlates slightly, introducing a nuanced perspective on ORAN's independence or systemic deviation from market trends. Such a negative alpha, albeit minimal, posits ORAN's performance as underwhelming in relation to an unchanging market, implying ORAN's expected return declines slightly when the market does not move.
Further contemplation on the statistical analysis reveals a beta of 0.4847, suggesting that ORAN exhibits less volatility in comparison to the broader market (SPY). The R-squared value, pegged at 0.219, suggests that approximately 21.9% of the variations in ORAN's price can be explained by the movements in SPY. This relatively low R-squared value underscores a moderate correlation and signals that a significant fraction of ORAN's price movements might be influenced by factors not encapsulated by SPY's performance. Amidst an array of statistical indicators, the alpha value stands out, depicting the nuanced relationship between ORAN and the overall market, thereby highlighting potential investment insights.
Orange S.A. has been earmarked for its commendable dividend yield, making it a noteworthy entity in the domain of investments, especially for those inclined towards consistent returns. The telecommunications giant's inclusion in the "46 Ideal 2024 Fortune and Barron's Dividogs" list by Seeking Alpha on September 24, 2023, is a testament to its robust financial health and its capacity to churn out ample cash flow for rewarding its shareholders. The concept of Dividogs emphasizes the attractiveness of companies that do not just offer lucrative yields but also present a picture of financial stability and growth potential. This backdrop sets a promising stage for Orange S.A., underscoring its significance in the ever-evolving telecommunications sector where connectivity and digital services demand are on a steep rise.
Orange's strategic maneuvers, which pivot around innovation and market adaption, greatly enhance its investment appeal. This is reflected through dividends that signal more than just immediate monetary gains; they indicate the companys enduring market stance and growth trajectory. In this light, Orange S.A.'s recognition as part of the Dividogs list isn't merely an acknowledgment of its present accomplishments but a pointer towards its sustainability as an investment choice amidst market volatilities. It underscores the companys prowess in maintaining investor confidence through consistent dividend payouts, which are integral markers of a company's financial vitality.
On another front, Orange S.A.s ambition in the digital transformation sector, particularly in cloud computing, is poised to redefine the French digital landscape. The initiation of Bleu, a venture aimed at establishing a "cloud de confiance" with Capgemini and in partnership with Microsoft, embarks a strategic move targeting the French State entities among others. The commercial kick-start of Bleu, as announced on January 15, 2024, promises an alignment with stringent security and compliance requisites while heralding a new era of cloud computing that melds technological innovation with reliability. This venture not only elevates Orange's profile in digital solutions but also highlights its commitment towards fostering a secure digital infrastructure across critical sectors in France.
In the broader spectrum of Oranges diversification and innovation, Orange Business emerges as a quintessential showcase of the companys leadership in digital transformation services. Recognized as the 2023 Company of the Year by Frost & Sullivan, Orange Business epitomizes the integration of cutting-edge technologies in revolutionizing customer and employee experiences across various sectors. With an expansive operational reach across 14 countries, this accolade not only fetes Orange Business's technological advancements but also its role in propelling digital connectivity forward. Such acclaim underscores Oranges strategic direction towards enhancing digital interactions and efficiencies, cementing its standing as an industry vanguard.
In a parallel development that underscores Orange's commitment to technological advancement and community service, its collaboration with Tenaka for marine ecosystem conservation via innovative digital solutions marks a significant stride towards environmental stewardship. The partnership, announced on January 24, 2024, leverages Orange Business's digital prowess in aiding Tenaka's coral reef restoration efforts within a Marine Protected Area in Malaysia. By employing AI-driven data analysis and a suite of digital tools, this initiative not only accentuates Oranges role in environmental preservation but also emphasizes its capability to harness technology for societal benefits.
These strategic initiatives resonate with Orange's broader vision as articulated in the "Lead the Future" strategy unveiled in February 2023. Orange's pursuit of network excellence and quality service, combined with its endeavors in digital transformation, environmental conservation, and cloud computing, encapsulates a multifaceted approach towards catering to diverse stakeholder interests. These segments, from dividend yields to digital infrastructure development and environmental sustainability initiatives, collectively narrate Oranges journey towards a sustainable and profitable future. Offering more than just connectivity, Orange positions itself as a key player in digital transformation, financial stability, and societal contribution, underscoring its resilience and adaptability in the face of evolving global dynamics.
The volatility of Orange S.A. (ORAN) from February 6, 2019, to February 2, 2024, indicates no significant relationship between past returns and future returns, as evidenced by an R-squared value of 0.000. The ARCH model results show a high level of volatility with an omega coefficient of 1.3421, indicating the baseline volatility is substantial. Furthermore, the alpha[1] coefficient is 0.3134, suggesting that recent past squared returns have a significant impact on future volatility, but this effect is moderate in size.
| Statistic Name | Statistic Value |
|---|---|
| R-squared | 0.000 |
| Log-Likelihood | -2127.10 |
| AIC | 4258.21 |
| BIC | 4268.48 |
| Omega | 1.3421 |
| Alpha[1] | 0.3134 |
To analyze the financial risk associated with a $10,000 investment in Orange S.A. (ORAN) over a one-year period, a sophisticated approach combines volatility modeling and machine learning predictions. This dual-method strategy permits a deep understanding of the inherent risks by marrying the strength of traditional financial econometrics with the predictive prowess of contemporary data science techniques.
The utilization of volatility modeling is pivotal in capturing the inherent risks by studying past price fluctuations of Orange S.A.'s stock. This technique, focusing on historical price data, enables the construction of a volatility model that accurately reflects the fluctuating nature of the stock market. By applying this model specifically to Orange S.A., we can extrapolate past trends into future volatility expectations. It is particularly valuable in estimating the level of risk associated with stock price movements, thereby providing a solid foundation for risk assessment.
In tandem with this, machine learning predictions step in to handle the forecasting aspect, particularly future returns of Orange S.A. stock. By employing a predictive model that learns from historical data, the aim is to provide an educated guess on the stock's future price movements based on patterns recognized from past performance. This approach is advantageous for its ability to digest and learn from vast datasets, uncovering non-linear relationships that might not be immediately apparent through traditional analysis methods.
When integrating the insights provided by volatility modeling and machine learning predictions, we are furnished with a nuanced understanding of both the expected future volatility and stock price movements of Orange S.A. By synthesizing these methodologies, the analysis can account for the dynamic and complex nature of financial markets, offering a more comprehensive risk assessment.
Focusing on the specifics, the calculated Value at Risk (VaR) at a 95% confidence interval for a $10,000 investment in Orange S.A. stands at $151.82 annually. This figure signifies that there is a 95% confidence level that the investor will not lose more than $151.82 over a one-year period, showcasing a relatively low risk of extreme loss. This calculated VaR is instrumental in quantifying the potential downside risk, providing investors with a numeric value that reflects the maximum expected loss under normal market conditions.
By marrying volatility modeling with machine learning predictions, the financial risk of investing in Orange S.A. is illuminated from both a historical and a forward-looking perspective. The integration of these methodologies not only underscores the effectiveness of combining traditional econometric models with cutting-edge predictive algorithms but also provides investors with a clearer understanding of potential risks when allocating capital to equity investments.
Analyzing the options chain for Orange S.A. (ORAN) with an aim to identify the most profitable call options, we resort to understanding the implications of the Greeks - Delta, Gamma, Vega, Theta, and Rho, alongside other critical figures including the strike price, days to expire, premium, ROI, and profit.
For a quick recap on the Greeks, Delta measures the rate of change of the option's price with respect to the stock's price. A higher delta indicates the option price is more sensitive to stock price changes. Gamma reflects the rate of change of Delta, providing insight into the stability of Delta's change. Vega assesses the option's sensitivity to volatility, Theta indicates the time decay of the option's price, and Rho measures the sensitivity of the option's price to interest rate changes.
Firstly, keep in mind that our target is looking at options that would significantly benefit from a 5% increase in the current stock price.
Considering this, the option with a strike of $10.0, expiring on 2024-08-16, displays a highly attractive profile. It has a Delta of 0.967, suggesting that the option's price will near-identically mirror changes in the stock's price, almost dollar for dollar. Coupled with a Theta value close to zero (-0.000903), this option suggests minimal time decay over the short term. Additionally, its Vega and Gamma are both at 0, indicating no expected change in its price due to volatility or acceleration of Delta, which is quite unique. The Rho value at 5.176 implies significant sensitivity to interest rate changes, suggesting that increases in rates could further bolster its price. With a premium of $1.73 and an ROI of approximately 42.4%, culminating in a profit of $0.7335, this option appears highly profitable under stable market conditions.
On the contrast, the option with a strike of $10.0, expiring on 2024-05-17, shows a different appeal. With a Delta of 0.705, it is somewhat less sensitive to stock price changes than previously discussed options, but offers a higher Vega of 2.083, suggesting a greater benefit from volatility. It has a similar negative Theta to other options, indicating it will also decrease over time due to time decay, though at a comparable minimal rate. An interesting aspect is its comparatively high Rho of 1.3697, hinting at good sensitivity to interest rates. With a premium of $1.8, ROI of 36.86%, and profit of $0.6635, this option could be more appealing for traders looking to leverage volatility and potential interest rate increases.
Lastly, comparing these options to those with shorter days to expiration or different strike prices, it's clear the strategic value lies in the balance between time decay, sensitivity to the underlying stock's price moves, and other market conditions like volatility and interest rates. The previously mentioned $10.0 strike expiring on 2024-08-16 stands out for those seeking alignment with direct stock price movement with minimal decay and high-interest rate sensitivity, whereas the $10.0 strike expiring on 2024-05-17 might appeal more to those hedging on volatility and moderate Delta sensitivity.
In conclusion, while choosing the most profitable option depends on specific market outlooks and individual risk tolerance, the presented analysis highlights promising opportunities based on Delta, Vega, Theta, and other key metrics. Always consider the role of the Greeks in concert with market expectations and your investment strategy when selecting options.
Similar Companies in Telecom Services:
Telefonica Brasil S.A. (VIV), Report: Vodafone Group Public Limited Company (VOD), Vodafone Group Public Limited Company (VOD), Grupo Televisa, S.A.B. (TV), America Movil, S.A.B. de C.V. (AMX), Telefonica, S.A. (TEF), SK Telecom Co.,Ltd (SKM), KT Corporation (KT), Liberty Broadband Corporation (LBRDA), PLDT Inc. (PHI), Report: TIM S.A. (TIMB), TIM S.A. (TIMB), Report: Verizon Communications Inc. (VZ), Verizon Communications Inc. (VZ), Lumen Technologies, Inc. (LUMN), Report: Comcast Corporation (CMCSA), Comcast Corporation (CMCSA), Report: AT&T Inc. (T), AT&T Inc. (T), T-Mobile US, Inc. (TMUS)
https://seekingalpha.com/article/4661507-46-ideal-2024-fortune-and-barrons-dividogs
https://finance.yahoo.com/news/pr-capgemini-orange-pleased-announce-085300082.html
https://finance.yahoo.com/m/035f1cc9-d0c1-36e3-b4e8-d5b449655a49/ingredion-partners%2C-invests.html
https://finance.yahoo.com/news/orange-business-earns-frost-sullivans-090000993.html
https://finance.yahoo.com/news/orange-bank-trust-company-doubles-214500284.html
https://finance.yahoo.com/news/t-naka-partners-orange-business-090000008.html
https://finance.yahoo.com/news/orange-bank-trust-company-opens-213000004.html
https://finance.yahoo.com/news/orange-county-bancorp-inc-announces-221500634.html
https://finance.yahoo.com/news/orange-county-bancorp-inc-obt-233502779.html
Copyright © 2024 Tiny Computers (email@tinycomputers.io)
Report ID: oMltr5
Cost: $0.43129
https://reports.tinycomputers.io/ORAN/ORAN-2024-02-04.html Home