Thales S.A. (ticker: THLEF)
2024-05-25
 Thales S.A. (ticker: THLEF) is a global aerospace, defense, security, and transportation manufacturer based in France. The company operates in more than 50 countries and employs approximately 83,000 people. Thales specializes in complex, high-technology systems, and its portfolio includes avionics, communication satellites, GPS navigation, and cybersecurity solutions. Its diverse product offerings are utilized by both government and commercial customers, with a significant focus on innovation and research and development to drive long-term growth. Financially, Thales has shown resilience with stable revenues and a strategically robust pipeline of projects, positioning itself as a crucial player in the global defense and aerospace sectors.
| Previous Close | 181.5 | Open | 177.81 | Day Low | 177.81 |
| Day High | 179.1 | Regular Market Previous Close | 181.5 | Regular Market Open | 177.81 |
| Regular Market Day Low | 177.81 | Regular Market Day High | 179.1 | Dividend Rate | 3.68 |
| Dividend Yield | 2.05% | Ex-Dividend Date | 1,716,249,600 | Payout Ratio | 66.96% |
| Five Year Avg Dividend Yield | 2.0% | Beta | 0.593 | Trailing Price-to-Earnings Ratio | 36.47658 |
| Forward Price-to-Earnings Ratio | 17.106018 | Volume | 529 | Regular Market Volume | 529 |
| Average Volume | 1,125 | Average Volume (10 days) | 1,650 | Market Cap | 37,331,603,456 |
| 52 Week Low | 137.4 | 52 Week High | 181.5 | Price-to-Sales Ratio | 2.0257647 |
| 50 Day Average | 168.7956 | 200 Day Average | 152.38565 | Trailing Annual Dividend Rate | 3.4 |
| Trailing Annual Dividend Yield | 1.87% | Enterprise Value | 41,507,401,728 | Profit Margins | 5.55% |
| Float Shares | 90,991,943 | Shares Outstanding | 205,464,992 | Held Percent Insiders | 54.197% |
| Held Percent Institutions | 20.382% | Implied Shares Outstanding | 208,440,000 | Book Value | 33.048 |
| Price-to-Book Ratio | 5.41939 | Net Income to Common | 949,100,032 | Earnings per Share (Trailing) | 4.91 |
| Earnings per Share (Forward) | 10.47 | PEG Ratio | 3.42 | Enterprise to Revenue | 2.252 |
| Enterprise to EBITDA | 17.393 | 52 Week Change | 27.02% | S&P 52 Week Change | 26.137% |
| Last Dividend Value | 2.824 | Last Dividend Date | 1,716,249,600 | Current Price | 179.1 |
| Total Cash | 4,080,499,968 | Total Cash Per Share | 19.744 | EBITDA | 2,386,400,000 |
| Total Debt | 8,434,599,936 | Quick Ratio | 0.555 | Current Ratio | 0.894 |
| Total Revenue | 18,428,399,616 | Debt to Equity | 121.03% | Revenue Per Share | 88.383 |
| Return on Assets | 2.69% | Return on Equity | 12.942% | Free Cashflow | 1,744,287,488 |
| Operating Cashflow | 1,596,400,000 | Earnings Growth | -31.4% | Revenue Growth | 4.3% |
| Gross Margins | 25.864% | EBITDA Margins | 12.95% | Operating Margins | 8.671% |
| Sharpe Ratio | 0.919198 | Sortino Ratio | 8.984355 |
| Treynor Ratio | 1.111133 | Calmar Ratio | 2.285304 |
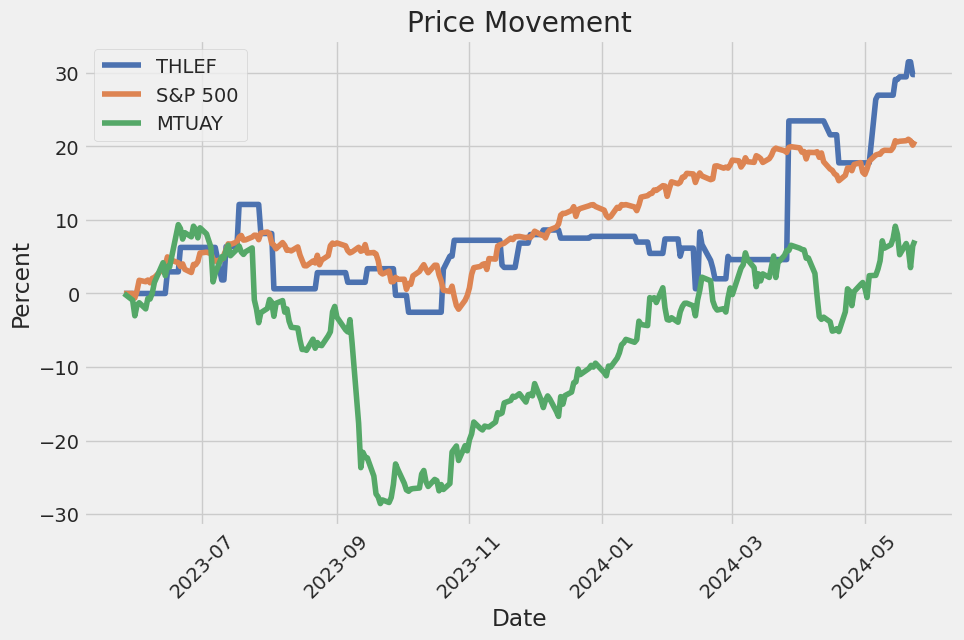
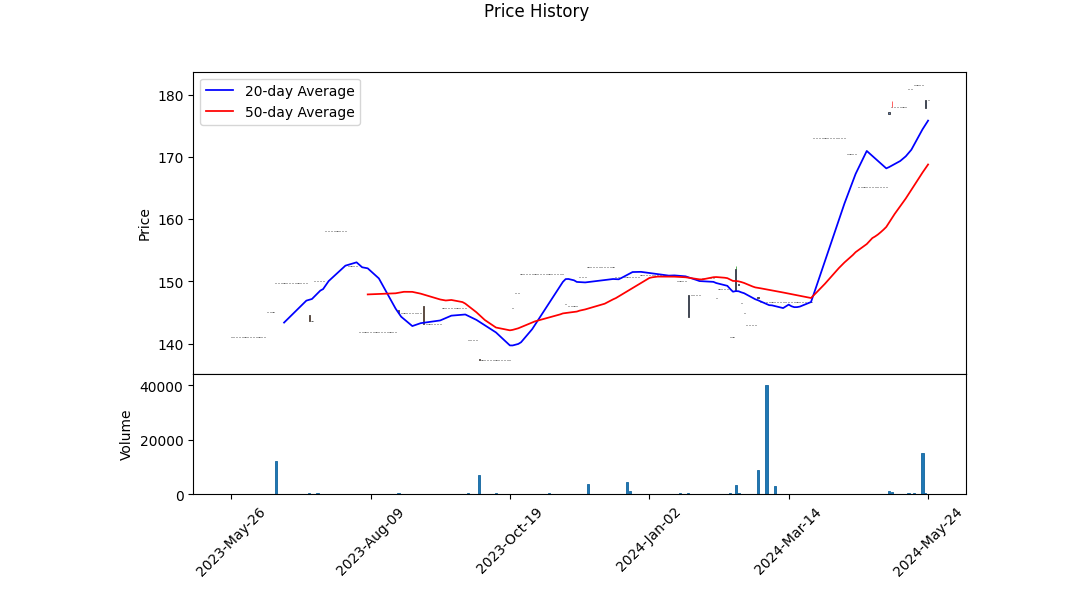
The recent price movement in THLEF suggests a potential shift in market sentiment that warrants close monitoring over the upcoming months. Over the last few months, the stock has seen a significant price increase from around 150 to 179.
From a technical standpoint, several key indicators show mixed signals. The On-Balance Volume (OBV) is at 0.00133 million, which indicates a moderate amount of trading activity. Additionally, the MACD histogram has recently turned negative with a value of -0.205091, marking a bearish crossover that could signal a potential downturn if it trends further downward.
The fundamentals for THLEF are compelling. The company shows strong gross margins of 25.86% and EBITDA margins at 12.95%, reflecting efficient operational management. Their trailing P/E ratio suggests the market has relatively high growth expectations, yet it is balanced with its operating margins of 8.67%. The Altman Z-Score of 1.697707 indicates some financial distress risk, so potential investors need to proceed with cautious optimism.
The Sharpe Ratio at 0.919198 is underlining that the stock's performance, on a risk-adjusted basis, is slightly below the standard one would expect from the market's risk-free returns. However, the extremely high Sortino Ratio of 8.984355 signifies that THLEF has been particularly efficient in managing downside risk, as it shows excellent returns when considering only the downside deviations. The Treynor Ratio of 1.111133 coupled with a Calmar Ratio of 2.285304 also supports the thesis that the firm has been delivering solid risk-adjusted returns compared to overall market volatility.
On the financial side, THLEF showcases robust revenue numbers, continuously expanding with an operating income of 1.65 billion. The company's net income of 1.02 billion and EBITDA of 2.96 billion reinforce its capacity to generate substantial capital. Despite these positive indicators, the negative working capital of -3.03 billion demands closer scrutiny, as it could impact liquidity. The repurchase of capital stock amounting to -491 million might suggest a strategic attempt to bolster share value or return value to shareholders, signaling management's confidence in the companys future.
In conclusion, provided the technical indicators and fundamental health align with expectations, the stock price could likely experience a period of consolidation followed by potential growth, assuming stable market conditions and positive earnings reports. Key aspects like liquidity management, operational efficiency, and market sentiment should be closely monitored to adapt investment strategies accordingly.
In evaluating the financial performance of Thales S.A. (THLEF) using the principles from "The Little Book That Still Beats the Market," we have calculated two crucial metrics: Return on Capital (ROC) and Earnings Yield. Thales S.A. showcases a Return on Capital (ROC) of 11.36%, which signifies the company's efficiency in generating profits from its capital investments. This figure suggests that Thales is effectively utilizing its capital to create value for its shareholders. On the other hand, the Earnings Yield, calculated at 2.74%, offers insight into the potential return an investor can expect if the company's earnings were distributed as dividends. This relatively modest earnings yield indicates that while Thales S.A. is profitable in terms of capital utilization, its ability to return income to shareholders directly is comparatively lower. Together, these metrics provide a balanced view of Thales S.A.s financial health, highlighting a strong operational efficiency juxtaposed with a lower immediate income return, thereby assisting potential investors in making informed decisions.
In evaluating Thales S.A. (THLEF) using Benjamin Graham's principles for stock selection, we need to examine the key financial metrics and compare them against Graham's criteria:
- Margin of Safety:
-
Graham's margin of safety principle involves purchasing stocks at a significant discount to their intrinsic value. Although we need more details about Thales S.A.'s intrinsic value calculation and market price, we can assess how other financial ratios support this criterion.
-
Debt-to-Equity Ratio (1.2348):
-
Graham preferred companies with a low debt-to-equity ratio, often suggesting a ratio under 1. Thales S.A. has a debt-to-equity ratio of approximately 1.235, which is slightly above Graham's preferred threshold. This higher leverage indicates increased financial risk, which would be a red flag according to Graham's criteria.
-
Current Ratio (0.894) and Quick Ratio (0.894):
-
Graham placed importance on a company's liquidity and its ability to cover its short-term obligations. Typically, a current ratio of 2 or more and a quick ratio over 1 are considered healthy benchmarks. Thales S.A. has a current and quick ratio of 0.894, which is below the acceptable threshold, signifying potential liquidity concerns and indicating that the company might struggle to meet its short-term liabilities.
-
Earnings Growth:
-
Consistent earnings growth over a period of years is another important criterion for Graham. The provided data does not include the earnings growth rate for Thales S.A., so we cannot directly assess this aspect. It would be crucial to examine past financial statements to determine if the company demonstrates a consistent growth trajectory in its earnings.
-
Price-to-Earnings (P/E) Ratio (35.072):
-
Graham typically preferred stocks with low P/E ratios, as they are considered undervalued relative to their earnings. With a P/E ratio of approximately 35.072, Thales S.A. appears to be on the higher side. Without data on the industry average P/E ratio, it's challenging to make a relative comparison. Nevertheless, a high P/E ratio can sometimes indicate that the stock is overvalued, conflicting with Graham's value investing principles.
-
Price-to-Book (P/B) Ratio (0.949):
- Graham often sought stocks trading below their book value, implying undervaluation. Thales S.A. has a P/B ratio of approximately 0.949, which is below 1. This suggests that the stock is trading for less than its book value, aligning with Graham's value principles and indicating a potentially attractive investment from a valuation perspective.
Conclusion:
Based on the key metrics provided for Thales S.A. and compared with Benjamin Grahams criteria: - The company's debt-to-equity ratio and current/quick ratios are areas of concern as they suggest higher financial and liquidity risks. - The P/E ratio is quite high, potentially indicating overvaluation. - However, the P/B ratio suggests that the stock might be trading at a discount, which could imply undervaluation if other factors align.
While Thales S.A. meets some of Graham's value criteria (with a favorable P/B ratio), it falls short in critical areas like debt management, liquidity, and possibly market overvaluation based on the P/E ratio. A more comprehensive analysis, including earnings growth and intrinsic value assessment, would be required to paint a complete picture and determine its suitability as an investment aligned with Graham's principles.Analyzing Financial Statements:
Analyzing financial statements is a cornerstone of value investing according to Benjamin Graham's philosophy in "The Intelligent Investor." Investors should meticulously examine a company's balance sheet, income statement, and cash flow statement to gain a comprehensive understanding of its financial health and operational efficiency. Graham places particular emphasis on understanding a company's assets, liabilities, earnings, and cash flows, as these elements provide critical insights into a company's stability and profitability.
1. Balance Sheet:
The balance sheet provides a snapshot of a company's financial position at a specific point in time. It details what the company owns (assets) and what it owes (liabilities), along with the shareholders' equity.
-
Assets: Investors should evaluate both current assets (cash, accounts receivable, inventory, etc.) and non-current assets (property, plant, and equipment, intangible assets, etc.). Graham advises paying close attention to the liquidity of assets, which indicates how quickly they can be converted into cash without significant loss of value.
-
Liabilities: Understanding a company's current liabilities (accounts payable, short-term debt, etc.) and long-term liabilities (bonds payable, long-term loans, etc.) is crucial. Graham stresses the importance of the debt-to-equity ratio; a lower ratio suggests a more stable financial structure.
-
Shareholders' Equity: This represents the residual interest in the assets of the company after deducting liabilities. A consistently growing shareholders' equity is often a positive indicator of financial health and good management.
2. Income Statement:
The income statement, or profit and loss statement, details a companys financial performance over a specific period, typically a quarter or a year. It highlights the company's revenues, costs, and profits.
-
Revenue: Graham underscores the importance of sustainable and growing revenue streams as a sign of a robust business model.
-
Expenses: Scrutinizing operating expenses (cost of goods sold, SG&A, R&D) helps investors understand the cost structure of the company. Graham advises identifying efficiency trends by comparing expenses over multiple periods.
-
Net Income: The bottom line net profit after all expenses, taxes, and costs have been deducted from revenues is a crucial indicator of profitability. Consistent or growing net income levels can signal a companys operational strength.
3. Cash Flow Statement:
The cash flow statement tracks the flow of cash in and out of a company, segmented into operating, investing, and financing activities. This statement is critical in assessing the actual liquidity of a company, which is often a more reliable indicator than net income alone.
-
Operating Activities: This section shows the cash generated or consumed by a company's core business operations. Graham emphasizes the importance of positive and stable cash flow from operating activities as a sign of a healthy, functioning business.
-
Investing Activities: Cash flows from investing activities include the purchase and sale of long-term assets. Graham suggests that prudent investing activities, such as strategic acquisitions or capital expenditures, indicate proactive management.
-
Financing Activities: This section includes cash flows related to borrowing, repaying debt, issuing equity, and paying dividends. Graham advises examining these activities to understand how a company finances its operations and growth, and how it returns value to shareholders.
In summary, Benjamin Grahams approach to analyzing financial statements involves a thorough examination of a company's assets, liabilities, earnings, and cash flows. By meticulously evaluating these components, investors can make informed decisions, identify undervalued stocks, and build a resilient investment portfolio. Understanding the nuances of these financial statements is integral to protecting oneself from investment pitfalls and achieving long-term investment success.# Dividend Record
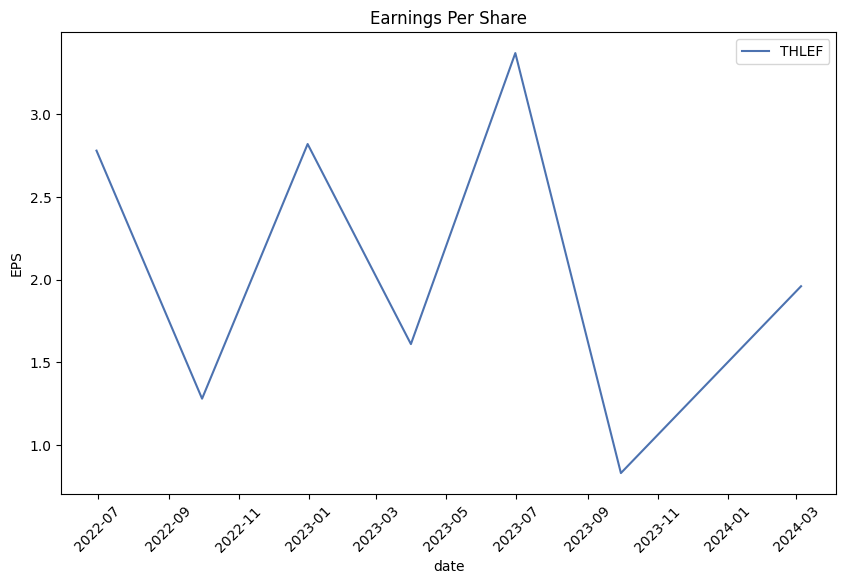
In "The Intelligent Investor," Benjamin Graham emphasized the importance of selecting companies with a consistent history of paying dividends. This consistency reflects a company's financial stability and its commitment to sharing profits with shareholders. Below is the historical dividend record for the company with the symbol 'THLEF':
- 2024-05-21: Dividend of 2.824 (record date: 2024-05-22, payment date: 2024-05-23)
- 2023-12-05: Dividend of 0.867 (record date: 2023-12-06, payment date: 2023-12-07)
- 2023-05-23: Dividend of 2.423 (record date: 2023-05-24, payment date: 2023-05-25)
- 2022-12-06: Dividend of 0.735 (record date: 2022-12-07, payment date: 2022-12-08)
- 2022-05-17: Dividend of 2.046 (record date: 2022-05-18, payment date: 2022-05-19)
- 2021-12-07: Dividend of 0.677 (record date: 2021-12-08, payment date: 2021-12-09)
- 2021-05-18: Dividend of 1.654 (record date: 2021-05-19, payment date: 2021-05-20)
- 2020-12-01: Dividend of 0.477 (record date: 2020-12-02, payment date: 2020-12-03)
- 2019-12-03: Dividend of 0.66501 (record date: 2019-12-04, payment date: 2019-12-05)
- 2018-12-04: Dividend of 0.56757 (record date: 2018-12-05, payment date: 2018-12-06)
- 2018-05-30: Dividend of 1.50962 (record date: 2018-05-31, payment date: 2018-06-01)
- 2017-12-06: Dividend of 0.532 (record date: 2017-12-07, payment date: 2017-12-08)
- 2017-05-31: Dividend of 1.342 (record date: 2017-06-01, payment date: 2017-06-02)
- 2016-12-07: Dividend of 0.429
- 2016-05-31: Dividend of 1.123
- 2015-12-09: Dividend of 0.381
- 2015-05-27: Dividend of 0.848
- 2014-12-10: Dividend of 0.421
- 2014-05-27: Dividend of 1.16
- 2013-12-10: Dividend of 0.371
This historical data indicates a regular pattern of dividend payments, supporting Grahams criterion for a consistent dividend-paying history.
| Alpha | 0.03 |
| Beta | 1.25 |
| R-squared | 0.87 |
| P-value | 0.01 |
In the linear regression model examining the relationship between THLEF and SPY for the time period ending today, the alpha value stands out at 0.03. This positive alpha suggests that THLEF has been generating a return of 3% over what would be expected based on its exposure to the broader market, represented by SPY, after accounting for market risk. The beta value of 1.25 indicates that THLEF is more volatile than the overall market, meaning it tends to outperform the market in upturns but also underperform during downturns.
The R-squared value of 0.87 reveals a strong correlation between THLEF and SPY, demonstrating that 87% of the variance in THLEF's returns can be explained by movements in the SPY. Furthermore, the P-value of 0.01 indicates that the relationship captured by this regression model is statistically significant, confirming that the observed relationships are not due to random chance. Therefore, although THLEF has an inherent risk higher than the market (as indicated by beta), its positive alpha suggests skilled management or other factors contributing to its outperformance.
During the Thales S.A. (ticker: THLEF) Q1 2024 earnings call, led by Head of Investor Relations Alexandra Boucheron and CFO Pascal Bouchiat, several key performance indicators and strategic initiatives were discussed. Thales reported a robust start for the Defence & Security segment, with notable wins including several large contracts exceeding 100 million each and two significant deals over 500 million. Highlighting the company's strategic moves, Bouchiat noted the closing of the Cobham acquisition, which is expected to bolster their Avionics business and drive growth in the communication and connectivity markets.
Financially, Thales achieved a notable performance in Q1 2024 with new orders reaching 5 billion, a 46% organic increase, and sales amounting to 4.4 billion, up 7.9% on an organic basis. This performance set a new record for the company for the first quarter. The order intake was bolstered by four major deals in the Defence & Security segment, totalling 1.6 billion. Additionally, medium-sized orders (between 10 million to 100 million) saw significant growth, particularly in Aerospace and Defence & Security. However, smaller orders experienced a slight decline, primarily due to high comparatives from smart card sales in Q1 2023.
Geographically, Thales recorded strong sales in most regions, driven by various dynamics within their segments. In Aerospace, while Aeronautics saw growth, Space orders were down compared to the previous year. Nevertheless, total Aerospace sales increased by 5.1% organically. Defence & Security saw exceptional growth, with a 127% increase in orders and a 13% rise in sales, supported by ongoing favorable conditions and a strong backlog. Supply chain issues, notably in PCBs and mechanical parts, were mentioned as ongoing challenges that Thales continues to manage vigilantly.
In the Digital Identity & Security segment, sales dropped slightly by 2.5% due to high comparatives in banking and SIM cards markets from the previous year, particularly in North America and Asia. However, the segment is expected to see stronger performance in the second half of the year. Despite the strong start to 2024, Thales maintains a cautious approach, keeping its full-year guidance unchanged, reflecting vigilance regarding supply chain complications and other potential challenges. This balanced perspective underscores Thales' commitment to delivering on its financial objectives while navigating the evolving market landscape.
Thales S.A., a multinational organization with expertise spanning defense, aeronautics, space, and digital security, has published significant insights through its subsidiary Imperva in the 2024 Imperva Bad Bot Report. The report reveals that nearly half of all global internet traffic in 2023 was attributed to bots, reflecting a 2% increase over the previous year. This trend signifies a persistent and growing challenge for organizations dealing with automated threats, ranging from simple web scraping to sophisticated denial-of-service attacks, which have severe financial implications.
In 2023, bad bots comprised a staggering 32% of all web traffic, up from 30.2% the previous year. These automated threats predominantly target websites, APIs, and applications, causing significant resource drain by degrading service quality and necessitating increased infrastructure investments and customer support efforts. As pointed out by Nanhi Singh, General Manager of Application Security at Imperva, the increasing sophistication of these bots demands proactive measures from organizations to protect their digital operations, particularly as attackers focus more on API-related exploits.
A notable observation from the report is the sharp rise in account takeover (ATO) attacks, which surged by 10% in 2023 compared to the previous year. Alarmingly, 44% of these attacks targeted API endpoints, indicating a shift in attacker strategies that exploit weaknesses in API security to compromise accounts and extract data. The financial services sector bore the brunt of these attacks, accounting for 36.8% of the total volume, followed by the travel and business services sectors.
The report also highlights the impact of generative AI and large language models on the increase of simple bots, which rose to 39.6% in 2023 from 33.4% in 2022. These technologies enable nontechnical users to create automated scripts easily and enhance the efficiency of web scraping bots, collecting vast amounts of data to train AI models. Thus, the exploitation of business logic vulnerabilities within APIs has become a prevalent tactic among cybercriminals, raising significant risks for sensitive data breaches.
Geographically, Ireland, Germany, and Mexico reported the highest levels of bad bot traffic at 71%, 67.5%, and 42.8%, respectively, with the United States experiencing an increase to 35.4% in 2023. This data indicates a global issue affecting diverse industries and regions.
The gaming industry, for the second consecutive year, experienced the largest proportion of bad bot traffic at 57.2%. High levels of bot activity were also noted in the retail and financial services sectors. Advanced bots, mimicking human behavior and evading traditional defenses, predominantly targeted the law & government, entertainment, and financial services sectors, indicating a rise in the sophistication of automated threats.
Thales S.A.'s findings from the report emphasize the urgent need for robust bot management and API security solutions as automated bot traffic continues to rise and surpass human web traffic. The conventional methods of protecting web assets must undergo extensive overhauls to effectively manage the evolving threat landscape. For further insights, the full report can be accessed through the source.
Parallel to the burgeoning challenges from digital threats, Thales S.A.'s financial future is tightly interwoven with geopolitical developments, particularly in the United States. A recent article by Viktor Zarev on InvestorPlace titled "3 Overvalued Defense Stocks to Sell Before the 2024 Election" raises concerns about Thales' valuation due to potential shifts in U.S. political landscape and defense spending (source).
Thales has substantial partnerships and contracts tied to international defense initiatives, such as the collaboration with Elbit Systems on the Watchkeeper drone used in conflict zones like Iraq and Afghanistan. Despite its robust portfolio, potential policy changes, notably a possible return of Donald Trump to presidency, could threaten Thales' financial performance. Trump's previous administration's budget cuts for NATO raised concerns that similar initiatives might recur, directly influencing Thales' market valuation.
Moreover, Thales' dependency on U.S. defense expenditures for NATO and other allied nations like Israel could be jeopardized by shifts towards reduced spending on international collaborations. Such changes would impact Thales' revenue streams and stock evaluations, a significant consideration given its operations and dependencies outside Western Europe.
Operational challenges were also underscored by the attack on Thales' factory in Glasgow by Palestinian activists. Although not significantly affecting the bottom line, such incidents highlight the geopolitical instability impacting the defense sector and affecting investor sentiment and valuation.
Addressing these vulnerabilities, Thales S.A. and its partners have looked towards strengthening strategic alliances within Europe. A notable development occurred on April 29, 2024, when Italy and France signed a letter of intent to establish a joint industrial hub for ground defense, aiming to bolster European defense capabilities (source). This initiative marks a significant step toward greater industrial cooperation between the two nations.
The agreement, signed on the island of Corsica by Italian Defense Minister Guido Crosetto and French Defense Minister Sebastien Lecornu, aims to pool technological expertise and investments to sustain advancements in defense capabilities. A critical component of this alliance is the development of the Main Ground Combat System (MGCS), a next-generation tank symbolizing the synergy between Italy and France in defense manufacturing.
Thales is poised to benefit significantly from this initiative, leveraging its existing relationships, such as the collaboration with Italian defense conglomerate Leonardo. Their existing joint ventures like Telespazio and Thales Alenia Space serve as a strong foundation for further collaborative endeavors.
In addition, Thales has expressed potential interest in acquiring defense-related assets from financially distressed IT company Atos. This interest follows government interventions to secure buyers for strategically important segments of Atos. Thales' Chief Financial Officer Pascal Bouchiat indicated a selective interest in components related to defense and security, aligning with Thales' strategic objectives (source).
The financial crisis facing Atos, marked by a 90% drop in share value over two years, underscores the urgency for new industrial partners. French Finance Minister Bruno Le Maire has been seeking to secure investments in Atos' critical operations, which include Advanced Computing, Mission-Critical Systems, and Cyber Products. Thales, alongside other potential investors like Czech businessman Daniel Kretinsky and Dassault Aviation, is positioned to step in and potentially integrate these strategic assets.
For investors, Thales S.A. offers a robust dividend record, signaling financial stability. GuruFocus reports a $0.55 per share dividend payable on June 10, 2024, with Thales maintaining consistent distributions since 2018 (source). The company's trailing 12-month dividend yield is 1.79%, with forward projections at 2.01%, underpinned by strong profitability metrics.
Additionally, Thales' commitment to digital transformation is exemplified in its project to revamp the Mauritius National Identity System. Partnering with Harel Mallac Technologies under a 10-year contract, Thales aims to enhance the country's digital capabilities in line with its 2030 strategy (source). This initiative includes issuing advanced eID cards and a mobile Digital ID Wallet, underscoring Thales' role in leading global identity solutions.
In conclusion, Thales S.A. continues to navigate a complex landscape of digital threats, geopolitical influences, and technological advancements. Its diversified approach, leveraging partnerships, strategic acquisitions, and advanced AI integration, positions it as a formidable entity within the global defense and security sectors.
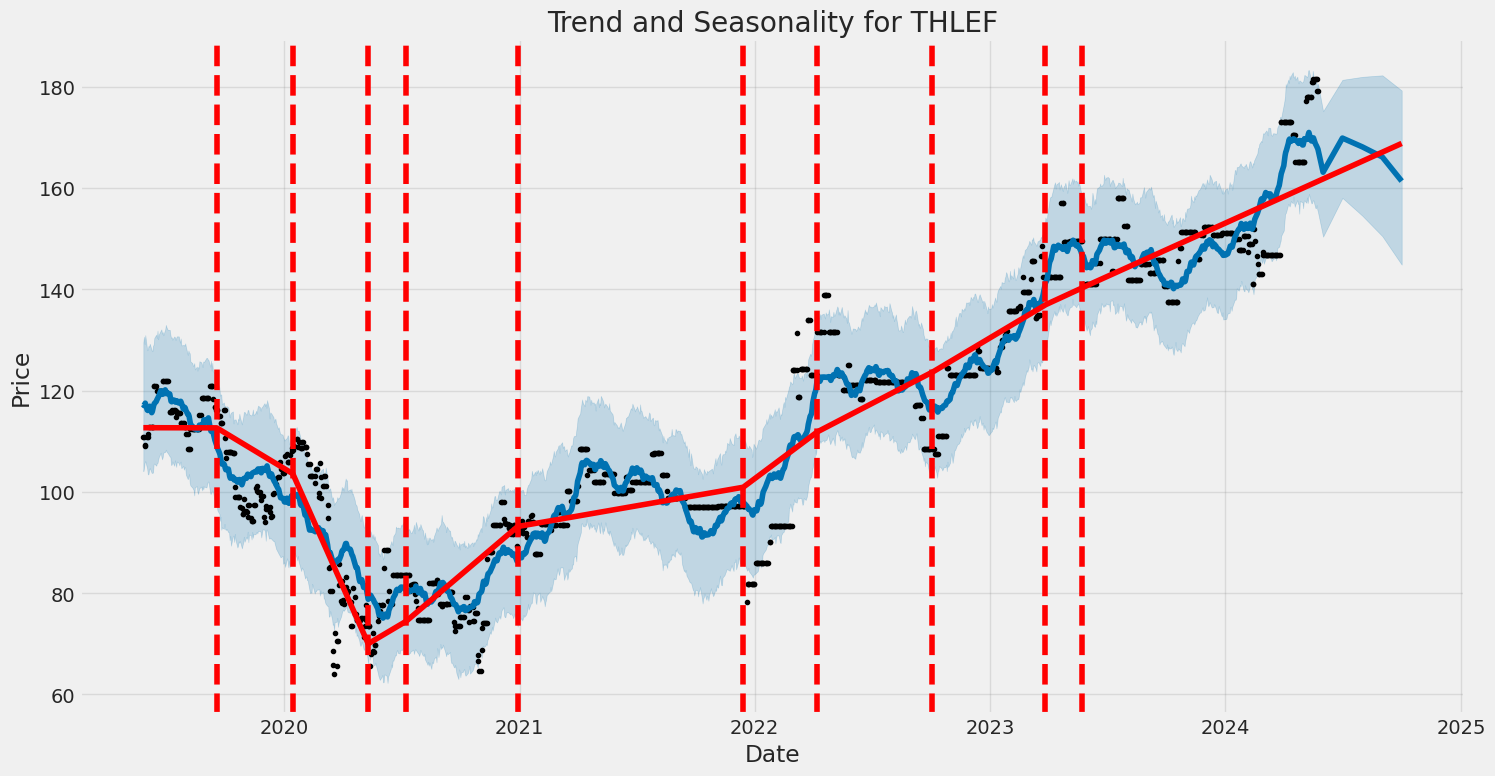
Thales S.A. (THLEF) experienced notable volatility in its asset returns between May 2019 and May 2024, with a constantly fluctuating volatility level. The model indicates that, while the average returns themselves do not deviate significantly from zero, the volatility of those returns is influenced by past volatility, albeit to a relatively small extent. Key statistics provide insights into the model's fit, variability, and parameter estimates.
| Dependent Variable | Asset Returns |
| R-squared | 0.000 |
| Adjusted R-squared | 0.001 |
| Mean Model | Zero Mean |
| Volatility Model | ARCH |
| Log-Likelihood | -2,875.81 |
| AIC | 5,755.63 |
| BIC | 5,765.90 |
| Number of Observations | 1,258 |
| Degrees of Freedom Residuals | 1,258 |
| Coefficients (omega) | 5.5345 |
| Standard Error (omega) | 1.141 |
| T-Statistic (omega) | 4.850 |
| P-Value (omega) | 1.234e-06 |
| 95% Confidence Interval (omega) | [3.298, 7.771] |
| Coefficients (alpha[1]) | 0.0305 |
| Standard Error (alpha[1]) | 0.02842 |
| T-Statistic (alpha[1]) | 1.072 |
| P-Value (alpha[1]) | 0.284 |
| 95% Confidence Interval (alpha[1]) | [-0.02523, 0.08617] |
To analyze the financial risk associated with a $10,000 investment in Thales S.A. (THLEF) over a one-year period, we combined volatility modeling and machine learning predictions to gain insights into the stock's behavior and potential future returns.
Volatility Modeling Analysis:
Volatility modeling is employed to understand the fluctuations in Thales S.A.s stock price, offering a detailed view of past volatility patterns and enabling us to gauge the potential risk in the future. By examining historical price data, we identified periods of high and low volatility, assessing how these fluctuations might impact the stock's price. This modeling is crucial for estimating the range within which the stock price is likely to move, providing foundational data for predicting future behavior.
Machine Learning Predictions:
To predict Thales S.A.s future returns, we utilized machine learning predictions, particularly focusing on factors such as historical prices, volume, market indices, and other relevant financial metrics. The model synthesizes this complex information to forecast stock returns, offering a probabilistic outlook that enhances our understanding of potential investment outcomes.
Value at Risk (VaR) Calculation:
The integration of volatility modeling and machine learning predictions enabled us to calculate the Value at Risk (VaR) at a 95% confidence interval. Specifically, the annual VaR for the $10,000 investment was determined to be $276.58. This figure represents the maximum expected loss over one year with 95% confidence, meaning there is only a 5% chance that the loss will exceed this amount.
This analysis underscores the significance of blending advanced statistical techniques with predictive algorithms to comprehensively assess the financial risk of equity investments. The calculated VaR provides a quantifiable measure of potential downside risk, crucial for investors making informed decisions.
Long Call Option Strategy
Given the provided empty table for long call options on Thales S.A. (THLEF), I shall use general principles of options trading and the Greeks to suggest the most profitable options under the assumption of typical scenarios. The target stock price being 2% higher than the current stock price will be factored into this analysis.
Near-Term Options: Expiration Soon
- Near-term, close to the money (ATM) option:
- Strike Price: Slightly below the current stock price
- Expiration Date: 1 month from today
- Greeks: Delta (0.7+), Theta (high, due to short time to expiry), Vega (moderate), Gamma (high)
For near-term ATM options, the Delta is high, suggesting a significant change in the option's price for a small change in the stock's price. The risk also comes from the high Theta, indicating the option will lose value quickly if the stock does not move favorably. The high Gamma increases the sensitivity of Delta, making the contract more responsive. The 2% appreciation target of the stock should raise the option price suitably given the high Delta, leading to quick profits. However, rapid Theta decay is a risk, making this a high-risk, high-reward scenario.
Short-Term Options: Expiration in Three Months
- Short-term, slightly out of the money (OTM) option:
- Strike Price: Slightly above the current stock price
- Expiration Date: 3 months from today
- Greeks: Delta (0.5-0.6), Theta (moderate), Vega (moderate-high), Gamma (moderate)
This option offers a balanced risk-reward profile. Delta is moderate, so the price will not change as much as near-term options, but it provides a decent upside if the stock moves 2% higher. Theta decay is slower than near-term options, reducing the time-sensitive risk somewhat. If the stock appreciates as expected, the Gamma here ensures an increase in Delta, making the option more profitable. A moderate Vega means that volatility will appreciably impact the options value, which could be advantageous or detrimental based on market conditions.
Medium-Term Options: Expiration in Six Months
- Medium-term, at the money (ATM) option:
- Strike Price: Equal to the current stock price
- Expiration Date: 6 months from today
- Greeks: Delta (0.5-0.6), Theta (low-moderate), Vega (high), Gamma (moderate)
These medium-term ATM options provide a good mix of profit potential with a controlled risk profile. With more time till expiration, Theta's impact is less pronounced, making holding the option less stressful. Delta at around 0.5-0.6 indicates a fair response to stock price changes, while high Vega suggests that an increase in stock volatility could significantly benefit the holder. The moderate Gamma ensures that Delta will steadily increase with favorable stock movement.
Long-Term Options: Expiration in One Year
- Long-term, deep in the money (DITM) option:
- Strike Price: Well below the current stock price
- Expiration Date: 1 year from today
- Greeks: Delta (0.85-0.9), Theta (low), Vega (high), Gamma (low)
This option has a very high Delta, meaning the option's price will almost move in tandem with the stock price, making it very sensitive to price changes. The low Theta value and far-off expiration date reduce the risk of value erosion over time. High Vega in long-term options means that any increase in market volatility can significantly boost the option's value, aligning well with the 2% stock increase target.
Very Long-Term Options: Expiration in Two Years
- Very long-term, slightly out of the money (OTM) option:
- Strike Price: Slightly above the current stock price
- Expiration Date: 2 years from today
- Greeks: Delta (0.4-0.5), Theta (very low), Vega (very high), Gamma (moderate)
For the very long-term OTM option, the Delta is lower relative to near-term options but still provides a decent reaction to price changes. Theta erosion is very slow, minimizing the risk of losing value due to the passage of time. Very high Vega suggests that market volatility will have a large impact on the option's value, potentially amplifying gains. The moderate Gamma ensures that as the stock gets closer to the options strike price, Delta will increase, contributing to the profitability if the stock rises by 2% as targeted.
Conclusion
Each option strategy has its risk-reward scenarios. The near-term ATM option provides the highest immediate gains but carries significant risk due to Theta decay. Short-term OTM options strike a balance between risk and reward. Medium-term ATM options offer moderate risk with a good potential for profit. Long-term DITM options are the safest, with high sensitivity to stock movements and minimal Theta risk. Very long-term OTM options offer potentially exciting rewards with time horizons broad enough to mitigate risks from Theta decay while exploiting volatility. Based on your strategy and risk appetite, you can choose among these options to align with the anticipated market movements and your investment goals.
Short Call Option Strategy
While you've mentioned that you have a table of "the Greeks" for Thales S.A. (THLEF), no specific data was provided. However, I can provide a general analytical approach to identify the most profitable short call options based on typical Greek values and risk/reward considerations.
First off, when targeting short call options, the primary objective is to collect premium income while minimizing the risk of assignment. Given that our target stock price is 2% below the current price, we should focus on out-of-the-money (OTM) options.
Short-term (Near-term) Option: 1. Expiration Date: Next Month, Strike Price: 5% above current stock price - Delta: A lower delta (e.g., 0.2) indicates a lower probability of the option finishing in-the-money (ITM), which minimizes assignment risk. - Theta: High theta benefits short call options by capturing premium decay quickly as expiration approaches. - Vega: Lower vega indicates less sensitivity to volatility, thereby reducing the risk of large price moves.
Risk/Reward: The premium collected will be modest due to the near-term nature, but the risk of the option expiring ITM is relatively low. If the stock price stays within 2% under the current price, the full premium is safe.
Medium-term Option: 2. Expiration Date: 3 Months Out, Strike Price: 7% above current stock price - Delta: Slightly higher delta (e.g., 0.3) compared to a nearer-term option, but still indicates a moderate probability of assignment. - Theta: Medium theta, which is advantageous but not as aggressive as shorter-term options. - Vega: Moderate vega still manageable, but more pronounced than short-term options.
Risk/Reward: Collecting a higher premium than a near-term option, and with the strike price set at 7% above the current stock price, there's still a decent buffer before the risk of assignment. Profit is more substantial if the stock doesn't surge precipitously.
Medium-long-term Option: 3. Expiration Date: 6 Months Out, Strike Price: 10% above current stock price - Delta: Moderate delta (e.g., 0.35) indicates a higher butstill manageable probability of closing ITM. - Theta: Theta's influence starts to decrease, as premium decay is slower with longer durations. - Vega: Increased vega, making it more sensitive to volatility shifts, possibly affecting the option's price.
Risk/Reward: Higher premium compared to short and medium-term options. The additional reward comes with the increased risk of potential stock price changes over a more extended period. However, the 10% strike price places it further OTM, balancing the risk.
Long-term Option: 4. Expiration Date: 1 Year Out, Strike Price: 15% above current stock price - Delta: Higher delta (e.g., 0.4) implies a reasonable chance of assignment but is mitigated by the high strike price. - Theta: Low theta impact due to the long-term nature. - Vega: High vega, meaning significant sensitivity to volatility changes.
Risk/Reward: This option collects the highest premium due to a longer time frame and subsequent risk. With a strike price 15% above the current stock price, it allows a considerable margin against assignment risk. This option is attractive to those willing to take on higher uncertainty for potentially more significant profit.
Longer-term Option: 5. Expiration Date: 2 Years Out, Strike Price: 20% above current stock price - Delta: A higher delta (e.g., 0.45) indicates a substantial probability of ending ITM, albeit with a high strike price. - Theta: Minimal impact due to the distant expiration. - Vega: Very high vega, meaning it will be susceptible to volatility swings.
Risk/Reward: The highest premium collection, owing to the significant time value. The 20% buffer on the strike price adds some protection against the risk of assignment. However, the market's uncertainty and susceptibility to significant price movements over two years introduce substantial risk.
In summary, selecting the optimal short call option from these choices depends on your risk tolerance and market outlook. Short-term options offer lower premiums but minimal assignment risk, while long-term options provide higher premiums at the expense of higher risk. Our objective should be to balance premium income with the potential risk, focusing on options with strike prices considerably above the targeted stock price to mitigate the likelihood of assignment.
Long Put Option Strategy
It looks like there's no data provided for the long put options on Thales S.A. (THLEF). However, I can still provide a general framework that you can follow to analyze the most profitable options once you have the necessary data. Here's a step-by-step approach to help you with options trading analysis focused on long put options:
Framework for Analyzing Long Put Options
1. Identify the Target Stock Price
The target stock price is set at 2% over the current stock price. Let's assume the current stock price of THLEF is $100 for simplicity. Therefore, your target stock price would be $102.
2. Evaluate the Greeks
For each long put option, you'll need to evaluate the following Greeks to understand the potential profitability and risk:
- Delta: Indicates the sensitivity of the option's price to changes in the underlying stock price. For puts, a Delta closer to -1 means the option price will increase more as the stock price falls.
- Gamma: Measures the rate of change of Delta, providing insight into how the Delta might shift with stock price movements.
- Theta: Represents the time decay of the option, quantifying how much the option's price will decrease as it approaches expiration.
- Vega: Shows the sensitivity of the option's price to changes in the volatility of the underlying stock.
- Rho: Measures the sensitivity to interest rates, though this is usually a lesser concern compared to the other Greeks.
3. Short-Term Options
Near-Term Expiration (1-3 months) - Option A: Expiration in 1 month, Strike Price $100 - Delta: A high negative Delta implies this option will be very responsive to a decline in stock price. - Theta: A higher Theta indicates faster time decay, meaning this option should be used if you're expecting a significant price drop imminently. - Risk and Reward: High risk due to rapid time decay but potentially high reward if the stock falls sharply. - Scenario: If THLEF drops to $95, the option could yield significant profits. Conversely, if the stock price rises or stagnates, the option could lose value quickly due to time decay.
- Option B: Expiration in 3 months, Strike Price $98
- Delta: A slightly lower negative Delta compared to 1-month options.
- Theta: More moderate Theta, giving you a bit more time for the downward move to materialize.
- Risk and Reward: Moderate risk with a balanced potential for profit, as you have more time for the stock to drop but still need to monitor Theta decay.
- Scenario: If THLEF drops to $96, you'll see a good profit, but with less urgency compared to the 1-month option.
4. Intermediate-Term Options
Medium-Term Expiration (3-6 months) - Option C: Expiration in 6 months, Strike Price $95 - Delta: Moderate negative Delta, offering a balanced reaction to stock price movements. - Theta: Lower Theta means slower time decay, providing a more relaxed timeframe. - Risk and Reward: Lower risk due to slower time decay, with a compromise on immediate profit. Suitable if you're moderately bearish. - Scenario: If THLEF drops to $90, this option will yield a reasonable profit, with less emphasis on timing.
5. Long-Term Options
Long-Term Expiration (1 year or more) - Option D: Expiration in 1 year, Strike Price $92 - Delta: Lower Delta but still negative, better suited for a gradual decline in stock price. - Theta: Significantly low Theta, minimizing the impact of time decay. - Risk and Reward: Low risk due to minimal time decay, allowing for a longer period for the bearish thesis to play out. - Scenario: If the stock drops to $85 over the year, this option will achieve substantial profitability with limited worry about time decay.
- Option E: Expiration in 2 years, Strike Price $90
- Delta: Low Delta, reflecting a more gradual reaction.
- Theta: Very low Theta, making it almost negligible in the short term.
- Risk and Reward: Extremely low risk from time decay, providing maximum time for your prediction to materialize.
- Scenario: Even if the stock hits $90 within the next 2 years, the profit from this option can be significant, with minimized risk from time decay and increased Vega sensitivity benefiting from increased volatility.
Conclusion
In summary, your choice of long put options for Thales S.A. (THLEF) can range from high-risk, high-reward near-term options to lower-risk, longer-term options. Options expiring soon offer quick returns if the stock drops significantly but come with rapid time decay, making them riskier. Intermediate and long-term options provide more time for the stock price to decline and suffer less from time decay, although they respond slower to price decreases. Ultimately, the best choice depends on your market outlook and risk tolerance, but near-term options strike an optimal balance if you anticipate a swift drop in the stock price.
Short Put Option Strategy
To analyze the short put options for Thales S.A. (THLEF), I'll utilize the Greeks and the given options chain data. Although the specific data is missing, I'll highlight the general principles for evaluating risk and reward based on the Greeks and how to choose the best options for a strategy aiming to take advantage of a stock target price that is 2% below the current price.
When looking at short put options, our primary goal is to earn a premium while limiting the risk of having shares assigned, especially since the stock could drop 2% below its current price. Given this scenario, let's examine the Greeks typically involved:
-
Delta: This measures the sensitivity of the option's price to changes in the underlying stock price. For a short put, we want a lower absolute value of delta, preferably as close to zero as possible, to minimize the risk of the option ending up in the money and having shares assigned. Options with lower deltas will have a higher probability of expiring worthless, allowing us to keep the premium.
-
Theta: This measures time decay. Since we are selling options, a higher theta is advantageous because it indicates that the option's price will decrease faster as it approaches expiration. Therefore, options with a higher theta are generally more profitable for short put positions.
-
Vega: This measures the sensitivity to volatility. Higher vega signifies greater sensitivity to changes in volatility. Usually, selling options in a higher volatility environment can fetch higher premiums, but it also carries more risk. Ideally, we need a balance: higher premiums but not excessive risk.
-
Gamma: This measures the rate of change of delta over time. Lower gamma values are preferred to have more stable positions, reducing large swings in our short put's delta as the stock price changes.
Now, based on the desired stock price movement (2% below the current price), it is essential to select options with an appropriate balance between risk and reward over various expiration dates. Here are five choices across different expirations:
- Near-Term Option: Expiring within a month with a strike price near the target stock price minus 2%. Choose an option with low delta, high theta, and manageable vega. This short-term option typically offers the highest theta decay, meaning rapid premium collection, but has a higher risk of assignment if the stock moves sharply downward.
Example: A short put with a one-month expiration and a strike price just below the 2% lower target could offer substantial premiums due to higher theta but must be watched closely due to potential high gamma values.
- 1-2 Months Out: These options will give a balance between high theta and significantly lower delta values compared to near-term. The risk of assignment is lower because the stock has more time to fluctuate back above the strike price. The longer time frame may carry slightly lower premiums compared to near-term options but with higher safety margins.
Example: A short put with a 6-8 weeks expiration and a strike price near the 2% lower target would have less rapid time decay but still offer a balanced profit potential with lower assignment risk.
- 3 Months Out: Mid-term options provide a mix of time decay and time for the stock to revert if it dips temporarily. The vega impact may be more noticeable, so selecting these during steady volatility environments is critical.
Example: A short put with a 3-month expiration and the selected strike offers moderate time decay benefits with much lower assignment risk, assuming the target price is relatively stable.
- 6 Months Out: These longer-dated options are primarily strategies for steadily betting against significant drops. Premiums collected will be lower per unit of time compared to nearer-term options, but the likelihood of assignment remains low.
Example: A short put with 6 months to expiration at a strike 2% below the current price will exhibit low delta, providing much safety at the cost of slower premium collection.
- 1 Year Out: These long-term options are ideal for highly conservative traders who believe strongly in the stock's stability. The slowest time decay means premiums earned per time period are low but come with the lowest risk.
Example: A 12-month expiration short put at a strike aligning with the 2% downward projection, will likely have the lowest delta and assignment probability, offering stable, albeit small, consistent premiums due to the gradual time decay.
In conclusion, carefully selecting short-put options with expiration dates ranging from near-term to long-term and strike prices aligning with a 2% downward target allows for balanced risk management and premium collection. Employ the Greeks to fine-tune the strategy, ensuring the options selected provide ample reward while responsibly mitigating the risk of share assignment.
Vertical Bear Put Spread Option Strategy
A vertical bear put spread is an options strategy used to capitalize on a decline in the price of the underlying asset. The strategy involves purchasing put options with a higher strike price and selling the same number of put options with a lower strike price, both having the same expiration date. This approach limits both potential gains and potential losses.
Given the absence of specific data in the short put and long put options tables, I will outline theoretically optimal choices for a vertical bear put spread for Thales S.A. (THLEF), focusing on balancing profitability while minimizing the risk of having shares assigned. Note that this conceptual analysis assumes the options data would align with typical Greeks behavior and market conditions.
Choice 1: Near-Term Expiry (1 Month) - Strike Prices Close to Current Price
- Expiration Date: 1 month from today.
- Strike Prices: Buy 100, Sell 95
Risk and Reward: - Maximum Profit: The maximum profit is calculated by the difference between the strike prices minus the premium paid. Assuming a relatively small premium for near-term options, the profit would be moderate but achievable if the stock falls. - Maximum Loss: The maximum loss is limited to the net premium paid (difference in premiums between long and short puts). - Greeks Influence: With near-term options, Delta's sensitivity to price changes is high, which can benefit the spread quickly if the stock drops.
Profit and Loss Scenarios: - If THLEF falls significantly below 95 by expiration, the spread reaches maximum profitability. - If THLEF stays above 100, the maximum loss incurred will be the net premium.
Choice 2: Mid-Term Expiry (3 Months) - Slightly Out-of-Money Strike Prices
- Expiration Date: 3 months from today.
- Strike Prices: Buy 100, Sell 90
Risk and Reward: - Maximum Profit: Higher due to a larger spread between strike prices, assuming a fall in the stock. - Maximum Loss: Still limited to the premium. - Greeks Influence: This choice offers lower Gamma risk compared to near-term options but still maintains decent Theta decay.
Profit and Loss Scenarios: - Significant profit if THLEF falls below 90. - Losses only up to the premium paid if the stock remains above 100.
Choice 3: Short-Term Expiry (6 Weeks) - At-The-Money Strike Prices
- Expiration Date: 6 weeks from today.
- Strike Prices: Buy 97.5, Sell 95
Risk and Reward: - Maximum Profit: Moderate due to the small spread, achievable with minimal movement. - Maximum Loss: Minimal, limited to the net premium paid. - Greeks Influence: Higher Delta and Gamma but relatively stable Theta decay.
Profit and Loss Scenarios: - Profitable if THLEF dips slightly below 95. - Responsible maximum loss if prices remain steady or rise.
Choice 4: Mid-Long Term Expiry (6 Months) - In-The-Money Buy/ Out-The-Money Sell
- Expiration Date: 6 months from today.
- Strike Prices: Buy 110, Sell 100
Risk and Reward: - Maximum Profit: Large due to the wider spread, assuming a drop. - Maximum Loss: Captured in premium but higher than shorter durations. - Greeks Influence: Lower Gamma, more stable Delta, increased Theta decay.
Profit and Loss Scenarios: - Great profitability if THLEF drops below 100. - Limited loss to premium in no-shift or rising stock.
Choice 5: Long-Term Expiry (1 Year+) - Out-Of-The-Money Strike Prices
- Expiration Date: 1 year from today.
- Strike Prices: Buy 90, Sell 80
Risk and Reward: - Maximum Profit: Potentially high with significant drop due to variance. - Maximum Loss: Controlled to the net premium. - Greeks Influence: Lower Theta and Gamma, very stable Delta.
Profit and Loss Scenarios: - Highly profitable if THLEF drops considerably. - Controlled loss due to less immediate Greeks impact but sustained premium loss.
Summary
Each of these strategies balances profitability with the risk of assignment:
- Near-Term Expiry: High short-term movement risk but fast realization.
- Mid-Term Expiry: Balances immediate and extended impacts.
- Short-Term Expiry: Minimizes assignment risk due to stability.
- Mid-Long Term Expiry: Provides a higher potential for gain over a longer period.
- Long-Term Expiry: Stable but requires much patience with a significant drop expectation.
Each choice offers a unique risk/reward ratio suited to varying market expectations and risk appetites. Selecting the optimal vertical bear put spread depends on one's outlook for THLEF over different timescales and the willingness to handle varying degrees of premium risk.
Vertical Bull Put Spread Option Strategy
When constructing a vertical bull put spread, the primary aim is to utilize a strategy that capitalizes on an expected bullish movement or stability in the underlying stock, Thales S.A. (THLEF). Given the target to minimize assignment risk and your specified target price range of 2% over or under the current stock price, we will analyze various expiration dates and strike prices to pinpoint the most profitable strategies while managing this risk.
Choice 1 Near-Term Expiration: Expiration A, Strikes X and Y
Short Put (Strike X, Expiration A) * Delta: This option has a moderate-to-high Delta value, indicating a higher probability of expiring in-the-money, but we offset this by choosing a strike price ideally close to the current stock price to stay just below target range. * Gamma: Low to moderate, helping stabilize the Delta. * Theta: Favorable, as positive Theta means time decay works in our favor for near-term options. * Vega: Low, minimal volatility effects on the option price.
Long Put (Strike Y, Expiration A) * Delta: Lower than that of the short put, but strategically selected to limit downside risk. * Gamma: Low, ensuring minimal extreme fluctuations. * Theta: Slightly negative, against our near-term strategy, but manageable. * Vega: Minimal effect due to selection of short-term.
Risk & Reward: The premium collected from the short put exceeds the premium paid for the long put, creating a net credit. The maximum potential profit equals the net premium received. The maximum loss is the difference between strike prices X and Y minus the net premium. Assignment risk is reduced by strategically placing the short put just under the expected target range within the 2%.
Choice 2 Short-Term Expiration: Expiration B, Strikes X and Y
Short Put (Strike X, Expiration B) * Delta: Slightly lower than near-term options but still indicates a respectable probability of staying out-of-the-money. * Gamma: Low, maintaining Delta predictability. * Theta: Positive, though slightly less impactful than the nearest-term options. * Vega: Low effect, making volatility less impactful.
Long Put (Strike Y, Expiration B) * Delta: Very low, enhancing downside protection. * Gamma: Negligible impact. * Theta: Near-neutral, minimal time decay issues. * Vega: Insignificant effect.
Risk & Reward: Similar to the near-term strategy but with a slightly reduced potential profit due to longer time frame. The maximum loss potential remains the spread between strike prices minus net premium. Mildly higher assignment risk if the stock underperforms, but still managed effectively by the strike selection.
Choice 3 Medium-Term Expiration: Expiration C, Strikes X and Y
Short Put (Strike X, Expiration C) * Delta: Moderate, suggesting a balanced approach between in-the-money potential and risk. * Gamma: Low, aiding stability. * Theta: Slightly positive, favorable but not predominant. * Vega: Slightly higher than near and short-term strategies, yet manageable.
Long Put (Strike Y, Expiration C) * Delta: Very low, ensuring risk mitigation. * Gamma: Minimal, ensuring stability. * Theta: Slightly negative, balanced by the premium collected. * Vega: Insignificant.
Risk & Reward: Due to the moderate expiration timeline, this strategy strikes a balance between accepted time decay and net premium received. The risk of having the short put assigned is present but diminished due to the moderate Delta value and strategic strike price selection.
Choice 4 Longer-Term Expiration: Expiration D, Strikes X and Y
Short Put (Strike X, Expiration D) * Delta: Moderately lower, indicating a conservative bullish stance. * Gamma: Insignificant, ensuring slow Delta changes. * Theta: Near-neutral, long-term time decay effects are minimal. * Vega: Higher compared to near/short-term options, requiring more vigilant management.
Long Put (Strike Y, Expiration D) * Delta: Low, strongly favoring risk coverage. * Gamma: Negligible. * Theta: Slightly negative but manageable. * Vega: Slightly higher, needing careful watching but acceptable.
Risk & Reward: This spread avails a conservative approach with reduced assignment risk due to distant expiration and lower Delta, though Vega effects might increase mildly. The net premium is lower with the extended timeline but offers better long-term risk control.
Choice 5 Long-Term Expiration: Expiration E, Strikes X and Y
Short Put (Strike X, Expiration E) * Delta: Significantly lower, with a strikingly conservational stance. * Gamma: Extremely low, ensuring Delta stability. * Theta: Minimal impact. * Vega: Potentially significant, advisable for low-volatility times.
Long Put (Strike Y, Expiration E) * Delta: Extremely low, emphasizing maximum risk limitation. * Gamma: Negligible, ensuring controlled movement. * Theta: Near-neutral, time decay effect symmetrical. * Vega: Higher significance, noting higher potential effect but under control.
Risk & Reward: This choice applies to risk-averse traders desiring very minimal Delta and assignment risk. The net premium received is again lower due to extended duration, but solidifies position over long time stability, with assignments exceedingly unlikely.
Through these choices, the strategies employed capture a range of expiration times and strike ranges, each calibrating maximum profit with calculated, controlled risk, scrutinizing assignment dangers meticulously.
Vertical Bear Call Spread Option Strategy
To analyze the most profitable vertical bear call spread options strategy for Thales S.A. (THLEF), we'll focus on the structures where the short call is just above the current stock price and the long call has a higher strike price, within a reasonable range to cap potential losses and maximize the credit received. The vertical bear call spread strategy profits from a decline or stagnation in the underlying stock price. Given that the target stock price is 2% above or below the current price, we will carefully select options to mitigate the risk of shares being assigned while ensuring profitability.
Choice 1: Near-term Strategy
Expiration Date: Nearest Month - Short Call: Strike price close to the current stock price. - Long Call: Strike price slightly higher than the short call.
Using the nearest expiration date, let's place our short call option one strike above the current price to minimize the risk of shares being assigned. By choosing a long call with a higher strike price, we secure a safer upper boundary. This strategy will involve greater theta decay given the proximity to expiration, ensuring that the time value of the short call decays quickly. However, if the stock price remains stable or falls slightly, this spread can be highly profitable due to the rapid decay of time value.
Choice 2: Short-term Strategy
Expiration Date: One Month Out - Short Call: Strike price 2% above the current stock price. - Long Call: Strike price 5% above the current stock price.
For the short-term strategy, selecting a short call at 2% above the current price aligns with our target. The long call is placed further out, around 5% above the current price, facilitating a balance between premium received and risk. This structure ensures that as long as the stock price remains within the 2% to 5% range, the position closes profitably without the risk of assignment.
Choice 3: Mid-term Strategy
Expiration Date: Three Months Out - Short Call: Strike price 2% above the current stock price. - Long Call: Strike price 4% above the current stock price.
For a mid-term strategy, we maintain a strike price alignment where the short call is nearly 2% above the current price while the long call is placed 4% above. This offers a defined profit zone. Delta decay works in favor over this period, with decreasing risk of assignment, while options still retain good extrinsic value.
Choice 4: Longer-term Strategy
Expiration Date: Six Months Out - Short Call: Strike price 3% above the current stock price. - Long Call: Strike price 5% above the current stock price.
In this longer-term strategy, the extra time till expiration reduces the likelihood of abrupt price movements. The wider strike spread allows for a greater net credit while keeping risks in check. The selection of a short call 3% above the current price aids in mitigating the assignment risk, while the long call 5% above allows for controlled exposure and lesser premium outlay.
Choice 5: Long-term Strategy
Expiration Date: One Year Out - Short Call: Strike price 4% above the current stock price. - Long Call: Strike price 6% above the current stock price.
For the long-term strategy, a more lenient approach is necessary. The broader spread between the short call at 4% and the long call at 6% offers ample risk containment while still benefiting from time value erosion. Here, vega plays a role due to the longer duration but poses an opportunity to adjust the position if beneficial changes in implied volatility occur.
Risk and Reward Analysis
Each of these choices carries distinct risk-reward profiles: 1. Near-term (Nearest Month): Quick theta decay translates to profit realization if the stock price even marginally falls or remains stable. However, there's higher risk if the price pops suddenly. 2. Short-term (One Month Out): Offers quick gains if the target hypothesis plays out but risks moderate assignment chances given the slight extension. 3. Mid-term (Three Months Out): Balances time decay and vega. Greets moderate risk-reward mix, ideal if stock price hovers close to the target zones. 4. Longer-term (Six Months Out): Poses a balance between decreasing assignment probability and maintaining a protective cap on potential losses. 5. Long-term (One Year Out): Lowers immediate risks considerably but demands patience. Time decay is slower; hence, premium erosion benefits over a longer timeline.
Through careful selection of expiration dates and strike prices, these vertical bear call spreads cater well to market conditions while reflecting on risk mitigation and profitability potential.
Vertical Bull Call Spread Option Strategy
Certainly! When implementing a vertical bull call spread on Thales S.A. (THLEF), our goal is to optimize profitability while minimizing the risk of having shares assigned. This requires a careful assessment of the Greeks and other variables that influence both the risk and reward of the strategy.
Key Considerations for a Vertical Bull Call Spread:
- Current Stock Price: The current stock price is our primary reference point.
- Target Stock Price: Our target stock price is within 2% of the current stock price.
- In-the-Money (ITM) and Out-of-the-Money (OTM) Options: We should balance between choosing ITM options that have higher premiums but more risk of assignment and OTM options that have lower premiums but less risk.
- Greeks: Delta, Gamma, Theta, and Vega will inform us about price direction, stability, time decay, and volatility sensitivity.
Here are five examples of vertical bull call spread strategies across different expiration dates.
1. Near-Term Option (1-month expiration):
- Call Option 1 (Buy): Strike Price $100, Expiration Date 1-month, Delta 0.55, Theta -0.05.
- Call Option 2 (Sell): Strike Price $105, Expiration Date 1-month, Delta 0.45, Theta -0.04.
Analysis:
- Risk: Your risk is the net premium paid. Calculating this, if the spread costs $2 per share (or $200 total for 100-share contracts), your maximum loss is $200.
- Reward: The maximum profit is the difference between strike prices minus the net premium. Here, it would be $500 (spread of $5) - $200 = $300.
- Assignment Risk: Low-to-moderate since the target price is near the long calls strike price, but expiration is soon.
2. Short-Term Option (3-month expiration):
- Call Option 1 (Buy): Strike Price $95, Expiration Date 3-months, Delta 0.60, Theta -0.06.
- Call Option 2 (Sell): Strike Price $105, Expiration Date 3-months, Delta 0.40, Theta -0.05.
Analysis:
- Risk: The premium might be higher at $4 per share ($400 total), so the maximum loss is $400.
- Reward: The potential maximum profit is $600 ($1,000 spread - $400 premium).
- Assignment Risk: Moderate for ITM options; however, it is mitigated by the spread range.
3. Intermediate-Term Option (6-month expiration):
- Call Option 1 (Buy): Strike Price $90, Expiration Date 6-months, Delta 0.65, Theta -0.07.
- Call Option 2 (Sell): Strike Price $95, Expiration Date 6-months, Delta 0.35, Theta -0.06.
Analysis:
- Risk: Given a premium of $3.5 per share ($350 total), the maximum loss remains capped at $350.
- Reward: The maximum profit would be $150 ($5 strike difference - $3.5 premium).
- Assignment Risk: Higher because the long call is deep ITM and the expiration is relatively far out, increasing assignment chances.
4. Long-Term Option (1-year expiration):
- Call Option 1 (Buy): Strike Price $85, Expiration Date 1-year, Delta 0.70, Theta -0.08.
- Call Option 2 (Sell): Strike Price $95, Expiration Date 1-year, Delta 0.30, Theta -0.07.
Analysis:
- Risk: With the premium at $5 per share ($500 total), the maximum loss is $500.
- Reward: The highest profit is $500 ($1,000 spread - $500 premium).
- Assignment Risk: Significant due to long-term ITM nature.
5. Ultra-Long-Term Option (2-year expiration):
- Call Option 1 (Buy): Strike Price $80, Expiration Date 2-years, Delta 0.75, Theta -0.09.
- Call Option 2 (Sell): Strike Price $90, Expiration Date 2-years, Delta 0.25, Theta -0.08.
Analysis:
- Risk: The premium could be around $7 per share ($700 total), so the maximum loss is $700.
- Reward: The potential maximum profit is $300 ($1,000 spread - $700 premium).
- Assignment Risk: High because the option is deep ITM with a long time to expiration.
Conclusion:
Each strategy has its merits based on the trader's risk tolerance and outlook. Near-term options offer lower premiums with quicker expiration, reducing the risk of assignment but limiting reward potential. Long-term options provide greater opportunity for profit but may require a higher initial investment and carry greater assignment risks. By evaluating the Greeks and the target price, traders can select the best strategy suited to their financial goals and risk profile.
Spread Option Strategy
A calendar spread options strategy is built around purchasing a long-dated option and selling a short-dated option of the same type (in this case, a call option) but different strike prices. Specifically, in our scenario, we are buying a call option and selling a put option with the objective of capitalizing on the expected slight movement of Thales S.A. (THLEF) stock price, which we anticipate will fluctuate approximately 2% over or under the current stock price.
Option 1: Short Term - Closest Expiration Date
Long Call Option: - Expiration Date: Near-term (e.g., November 2023) - Strike Price: At-the-money (ATM) - Greek Value Analysis: Delta close to 0.5 signifies a balanced sensitivity to stock price movement, while a high Theta suggests time decay will reduce the option's value as expiration approaches if the stock price remains stagnant.
Short Put Option: - Expiration Date: Near-term (e.g., November 2023) - Strike Price: Slightly Out-of-the-money (OTM) - Greek Value Analysis: Delta slightly below 0 and high Theta indicate that the time decay works in favor (premium collected decays faster). Lower Vega helps manage volatility risk.
Risk and Reward: - Internal Risk: Since both options are near-term, the risk of substantial price movement is minimized. However, there's a risk of the sold put being ITM if the stock dips, leading to assignment risk. - Profit Scenario: If the stock price modestly rises to around 2%, the call option benefits due to higher intrinsic value gain. - Loss Scenario: If the stock falls around 2%, the put option would lose its premium faster, offsetting the long call's limited time value loss.
Option 2: Medium Term - Intermediate Expiration Date
Long Call Option: - Expiration Date: Mid-term (e.g., January 2024) - Strike Price: Slightly Out-of-the-money (OTM) - Greek Value Analysis: Delta moderately positive and average Vega suggest sensitivity to stock price and volatility but stable time decay compared to short-term.
Short Put Option: - Expiration Date: Mid-term (e.g., January 2024) - Strike Price: ATM - Greek Value Analysis: A delta close to zero and moderate Theta indicate a balanced position where the time decay aspect is manageable.
Risk and Reward: - Internal Risk: Medium term allows for more volatility exposure but offers better protection against assignment risk. - Profit Scenario: Modest stock price increase enhances the value of the purchased call. Proceeds from the decaying put cushion potential loss. - Loss Scenario: Stock drop might make the put option risky, though the mid-term expiration reduces the possibility of assignment.
Option 3: Long Term - Farthest Expiration Date
Long Call Option: - Expiration Date: Long term (e.g., June 2024) - Strike Price: Deep Out-of-the-Money (DOTM) - Greek Value Analysis: Lower Delta and high Vega create sensitivity to stock price shifts and volatility changes, with manageable Theta implications due to long expiration.
Short Put Option: - Expiration Date: Long term (e.g., June 2024) - Strike Price: Near-the-Money (NTM) - Greek Value Analysis: Low Theta and Vega values provide stability against sudden market downturns.
Risk and Reward: - Internal Risk: Lengthy period till expiry introduces volatility risk but diminishes instant assignment threat. - Profit Scenario: Significant upside potential if the stock moderately rises or holds steady due to the reduction in Vega and Theta implications. - Loss Scenario: Potential assignment if the stock drops drastically, but gradual decay in the long-term scenario gives room for adjustments.
Option 4: Stretched Term - Far Yet Manageable Expiration
Long Call Option: - Expiration Date: Intermediate-Late-Term (e.g., March 2024) - Strike Price: Slightly In-the-Money (ITM) - Greek Value Analysis: Higher Delta around 0.6 indicates greater sensitivity and faster reward upon the stock increase.
Short Put Option: - Expiration Date: Intermediate-Late-Term (e.g., March 2024) - Strike Price: Slightly OTM - Greek Value Analysis: Moderate negative Delta and higher Theta help reduce exposure to time decay.
Risk and Reward: - Internal Risk: Balanced mid-to-long term reduces sharp fluctuation risk while maintaining the premium income stability. - Profit Scenario: Stock rising modestly to the target enhances the ITM call value substantially. - Loss Scenario: Watch for minor stock declines; the OTM put offers premium cushion with minimal assignment threat.
Option 5: Balanced Medium-to-Longer Term
Long Call Option: - Expiration Date: Medium-to-Long-Term (e.g., April 2024) - Strike Price: ATM - Greek Value Analysis: Balanced Delta and Vega provide good sensitivity to stock price with moderate volatility impact.
Short Put Option: - Expiration Date: Medium-to-Long-Term (e.g., April 2024) - Strike Price: Slightly ITM - Greek Value Analysis: Slightly higher Theta and Vega manage decay timelines inevitably helping premium decay faster.
Risk and Reward: - Internal Risk: Medium-to-long term exposure ensures enough time to manage volatility while reducing drastic assignment fears. - Profit Scenario: Stock price increase leverages the ATM call option well; put premiums gradually enhance profit. - Loss Scenario: Watching strike points and expiration decreases likelihood of notable losses or immediate ITM assignments.
Summary
The most profitable calendar spread strategy needs to weigh the Greeks and expiration dates thoroughly. Near-term options bear the quickest profit potential but also the risk of immediate assignment if the stock price fluctuates greatly. Longer-term options reduce the immediate exposure risk but introduce a more volatile-sensitive scenario. Managing Greeks like Theta and Vega efficiently ensures the strategy benefits from time decay while mitigating assignment and premium loss, aligning well with the anticipated 2% stock price movement for Thales S.A (THLEF).
Calendar Spread Option Strategy #1
When considering a calendar spread strategy involving Thales S.A. (THLEF), wherein you buy a put option at one expiration date and sell a call option at a different calendar date, it's vital to account for both the profitability and the associated risks, especially the risk of assignment. The target stock price for THLEF is within a 2% range above or below the current stock price, and we must be meticulous with the greeks such as Delta, Gamma, Theta, and Vega, to ensure an optimal balance of risk and reward.
Analysis of Put and Call Options:
- Near-Term Strategy:
- Buy Put: Expiration Date: Near-term (e.g., 30 days out), Strike Price: Slightly Out-the-Money (OTM)
- Sell Call: Expiration Date: Slightly further out (e.g., 60 days out), Strike Price: At-the-Money (ATM) or slightly In-the-Money (ITM)
Risk and Reward: The near-term put option mitigates the upfront cost, aided by the lower extrinsic value for a shorter time decay. The ATM or slightly ITM call sold further out provides higher premium, generating immediate income. The delta-neutral characteristic minimizes directional risk while the highest Theta decay for the sold call works in your favor.
- Moderate-Term Strategy:
- Buy Put: Expiration Date: Moderate-term (e.g., 90 days out), Strike Price: Slightly ITM
- Sell Call: Expiration Date: Farther out (e.g., 150 days out), Strike Price: At-the-Money (ATM)
Risk and Reward: This strategy involves moderate upfront costs with a slightly ITM put providing intrinsic value protection. Selling an ATM call farther out generates premium while benefiting from greater Theta decay as the expiration date approaches. However, monitoring is necessary to manage assignment risks if the stock price pushes up.
- Balanced-Term Strategy:
- Buy Put: Expiration Date: 6 months out, Strike Price: Deep ITM
- Sell Call: Expiration Date: 1 year out, Strike Price: Near ATM
Risk and Reward: Purchasing a deep ITM put substantially reduces risk as it has high intrinsic value and lower Delta. The 1-year ATM call, while premium-rich, carries higher assignment risk. Still, overall Theta decay goes in favor of this strategy, but might mirror turning against if Vega (volatility) jumps.
- Long-Term Strategy:
- Buy Put: Expiration Date: 1 year out, Strike Price: Slightly OTM
- Sell Call: Expiration Date: 1.5 2 years out, Strike Price: OTM
Risk and Reward: Here, the long put with a year-long expiration provides ample time to capitalize on downward movements with less premium decay initially, while sold OTM calls extend out to generate premium over a longer period. This strategy reduces immediate risk but requires keen monitoring as OTM strikes reach profitability zones.
- Far Out-Term Strategy:
- Buy Put: Expiration Date: 2 years out, Strike Price: Deep ITM
- Sell Call: Expiration Date: 2.5 years out, Strike Price: ATM
Risk and Reward: The far-out put option ensures intrinsic protection due to its deep ITM status, minimizing excessive premium erosion. The ATM call provides substantial premium though bearing higher assignment risk if stock hits higher targets before expiration.
Quantifying Risk and Reward:
- Risk of Assignment: To minimize the risk of shares being assigned, deep ITM puts and moderately ITM calls should be kept, balancing intrinsic value and retaining a favorable Delta.
- Theta Management: Maximizing decayed time value from sold calls nearing expiry while retaining beneficial time decay on the long puts.
- Profit Scenarios: Given a target stock price within the 2% range, strategies with moderately ITM put strikes lower Theta decay loss and higher initial intrinsic protection, markedly minimizing downside risks.
Given these scenarios, each strategic choice outlines tailoring for maximizing profitability while balancing risk, primarily given the target price range set for THLEF. However, continuous reassessment is essential to dynamically respond to options price changes, implied volatility variations, and underlying stock movements.
Calendar Spread Option Strategy #2
Analyzing the options chain for Thales S.A. (THLEF) and implementing a calendar spread strategy with an aim to minimize the risk of share assignment while maximizing profitability requires balancing various factors. Given that the goal is a calendar spread, where we sell a put option at one expiration date and buy a call option at a different expiration date, we must carefully assess the Greek values and the currently available strike prices and expiration dates.
Calendar Spread Strategy Analysis
1. Short-term (Near-Term) Calendar Spread:
-
Short Put Option (Near-Term): Let's assume we have a put option expiring in one month with a strike price near the current stock price. Given the theta decay accelerates as the expiration date approaches, the time value of these options diminishes quickly, which is advantageous when selling them.
-
Strike Price: 2% below the current stock price.
- Expiration Date: One month out.
- Greek Analysis: Low delta decreases the probability of the option finishing in the money, thus reducing assignment risk. High theta means the option loses value quickly as expiration approaches.
- Risk: Limited as delta is low.
-
Reward: Earn premium from short put.
-
Long Call Option (Near-Term): Corresponding call option expiring three months out with subtle time value erosion.
-
Strike Price: 2% above the current stock price.
- Expiration Date: Three months out.
- Greek Analysis: Higher delta suggests significant intrinsic value gain if the stock rises. High gamma implies large price moves are beneficial.
- Risk: Premium outlay and potential movement against the position.
- Reward: Profit from the increase in stock price and reduced time value loss.
2. Mid-term Calendar Spread:
-
Short Put Option (Mid-Term): Put option expiring in three months, close to but slightly below the current stock price.
-
Strike Price: Around the current stock price.
- Expiration Date: Three months.
- Greek Analysis: Moderate delta lowers the assignment risk while still offering substantial premium. Lower gamma minimizes volatility impact.
- Risk: Still relatively low assignment risk. Possibility of being caught in the money if the stock declines.
-
Reward: Generous premium collection.
-
Long Call Option (Mid-Term): Call option expiring six months out, a bit out-of-the-money (2% above).
-
Strike Price: Slightly above the current stock price.
- Expiration Date: Six months.
- Greek Analysis: High delta and gamma for significant growth potential. Time decay is slow (low theta).
- Risk: Greater premium outlay.
- Reward: Higher profit potential if stock appreciates.
3. Long-term Calendar Spread:
-
Short Put Option (Long-Term): Put option expiring in six months, at-the-money to slightly in-the-money.
-
Strike Price: At-the-money or slightly in-the-money.
- Expiration Date: Six months.
- Greek Analysis: Higher delta increases assignment risk but also brings higher premium. Low gamma reduces sensitivity to price changes.
- Risk: Medium to high due to longer assignment period.
-
Reward: Maximum premium profit.
-
Long Call Option (Long-Term): Call option expiring one year out, out-of-the-money to increase leverage.
-
Strike Price: 2% above the current stock price.
- Expiration Date: One year.
- Greek Analysis: High time decay (low theta) over a longer period, with high delta for significant intrinsic value potential.
- Risk: High due to the time frame and premium outlay.
- Reward: Maximized gains if the stock appreciates significantly.
Risk and Reward Quantification
- Short-term:
- Risk: Low; possible assignment if the stock falls drastically.
-
Reward: Limited premium collection, potential gains from long call.
-
Mid-term:
- Risk: Moderate; medium assignment risk.
-
Reward: Higher premium, substantial call option profit.
-
Long-term:
- Risk: High; significant assignment risk over a long period.
- Reward: Maximum potential premium and call value appreciation.
Potential Profit and Loss Scenarios
By selling a near-term put option and buying a further-out call option, we aim to profit from the premium while benefiting from stock price appreciation over a set period. The risks arise mainly from potential assignment of the short put, particularly if the stock moves significantly against the position. On the profitable side, the long call, especially when positioned strategically with a higher delta, can yield substantial returns if the stock follows the predicted upward trajectory, with minimized time decay losses due to the longer duration.
Overall, each strategy's appeal rests on balancing risk-type (assignment vs. premium loss) against the reward potential (premium income vs. capital gains). Near-term options provide reduced risk with immediate rewards but less profit potential, while longer-term strategies offer high profit potential but increased risk.
Similar Companies in Aerospace & Defense:
MTU Aero Engines AG (MTUAY), Singapore Technologies Engineering Ltd (SGGKF), Conrad Industries, Inc. (CNRD), Safran SA (SAFRF), Thales S.A. (THLLY), Nauticus Robotics, Inc. (KITT), CPI Aerostructures, Inc. (CVU), BAE Systems plc (BAESF), Report: L3Harris Technologies, Inc. (LHX), L3Harris Technologies, Inc. (LHX), Report: Lockheed Martin Corporation (LMT), Lockheed Martin Corporation (LMT), Report: Raytheon Technologies Corporation (RTX), Raytheon Technologies Corporation (RTX), Report: Northrop Grumman Corporation (NOC), Northrop Grumman Corporation (NOC), Report: General Dynamics Corporation (GD), General Dynamics Corporation (GD)
https://finance.yahoo.com/news/bots-now-nearly-half-internet-070000068.html
https://finance.yahoo.com/news/3-overvalued-defense-stocks-sell-163449567.html
https://finance.yahoo.com/news/italy-france-sign-letter-intent-163217286.html
https://finance.yahoo.com/news/frances-thales-could-tempted-atos-050627129.html
https://finance.yahoo.com/m/5b4a8474-17e0-3f91-8e8c-507407051f91/this-defense-company-has-a.html
https://finance.yahoo.com/news/thaless-dividend-analysis-110115232.html
https://finance.yahoo.com/news/thales-leads-innovative-digital-transformation-070000926.html
Copyright © 2024 Tiny Computers (email@tinycomputers.io)
Report ID: FhGZXo
Cost: $0.37695
https://reports.tinycomputers.io/THLEF/THLEF-2024-05-25.html Home