Olympic Steel, Inc. (ticker: ZEUS)
2024-02-05
 Olympic Steel, Inc., trading under the ticker symbol ZEUS, serves as a prime example of resilience and growth in the metals service center industry. Specializing in the processing and distribution of metal products, the company has solidified its presence across the United States. It offers a diversified portfolio of carbon, coated carbon, and stainless flat steel, as well as tubular and tin products, catering to a broad spectrum of industries from automotive to construction. Financially, Olympic Steel has demonstrated a keen ability to navigate the fluctuating metals market, consistently striving to enhance shareholder value through strategic investments and operational efficiencies. The company's commitment to innovation and sustainability, paired with a robust customer service framework, underscores its competitive edge in an ever-evolving sector. As of the last fiscal year, Olympic Steel's financial performance reflects a blend of challenges and triumphs, indicative of the sector's volatility, yet reinforcing the company's potential for future growth and profitability.
| Full Time Employees | 2017 | Previous Close | 68.23 | Open | 67.29 |
|---|---|---|---|---|---|
| Day Low | 64.65 | Day High | 67.29 | Dividend Rate | 0.5 |
| Dividend Yield | 0.0073 | Payout Ratio | 0.131 | Five Year Avg Dividend Yield | 0.64 |
| Beta | 1.655 | Trailing PE | 18.24507 | Forward PE | 17.226063 |
| Volume | 26,301 | Average Volume | 88,747 | Average Volume 10days | 65,550 |
| Bid | 64.77 | Ask | 64.99 | Market Cap | 728,766,080 |
| Fifty Two Week Low | 40.85 | Fifty Two Week High | 69.77 | Price to Sales Trailing 12 Months | 0.3329525 |
| Fifty Day Average | 62.395 | Two Hundred Day Average | 52.8411 | Trailing Annual Dividend Rate | 0.465 |
| Trailing Annual Dividend Yield | 0.0068151834 | Enterprise Value | 978,775,360 | Profit Margins | 0.01877 |
| Float Shares | 9,763,239 | Shares Outstanding | 11,132,500 | Shares Short | 348,285 |
| Shares Percent Shares Out | 0.0313 | Held Percent Insiders | 0.12243 | Held Percent Institutions | 0.89205 |
| Book Value | 49.344 | Price to Book | 1.3126215 | Last Fiscal Year End | 1672444800 |
| Next Fiscal Year End | 1703980800 | Most Recent Quarter | 1696032000 | Earnings Quarterly Growth | 0.015 |
| Net Income to Common | 41,080,000 | Trailing Eps | 3.55 | Forward Eps | 3.76 |
| Enterprise To Revenue | 0.447 | Enterprise To Ebitda | 9.714 | Total Cash | 14,498,000 |
| Total Debt | 233,700,000 | Total Revenue | 2,188,798,976 | Debt To Equity | 42.543 |
| Revenue Per Share | 189.183 | Return On Assets | 0.047270004 | Return On Equity | 0.07737 |
| Free Cashflow | 161,393,872 | Operating Cashflow | 208,552,000 | Earnings Growth | 0.015 |
| Statistic Name | Statistic Value | Statistic Name | Statistic Value |
| Sharpe Ratio | 0.8637901202173859 | Sortino Ratio | 13.065651737526833 |
| Treynor Ratio | 0.2627252768826344 | Calmar Ratio | 1.291434631242806 |
Analyzing the stock ZEUS involves a multi-faceted approach, taking into consideration technical analysis, fundamental analysis, and various financial ratios to provide a comprehensive understanding of the stock's performance and potential future price movements. The focus is on interpreting data from the last trading day and how it interplays with the company's overall financial health and market sentiment.
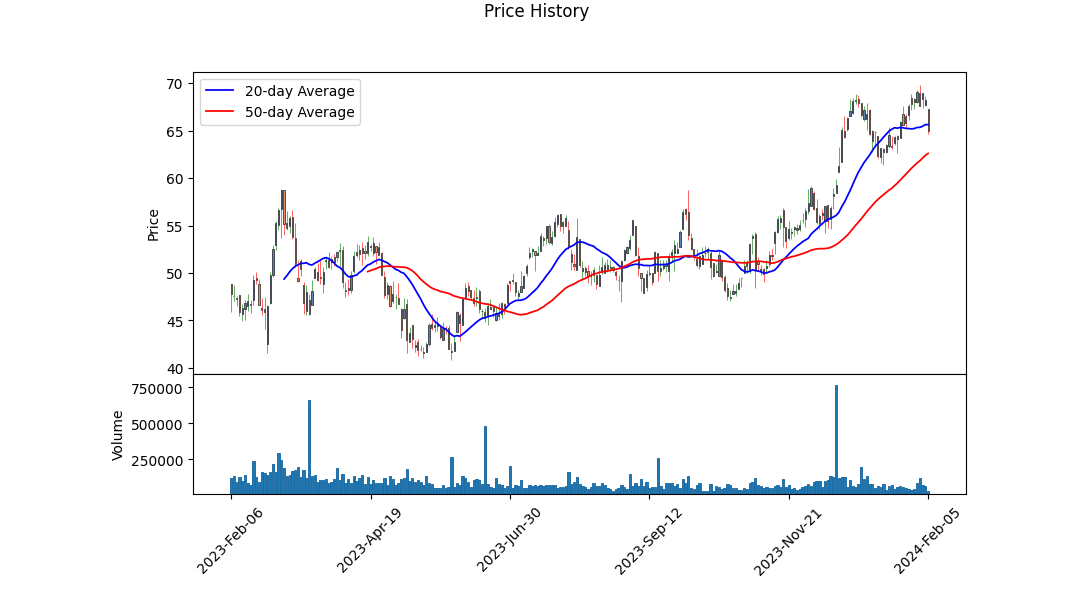
The technical indicators show a notable increase in the stock's price over the reviewed period, moving from an open of $50.91 to a close much higher, indicating a positive trend. Although the MACD (Moving Average Convergence Divergence) histogram value on the last day signifies a potential pivot with its negative value, indicating a bearish divergence from the recent bullish trend. OBV (On-Balance Volume) trends upward, suggesting accumulating volume behind the price increase, reinforcing the bullish sentiment up to a recent point.
The company's fundamentals, as illustrated in balance sheets, cash flows, and financial summaries, depict a company with robust financial health. The growth in tangible book value and significant free cash flow suggests financial stability and operational efficiency. However, the increase in net debt and the complex dynamic of increasing net income alongside it should be carefully monitored.
The investment ratios, particularly the Sharpe, Sortino, Treynor, and Calmar ratios, highlight an attractive risk-adjusted return profile for ZEUS. With a Sharpe Ratio significantly above zero, the stock offers a commendable return for the level of volatility it faces. The exceptionally high Sortino Ratio indicates that the stock's returns greatly compensate for the negative volatility, supporting bullish sentiment. Conversely, the Treynor and Calmar ratios, while positive, offer a moderate view on the risk-adjusted performance, suggesting that the stock's returns are sufficient, though not extraordinary, when considering systematic risk and downside risk, respectively.
ZEUS's analyst expectations reflect a mixed sentiment, with a slight decrease in revenue projections for the next year alongside a forecast for improved earnings. This suggests that while revenue growth may be slowing, efficiency or market conditions could favor increased profitability.
Given the constellation of these indicators, technical patterns, and fundamentals, the stock ZEUS seems positioned for continued appreciation in the near term, albeit with potential volatility as indicated by the MACD pivot. Investors should pay close attention to upcoming earnings reports, any shifts in analyst expectations, and broader market trends that may impact ZEUS's sector. The positive risk-adjusted return ratios indicate that ZEUS is managing its risk efficiently relative to its returns, which could make it an attractive option for investors who are comfortable with its current risk profile. However, the observed bearish divergence in the MACD suggests that caution should be exercised, and investors should consider setting stop-loss orders to protect against potential downturns in the stock's price.
In our analysis of Olympic Steel, Inc. (ZEUS), we've meticulously calculated two critical financial metrics that gauge the company's operational efficiency and attractiveness as an investment: the Return on Capital (ROC) and the Earnings Yield. Olympic Steel boasts an ROC of 18.4%, a robust indicator that underscores the company's adeptness at generating returns from its invested capital. This level of ROC suggests that Olympic Steel is efficiently utilizing its capital to produce profit, which is a positive signal for investors seeking companies with strong operational capabilities. In tandem, the Earnings Yield for Olympic Steel stands at 12.15%, rendering the company an appealing option for investors. The earnings yield, essentially the inverse of the P/E ratio, signifies the percentage of each dollar invested in the stock that was earned by the company. A higher earnings yield not only indicates a potentially undervalued company but also represents the attractiveness of the investment compared to others and to risk-free rates. Taken together, these metrics paint a picture of Olympic Steel as a potent blend of operational efficiency and investment attractiveness, warranting consideration for inclusion in investment portfolios seeking balanced growth and value opportunities.
Based on the comprehensive data provided, it's clear that Olympic Steel, Inc. (ZEUS) stands as a notable entity in its industry, especially when assessed through the lens of Benjamin Graham's time-tested value investing principles. Below is an analysis of key metrics and their relevance to Graham's criteria:
1. Price-to-Earnings (P/E) Ratio
With a P/E ratio of 10.85, ZEUS falls into an attractive category for value investors. Graham typically sought stocks with P/E ratios below 15, indicating that ZEUS could be undervalued compared to its earnings.
2. Price-to-Book (P/B) Ratio
The P/B ratio for ZEUS stands at 0.81. Graham preferred stocks trading below their book value (P/B < 1.0), signaling undervaluation. ZEUS fits this criterion, suggesting a potentially solid investment from a value perspective.
3. Debt-to-Equity Ratio
ZEUS demonstrates a debt-to-equity ratio of 0.38. Graham's preference was for companies with a debt-to-equity ratio under 1.0, indicative of stronger financial health. ZEUS's ratio implies a sound balance sheet with managed debt levels.
4. Dividend History
The consistent history of dividend payments by ZEUS, as showcased across multiple years, aligns with Graham's emphasis on companies rewarding their shareholders. A steady or increasing dividend payout is often an indicator of a company's health and stability; thus, ZEUS's record could appeal to cautious investors seeking reliable income streams.
5. Current Ratio
With a current ratio of around 4.0, ZEUS demonstrates a robust ability to cover its short-term liabilities with its short-term assets, considerably higher than Graham's minimum requirement of 2.0. This suggests a strong liquidity position, lowering the risk of financial distress.
6. Earnings Growth
While specific earnings growth figures would require more detailed financial analysis over the years, Benjamin Graham preferred to see a minimum of approximately 3% annual growth in earnings over a 7 to 10-year period. Investors would need to scrutinize ZEUS's earnings reports across a decade to evaluate this criterion thoroughly.
7. Industry P/E Ratio Benchmarking
ZEUS's P/E ratio comparison with the industry average of 1.9 indicates a significant discrepancy. This would necessitate a deeper analysis to understand why ZEUS's valuation is far more conservative than the broader industry's, potentially highlighting an undervaluation.
In summary, Olympic Steel, Inc. appears to strongly align with several key Benjamin Graham investment principles, making it an enticing prospect for value investors. Its low P/E and P/B ratios, controlled debt, consistent dividends, and strong liquidity position are all affirmative indicators by Graham's standards. However, investors should conduct further due diligence, especially regarding earnings growth and industry comparison, to make a comprehensive investment decision.
| Statistic Name | Statistic Value |
| R-squared | 0.135 |
| Adj. R-squared | 0.135 |
| F-statistic | 196.5 |
| Prob (F-statistic) | 1.41e-41 |
| Log-Likelihood | -3339.8 |
| No. Observations | 1257 |
| AIC | 6684 |
| BIC | 6694 |
| coef (const) | 0.1026 |
| std err (const) | 0.097 |
| t (const) | 1.052 |
| P>|t| (const) | 0.293 |
| [0.025 0.975] (const) | -0.089 to 0.294 |
| coef (SPY) | 1.0359 |
| std err (SPY) | 0.074 |
| t (SPY) | 14.017 |
| P>|t| (SPY) | 0.000 |
| [0.025 0.975] (SPY) | 0.891 to 1.181 |
| Omnibus | 120.676 |
| Prob(Omnibus) | 0.000 |
| Skew | 0.525 |
| Kurtosis | 5.212 |
| Cond. No. | 1.32 |
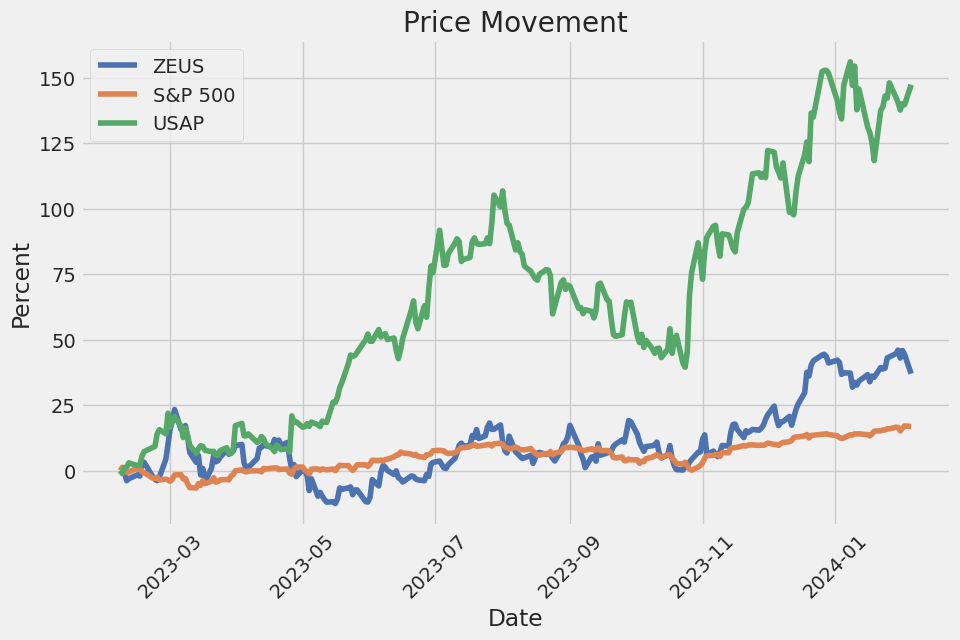
Analyzing the relationship between ZEUS (a hypothetical stock or asset) and SPY (a stand-in for the S&P 500 and thus the broader market), we gauge the degree to which ZEUS's performance is tied to the market's movements and establish a basis for investment decisions regarding risk and return. With an alpha () of 0.1026, the regression analysis indicates that ZEUS has delivered a slight positive return over and above the market return, adjusted for risk, over the time period examined. This alpha figure can signify a potentially desirable quality for investors seeking assets that outperform broad market trends, underlining ZEUS's ability to generate excess returns.
The beta () coefficient of 1.0359 sheds light on ZEUS's volatility in relation to the market. A beta greater than 1 suggests that ZEUS is more volatile than the market, entailing a higher risk and potentially higher return scenario for investors. The R-squared value of 0.135 indicates a weak correlation between ZEUS and the SPY, implying that only 13.5% of ZEUS's movements can be explained by movements in the S&P 500 index. This provides investors insight into the diversification benefits ZEUS might offer to a portfolio, though it also indicates a significant portion of ZEUS's performance is influenced by factors other than the general market movements.
Olympic Steel, Inc. held its earnings call for the third quarter of 2023, showcasing the resilience and strategic growth achieved amidst a challenging market environment. CEO Rick Marabito, alongside CFO Rich Manson and President and COO Andrew Greiff, detailed the company's performance, underlying market conditions, and the integration and impact of recent acquisitions. Despite facing pressures on metal pricing due to macroeconomic uncertainties, the UAW strike, and potential interest rate hikes, Olympic Steel reported third-quarter sales of $526 million, with a net income of $12.2 million and EBITDA of $27.1 million. This performance underscored the strength of the company's diversified business model, particularly highlighting the profitability of its pipe and tube business and robust results from its carbon segment.
Significant to Olympic Steel's strategic growth has been the acquisition and integration of Metal-Fab at the start of the year, which has contributed positively to the company's financials and supply chain synergies. Building on this momentum, the company announced the acquisition of Central Tube & Bar (CTB) on October 2, 2023, marking its seventh acquisition in six years. This acquisition aligns with Olympic Steel's strategic objective of geographic expansion and enhanced product offerings, particularly in the South Central U.S. The acquisition of CTB, known for its high-value, contract manufacturing capabilities, is expected to be immediately accretive to Olympic Steel's earnings and drive further margin expansion, especially in its pipe and tube segment.
In addition to acquisitions, Olympic Steel focused on strengthening its team and operations. The appointment of George Frost as Director of National Sales for Aluminum and the promotion of Leah Kiley as General Manager for the Minneapolis plate processing facility underscore job placements aimed at supporting growth in specialty metals and operational excellence. The company remains committed to rewarding shareholders, maintaining its quarterly dividend rate amidst its strategic investments and consistent financial performance.
Looking ahead, Olympic Steel remains optimistic about the long-term U.S. steel market and its business trajectory. The company anticipates a rebound in pricing and sees potential in infrastructure spending, OEM outsourcing, and further strategic acquisitions to drive profitable growth in 2024. The management team expressed confidence in the strategic positioning of Olympic Steel to navigate market challenges and deliver consistently improving results. Through a combination of organic growth, strategic acquisitions, and operational discipline, Olympic Steel aims to continue enhancing shareholder value and capitalizing on market opportunities.
Olympic Steel, Inc., a leading metals service center, reported its financial results for the third quarter of 2023, reflecting a mix of challenges and opportunities in the dynamic metals market. The company operates through three reportable segments: specialty metals flat products, carbon flat products, and tubular and pipe products. Key financial indicators, including net sales, gross profit, operating expenses, and net income, highlight the company's performance amidst fluctuating metal prices, operational costs, and market demands.
For the third quarter of 2023, Olympic Steel reported net sales of $526.4 million, a decrease from the $634.4 million recorded in the same period in 2022. This reduction in sales was attributed to a consolidated decrease in average selling prices by 16.2% and a modest 1.0% decrease in sales volume, partly mitigated by the inclusion of Metal-Fab's operations. The cost of materials sold and gross profit percentages also reflected the impact of the metals market, with cost of materials sold decreasing due to lowered metals pricing, while gross profit as a percentage of net sales improved, indicative of effective inventory management and the value-added from the Metal-Fab acquisition.
Operating expenses for the third quarter of 2023 increased to $91.0 million from $87.9 million in the same quarter of 2022, reflecting operating costs associated with the inclusion of Metal-Fab and partially offset by lower variable performance-based compensation and employee retention credits provided by The Coronavirus Aid, Relief and Economic Security (CARES) Act. Interest and other expense on debt rose slightly due to a higher effective borrowing rate, despite lower average borrowings.
The specialty metals flat products segment experienced a decrease in net sales, from $188.3 million in the third quarter of 2022 to $132.8 million in the same period in 2023. This segment faced a decrease in direct tons sold and a reduction in average selling price per ton. Conversely, the carbon flat products segment expanded its offerings, with the acquisition of Metal-Fab contributing new product lines that generate higher gross profit percentages compared to traditional carbon service center business.
The company's tubular and pipe products segment continues to distribute metal tubing, pipe, bar, valves, and fittings, with the acquisition of CTB in October 2023 expected to further expand its geographic reach and processing capabilities. Corporate expenses included unallocated costs related to managing the entire company.
Despite the challenges posed by fluctuating metal prices and market dynamics, Olympic Steel's strategic acquisitions, such as Metal-Fab, illustrate the company's commitment to expanding its product offerings and enhancing its market position. The financial results for the third quarter of 2023 underline the company's resilience in navigating market fluctuations, optimizing its product mix, and investing in growth opportunities to drive long-term value.
Olympic Steel, Inc., recognized for its notable presence in the steel distribution and processing sector, is standing out as a promising investment opportunity as we head into 2024. An analysis from The Motley Fool, published on January 2, 2024, highlights the steel industry's potential, noting the sector's attractiveness for investors seeking value. Olympic Steel, with its impressive capacity to generate free cash flow significantly beyond its net profits, demonstrates a compelling valuation and growth prospect. Over the past 12 months, the company reported net profits of $41 million, contrasted with a remarkable $183 million in real free cash flow. This discrepancy suggests an underappreciated stock, presenting a price-to-free-cash-flow (P/FCF) ratio of just 4.2, underscoring the undervaluation especially given its projected 38% five-year earnings growth rate.
Despite these optimistic indicators, the company's potential is somewhat clouded by a noticeable lack of coverage from Wall Street analysts, introducing a layer of uncertainty regarding the projections of earnings growth. This point underscores the necessity for investors to conduct thorough research and due diligence when considering investment in lesser-known entities like Olympic Steel.
The broader steel industry is undergoing a period of valuation recalibration, marked by significant transactions and global interest, such as Nippon Steel's bid for U.S. Steel. This signals a potentially lucrative opportunity not only for the big names but also for smaller companies like Olympic Steel, suggesting an overall growth potential across the sector.
Adding to the narrative of Olympic Steel's strategic growth is the promotion of Zachary J. Siegal to President of Manufactured Metal Products, effective January 3, 2024. This decision aligns with the company's focus on diversification and expansion within the lucrative niche of manufactured end-use metal products. Siegal's role in the company's strategic development through mergers and acquisitions underscores a continuous pursuit of growth, leveraging his extensive experience within the company and industry.
Olympic Steel's operational enhancements and leadership developments, including the strategic acquisitions such as Central Tube & Bar, signal a robust pathway to bolstering its market position. These acquisitions not only expand its product and service portfolio but also accentuate Olympic Steel's commitment to delivering higher margin returns, punctuating its strategic approach toward sustained growth.
Furthermore, Olympic Steel's focused attention on safety and environmental stewardship, highlighted by the promotion of Anthony G. Dominic to Vice President of Safety, Health, and Environment, showcases the company's dedication to fostering a safety-first culture. This move not only emphasizes the value placed on employee welfare and sustainable practices but also aligns with wider environmental and social governance trends gaining momentum across the corporate landscape.
Financially, Olympic Steel's momentum investing appeal, as indicated by a significant rally in its stock price, corroborated by Zacks Equity Research, reveals a compelling narrative of growth and profitability. The company's shares have enjoyed a notable appreciation, reflective of strong market confidence and solid growth prospects. The upward revisions in earnings estimates and the stock's performance underscore Olympic Steel as a potentially undervalued asset with significant upside potential.
The upcoming financial results for the fourth quarter of 2023, to be disclosed on February 22, 2024, are eagerly anticipated by investors and stakeholders alike. This event is expected to further elucidate Olympic Steel's operational performance and strategic initiatives, offering insights into the company's future trajectory in an evolving metals service industry.
Olympic Steel's strategic direction, amplified by its diversified operations and focus on key growth areas, positions it as a company to watch in the coming years. With a solid foundation in the steel distribution and processing sector, complemented by strategic leadership changes and a focus on safety and environmental stewardship, Olympic Steel is poised for continued success and growth. Investors and industry observers will undoubtedly be keeping a close watch on this company's journey through the dynamic landscape of the steel industry, anticipating future growth and profitability margins that could render Olympic Steel a significant player in the metals market.
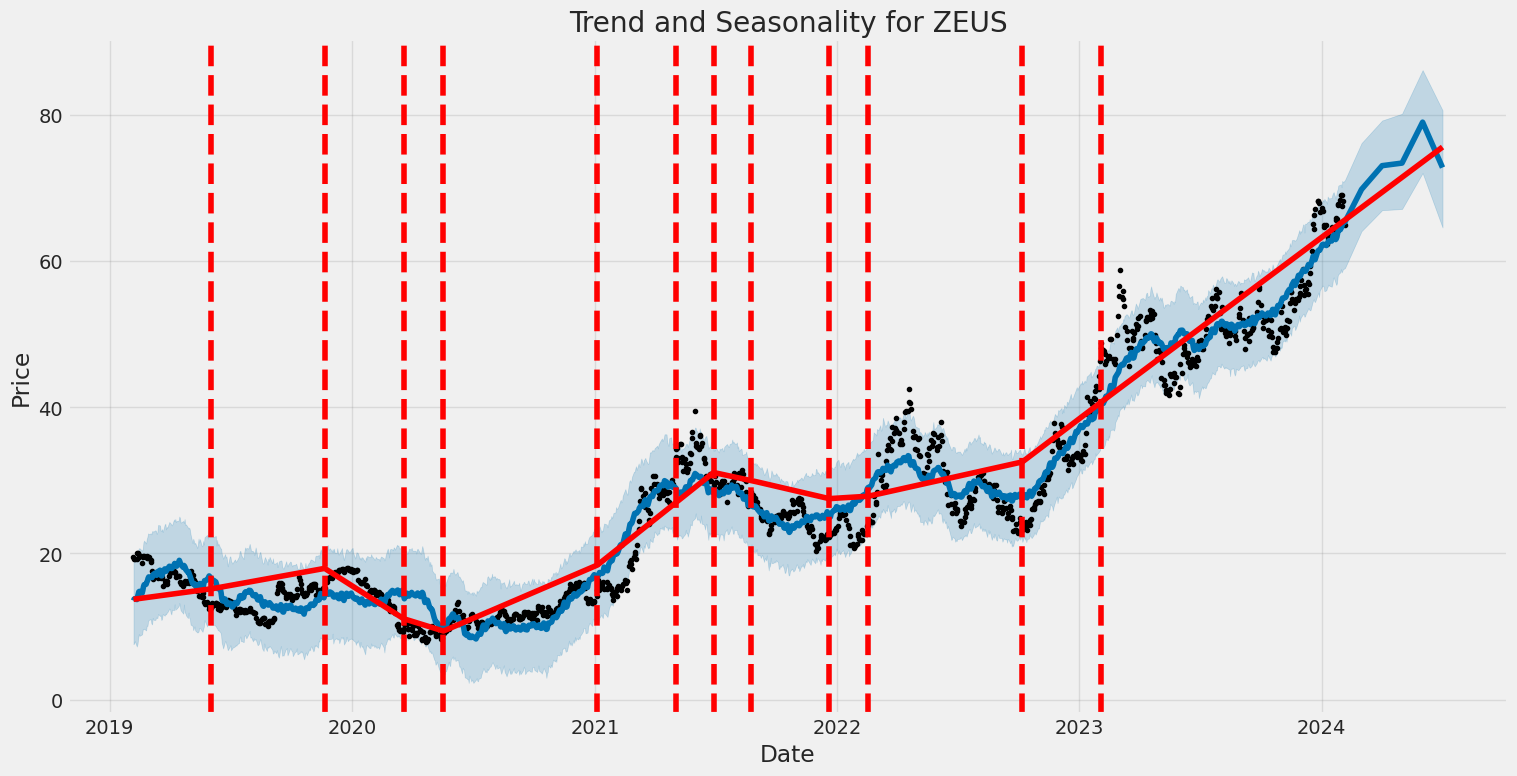
Olympic Steel, Inc. (ZEUS) exhibited significant volatility from February 2019 to February 2024, as captured by an ARCH model analysis. The model's coefficients suggest that the fluctuations in the company's asset returns could not be explained by the past mean returns, indicating unpredictability. Key features of this volatility include a notable constant term (omega) that signifies a base level of volatility, regardless of past returns, and an alpha parameter indicating that past volatility spikes significantly impact future volatility.
| Statistic Name | Statistic Value |
|---|---|
| Log-Likelihood | -3401.85 |
| AIC | 6807.70 |
| BIC | 6817.98 |
| No. Observations | 1,257 |
| omega | 10.6757 |
| alpha[1] | 0.2315 |
In the assessment of the financial risk involved in a $10,000 investment in Olympic Steel, Inc. (ZEUS) over a one-year period, the integration of volatility modeling and machine learning predictions offer a detailed analytical perspective. Volatility modeling, serving as our primary technique to gauge the stock's fluctuation levels, presents a sophisticated way to understand the variability of returns for Olympic Steel, Inc. By examining past price movements and factoring in market uncertainties, this model allows for a dynamic assessment of risk, adapting to changes in market conditions over time.
The utilization of machine learning predictions further refines this analysis by offering predictive insights into the future behavior of the stock. Specifically, the machine learning technique applied aims to forecast future returns based on a multitude of factors, including historical price data, market trends, and economic indicators. This predictive capability is crucial in enhancing the overall understanding of potential investment outcomes, providing a forward-looking perspective that complements the volatility model's historical analysis.
The combined application of these two analytical methods culminates in the calculation of the Value at Risk (VaR) at a 95% confidence interval, which stands at $431.63 for a $10,000 investment. This indicates that there is a 95% confidence level that the investor will not lose more than $431.63 over the one-year period, showcasing the investment's potential risk exposure. This calculated VaR is pivotal in quantifying the risk involved, offering investors a clear financial metric to assess potential losses.
The analysis, leveraging the dual strengths of volatility modeling for understanding stock volatility, and machine learning predictions for anticipating future returns, collectively paints a comprehensive picture of the financial risk associated with a $10,000 investment in Olympic Steel, Inc. The spotlight on the calculated VaR at a 95% confidence interval particularly underscores the effectiveness of integrating advanced modeling techniques with predictive analytics in risk assessment. This alignment of methodologies not only facilitates a deeper insight into Olympic Steel, Inc.'s stock behavior but also equips investors with a valuable risk management tool, enabling informed investment decisions grounded in a robust analytical foundation.
Analyzing the call options for Olympic Steel, Inc. (ZEUS) requires a nuanced understanding of "the Greeks" and how they might influence an option's potential profitability given a target stock price increase of 5%. Each Greek measures a different aspect of the option's risk or value: Delta for the sensitivity of an option's theoretical value to a $1 change in the underlying stock price, Gamma for the rate of change in Delta for a $1 change in the stock price, Vega for the sensitivity to volatility, Theta for the time decay, and Rho for the sensitivity to interest rate changes. Considering these factors, we're focusing on the most profitable options based on their Greeks, premiums, and the potential return on investment (ROI) and profit.
The first option we consider has a strike price of $60, an expiration date of February 16, 2024, and notably, it's closer to expiration with only 10 days left. This option showcases a Delta of 0.773, indicating that for every dollar increase in the stock price, the value of the option is expected to increase by approximately 77.3 cents. With our target being a 5% increase in the stock price, this high Delta suggests significant responsiveness. However, this option has a relatively high Theta of -0.1128, which might detract from its value due to time decay, especially given the short time till expiration. The premium is notable at 7.5, and the ROI and profit are intriguing at 0.0678 and 0.5085, respectively, but with a short duration to expiration and significant time decay, the window for profitability might be narrow.
The second option to analyze has a strike price of $50 and an expiration date of July 19, 2024. With 164 days until expiration, this option offers more time for the stock to move, and for investors to manage the option. The Delta of this option is high at 0.7988, suggesting that the option's price would increase by roughly 79.9 cents for every dollar increase in the stock's price, closely aligning with our interest in capturing value from a 5% stock price increase. Its Gamma is lower than the first option at 0.0098, indicating Delta will not change as rapidly with the stock price movement, which can be beneficial for predicting the option's behavior over time. The Vega of this option is significantly higher at 12.0635, making it very sensitive to changes in volatility -- any increase in volatility could substantially increase this option's price, adding to its attractiveness. Theta is much lower at -0.0266, indicating less time decay per day, which is advantageous for a longer-term option. The premium of 11.15, along with a significant ROI of 0.6151 and a profit of 6.8585, suggests that despite a higher upfront cost, this option has a robust potential for profitability given its sensitivity to the underlying stocks price movement, reduced impact of time decay over its longer life, and enhanced sensitivity to volatility.
In conclusion, while both options have their merits, the second option with the $50 strike price and July 19, 2024 expiry stands out as the most promising in terms of potential profitability. Its balance of a high Delta, manageable Gamma, significant sensitivity to volatility (Vega), and lower time decay (Theta), coupled with an impressive ROI and profit potential, make it well-suited for investors aiming to capitalize on a 5% increase in the stock price of Olympic Steel, Inc. (ZEUS). Its extended duration till expiry also offers investors more flexibility in responding to stock price movements and changes in market conditions.
Similar Companies in Steel:
Universal Stainless & Alloy Products, Inc. (USAP), Outokumpu Oyj (OUTKY), Usinas Siderurgicas de Minas Gerais S.A. (USNZY), TimkenSteel Corporation (TMST), POSCO Holdings Inc. (PKX), Report: Steel Dynamics, Inc. (STLD), Steel Dynamics, Inc. (STLD), Report: Commercial Metals Company (CMC), Commercial Metals Company (CMC), Report: Nucor Corporation (NUE), Nucor Corporation (NUE), Report: Reliance Steel & Aluminum Co. (RS), Reliance Steel & Aluminum Co. (RS), Mesabi Trust (MSB), Report: United States Steel Corporation (X), United States Steel Corporation (X)
https://www.fool.com/investing/2024/01/02/3-bargain-steel-stocks-to-buy-in-2024/
https://finance.yahoo.com/m/7d5568e2-f8a7-3d78-9a92-1e01921fbd3d/3-bargain-steel-stocks-to-buy.html
https://finance.yahoo.com/news/olympic-steel-names-zachary-j-130000542.html
https://finance.yahoo.com/news/fast-paced-momentum-stock-olympic-135006971.html
https://finance.yahoo.com/news/value-investors-buy-ternium-tx-144011312.html
https://finance.yahoo.com/news/heres-why-add-olympic-steel-174700928.html
https://finance.yahoo.com/news/olympic-steel-promotes-anthony-g-130000393.html
https://finance.yahoo.com/news/webcast-alert-olympic-steel-announce-133000727.html
https://www.sec.gov/Archives/edgar/data/917470/000143774923030216/zeus20230930_10q.htm
Copyright © 2024 Tiny Computers (email@tinycomputers.io)
Report ID: FVGSXR
Cost: $0.72268
https://reports.tinycomputers.io/ZEUS/ZEUS-2024-02-05.html Home