Amazon.com, Inc. (ticker: AMZN)
2024-01-30
 Amazon.com, Inc. (ticker: AMZN) is a leading global e-commerce and cloud computing company founded by Jeff Bezos in 1994. Initially starting as an online bookstore, Amazon has since diversified its offerings to include electronics, apparel, furniture, food, toys, and a vast array of other consumer products. It operates through various segments including North America, International, and Amazon Web Services (AWS), its lucrative cloud computing division. AWS provides a broad set of global cloud-based products including computing power, database storage, and content delivery services. Amazon also offers digital streaming services through Amazon Prime Video, and has ventured into artificial intelligence, live streaming (through Twitch), and the grocery retail market with the acquisition of Whole Foods Market. With its headquarters in Seattle, Washington, Amazon has developed a global reach, featuring a massive logistics network and is known for its innovation in supply chain management and electronic commerce. The company's customer-centric approach, along with its Prime membership program, has contributed to a base of loyal customers and its dominant position in online retail. As of the knowledge cutoff in 2023, Amazon remains one of the most valuable public companies in the world, continuously evolving and expanding its influence across various industries.
| Address | 410 Terry Avenue North | City | Seattle | State | WA |
| Zip | 98109-5210 | Country | United States | Phone | 206 266 1000 |
| Website | https://www.aboutamazon.com | Industry | Internet Retail | Sector | Consumer Cyclical |
| Full Time Employees | 1,500,000 | Previous Close | $159.12 | Day Low | $158.90 |
| Day High | $161.29 | Beta | 1.163 | Trailing PE | 83.1237 |
| Forward PE | 44.42424 | Volume | 42,371,165 | Average Volume | 46,989,388 |
| Market Cap | $1,666,460,811,264 | Fifty Two Week Low | $88.12 | Fifty Two Week High | $161.29 |
| Price to Sales | 3.0079002 | Enterprise Value | $1,768,361,820,160 | Profit Margins | 0.03624 |
| Shares Outstanding | 10,334,000,128 | Shares Short | 84,850,391 | Held Percent Insiders | 9.623% |
| Held Percent Institutions | 61.737996% | Short Ratio | 1.81 | Short Percent of Float | 1.09% |
| Price to Book | 9.104048 | Earnings Quarterly Growth | 2.44 | Net Income to Common | $20,078,999,552 |
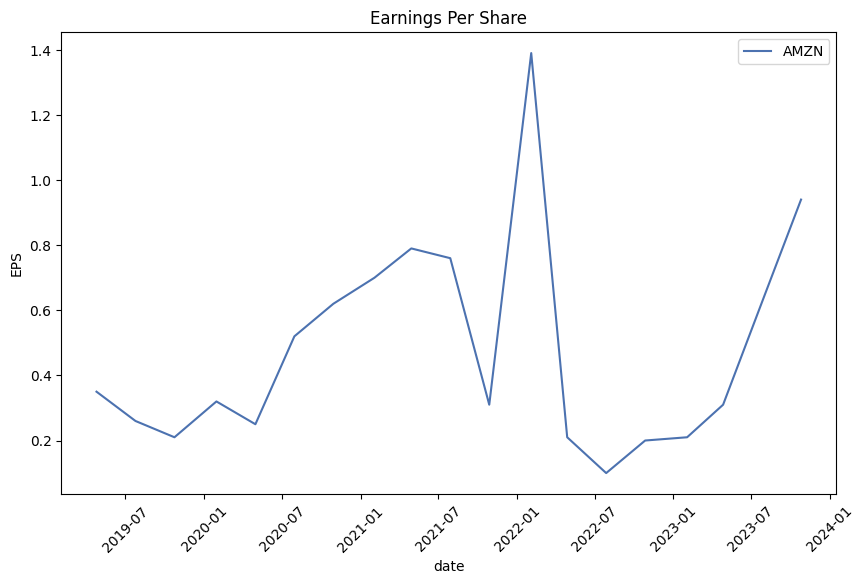
| Trailing EPS | $1.94 | Forward EPS | $3.63 | PEG Ratio | 0.68 |
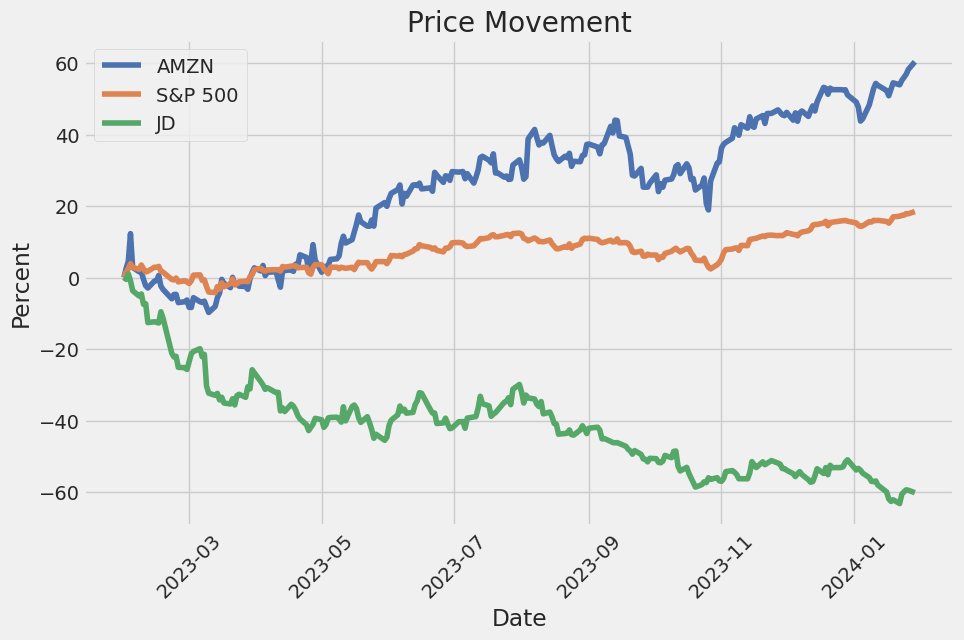
| Enterprise to Revenue | 3.192 | Enterprise to EBITDA | 23.904 | 52 Week Change | 56.36575% |
| Total Cash | $64,169,000,960 | Total Debt | $166,064,996,352 | Total Revenue | $554,027,974,656 |
| Debt to Equity | 90.759 | Revenue Per Share | $53.946 | Return on Assets | 0.03612 |
| Return on Equity | 0.12531 | Free Cash Flow | $36,392,374,272 | Operating Cash Flow | $71,653,998,592 |
| Gross Margins | 46.243998% | EBITDA Margins | 13.352999% | Operating Margins | 7.819% |
| Sharpe Ratio | -11.2283 | Sortino Ratio | -185.0262 |
| Treynor Ratio | 0.3407 | Calmar Ratio | 3.0869 |
Technical Analysis Overview:
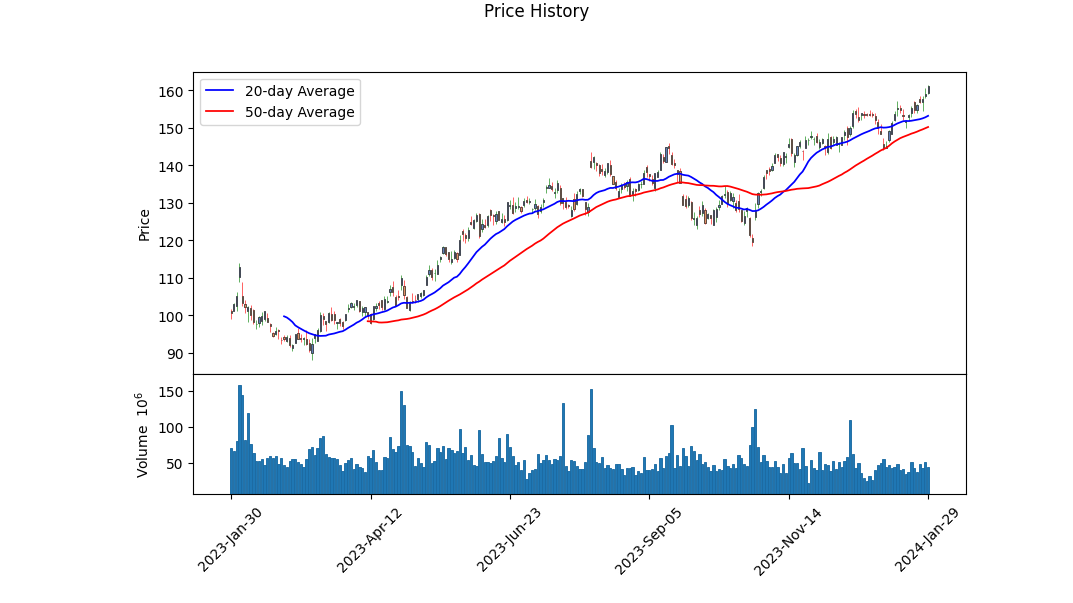
Analyzing the price movement and trading volume through the On-Balance Volume (OBV), we observe a positive divergence developing over the last few months, as evidenced by the upward trend in the OBV from 4.80297 million to 75.82034 million. This indicator suggests growing bullish interest, as price rises are supported by increasing volume.
The Moving Average Convergence Divergence (MACD) histogram value on the last day indicates an uptrend momentum, as the histogram value has increased to 0.586618. This movement further corroborates the positive outlook portrayed by the OBV indicator.
Fundamental Analysis:
The fundamental analysis reveals strong gross margins at 46.244%, indicating that the company is effectively controlling its costs relative to its revenue. EBITDA margins of 13.353% and operating margins of 7.819% paint a picture of healthy operational efficiency.
Nonetheless, the company has reported a net loss from continued operations, as reflected in the net income figures, and an uptick in total liabilities as compared to 2020. Despite this, the company has a robust tangible book value of $125.755 billion, signaling a strong balance sheet foundation.
Considering the earnings and revenue estimates, analysts have a favorable outlook, forecasting an earnings increase to $3.63 next year and a revenue estimate of $635.83 billion. This anticipated growth, coupled with a significant 35.40% growth prediction next year, suggests confidence in the company's potential to expand its earnings.
Cash Flow and Financial Health:
While free cash flow has been negative, indicating significant investments or spending, there's evidence of proactive debt management through a mix of repayments and issuances. Additionally, the company reported a solid end cash position, providing it with liquidity to support operations and strategic initiatives.
Risk-Adjusted Performance Ratios:
The Sharpe, Sortino, and other ratios reflect a level of risk in the investment, with the Sharpe and Sortino ratios being especially adverse. However, the positive Treynor and Calmar ratios hint at favorable returns adjusted for market-related risk and downward market volatility, respectively.
Market Expectations and Scoring:
The analysts' earnings revisions show a positive sentiment with upgrades in estimates, supported by an Altman Z-Score of 4.7728 indicating a low likelihood of financial distress. The Piotroski Score of 6 falls in the grey zone, neither too weak nor exceptionally strong.
Forward-Looking Analysis:
Combining technical analysis with fundamentals and analyst expectations, the next few months could see a continuing upswing in AMZN's stock price. While risk indicators such as the Sharpe Ratio present caution, the strength demonstrated in balance sheet metrics, anticipation of earnings growth, and positive estimates set a foundation for potential price appreciation. However, investors must weigh these positives against the significant level of risks presented by the adverse risk ratios and keep an eye on cash flow and debt levels, acknowledging that stock performance may also be influenced by broader market and economic dynamics.
In our analysis of Amazon.com, Inc. (AMZN) based on Joel Greenblatt's methodology outlined in "The Little Book That Still Beats the Market," we have calculated the Return on Capital (ROC) and the Earnings Yield for the e-commerce and tech giant. The Return on Capital (ROC), at 3.9859%, provides a measure of the efficiency with which Amazon employs its capital to generate profits. Although positive, this figure suggests that Amazon's return on invested capital is modest, and investors may expect a similar level of performance from other investments with a similar risk profile. On the other hand, the Earnings Yield, which is calculated as the inverse of the Price-to-Earnings (P/E) ratio, is currently negative at -0.1674%. This implies that the company has reported negative earnings relative to its share price, a warning sign that investors may be overvaluing the stock, or it may reflect a temporary downturn in profitability. When considering both of these metrics within the framework of Greenblatt's investment approach, caution is advised, as Amazon does not exhibit the high ROC and high Earnings Yield criteria that typically signify an undervalued stock with efficient operations.
Based on the provided metrics for Amazon.com, Inc. (AMZN), we can analyze how the company stands in relation to Benjamin Graham's value investing criteria:
1. Price-to-Earnings (P/E) Ratio: The P/E ratio of 93.76 is significantly higher than what Graham typically preferred. Graham was known for looking for a P/E ratio that was below the industry average or below 15, indicating that the stock may be undervalued. Amazon's high P/E ratio suggests that the stock is priced at a premium relative to its earnings, which would not meet Graham's criteria for value investment.
2. Price-to-Book (P/B) Ratio: Amazon's P/B ratio is 3.60, which means the market value is 3.6 times its book value. Graham often looked for a P/B ratio of less than 1.5. By that standard, Amazon appears overvalued from a Graham perspective.
3. Debt-to-Equity Ratio: Amazon's debt-to-equity ratio of approximately 0.96 suggests that the company is using nearly as much debt as equity in its capital structure. While this is not excessively high, Graham typically preferred a lower debt-to-equity ratio, ideally below 0.5, to ensure a lower financial risk.
4. Dividend History: According to the provided data, Amazon does not have a history of dividend payments. Graham favored companies with a consistent history of paying dividends as a sign of financial stability and shareholder-conscious management. In this regard, Amazon would not align with Graham's preference for stock selection.
Given the key metrics provided, Amazon.com, Inc. does not seem to fit Benjamin Graham's criteria for a value investment. Its high P/E ratio, P/B ratio, and lack of a dividend history, in particular, would likely lead Graham to exclude Amazon from consideration for a defensive or conservative portfolio.
Furthermore, because Amazon does not pay dividends, investors in the company do not receive direct income through dividend payments, which was an important aspect of investment income for Graham's strategy. However, it's essential to note that Graham's criteria were developed during an era significantly different from todays tech-driven market, where growth stocks often trade at higher valuation multiples and may not pay dividends.
For modern investors who adhere to Graham's principles, these metrics would be a signal to proceed with caution or potentially avoid the stock. However, for investors with a different investment philosophyparticularly those focused on growth rather than valueAmazon's lack of alignment with Graham's criteria might not be a deterrent.
| Alpha | 0.0066 |
| Beta | 1.0810 |
| R-squared | 0.417 |
| Adj. R-squared | 0.417 |
| F-statistic | 897.5 |
| Prob (F-statistic) | 3.49e-149 |
| Log-Likelihood | -2,435.0 |
| AIC | 4,874 |
| BIC | 4,884 |
| No. Observations | 1,256 |
| Df Residuals | 1,254 |
| Df Model | 1 |
The linear regression model analysis of AMZN (Amazon) against SPY (a proxy for the S&P 500 index and the overall market) suggests that Amazon's returns have a positive but less than perfect correlation with the market. An R-squared value of 0.417 indicates that approximately 41.7% of the variance in Amazon's stock returns can be explained by the SPY index returns. The beta coefficient of the model is 1.0810, suggesting that for every 1% change in the SPY index, Amazon's stock is expected to change by about 1.081%. This implies a slightly higher volatility than the market.
Alpha, which measures the return on an investment relative to the return predicted by the market movement, is 0.0066 (or 0.66%) for the period ending today. This alpha value suggests that Amazon has a small, positive performance above what would be anticipated by its relationship to the overall market as represented by SPY. Nonetheless, the statistical significance of this alpha is low, with a p-value of 0.889, indicating that the alpha is not significantly different from zero at the conventional confidence levels and might not be a reliable indicator of excess returns over the market.
Amazon Q3 2023 Earnings Call Summary
Introduction: The earnings call for Amazon's third-quarter 2023 financial results was led by Dave Fildes, the Vice President of Investor Relations, with CEO Andy Jassy and CFO Brian Olsavsky participating. The call involved forward-looking statements and covered non-GAAP financial measures, with a press release, slides, and SEC filings available for reference.
Financial Highlights: Revenue for Q3 reached $143.1 billion, an 11% increase year-over-year. Operating income significantly rose by 343% year-over-year to $11.2 billion, and the trailing 12-month free cash flow adjusted for equipment finance leases was up by $41.7 billion compared to the previous year. The company has made strides in lowering the cost to serve and enhancing customer experiences while continuing to invest for future growth.
Operational Improvements: A notable change in Amazon's operations was transitioning the U.S. from a single national fulfillment network to 8 distinct regions, resulting in smoother execution and impactful benefits than anticipated. This regionalization has led to faster delivery times, lower costs, and substantial growth in consumables and daily essentials, as customers receive their shipments more quickly. The company is fine-tuning placement algorithms for in-region fulfillment and making inbound process improvements, further optimizing cost and speed, which is ongoing work.
AWS and Generative AI Investments: AWS reached a revenue growth of 12% year-over-year in Q3, with a revenue run rate of $92 billion. The growth rate stabilized in Q3 despite elevated cost optimization from companies facing an uncertain economy. There have been promising signs of deal closures increasing, particularly in September. Generative AI remains a focal point, with substantial investments in several layers, including custom silicon chips like Trainium and Inferentia. Amazon introduced Amazon Bedrock for accessible large language models, and their coding companion CodeWhisperer has been well received. These advancements in generative AI are expected to become a significant source of revenue for AWS, with the potential to redefine customer experiences.
Future Initiatives and Growth Areas: Beyond AWS, Amazons significant businesses are exploring generative AI to transform customer interactions. Prime Video, now seen as both a valuable Prime offering and a stand-alone profitable venture, is set to include limited advertisements. Progress was seen in international store experiences, the Buy with Prime feature, and the comprehensive Supply Chain by Amazon services. In healthcare, Amazon Pharmacy introduced new models to provide more affordable care. Project Kuiper, their LEO satellite initiative, marked progress with recent prototype satellite launches. The company is preparing for the holiday season with a goal to make it convenient for customers and drive shareholder value.
Summary:
CFO Olsavsky highlighted robust performance with record worldwide operating income. Improvements have manifested across all segments, driven by reducing costs to serve, growing advertising, and leveraging fixed costs. The international segment is nearing breakeven, showing substantial improvements. Lastly, capital investments have decreased compared to the prior year period, with AWS expected to capitalize on future cloud and generative AI opportunities. The Q&A session focused on trends in AWS, the benefits of the regional fulfillment strategy, the potential of generative AI, and the continued growth of the advertising business.
Amazon.com, Inc.'s ("Amazon" or the "Company") 10-Q filing for the third quarter ending September 30, 2023, demonstrates the Company's performance and provides insights into its financial condition.
For Q3 2023, Amazon's net sales increased by 13%, while for the nine months ending September 30, 2023, sales were up by 11% compared to the same periods in the previous year. Despite global economic uncertainties, including inflation, changing interest rates, geopolitical events, and concerns around a potential recession, Amazon's consumer demand remains resilient. Foreign exchange rates positively impacted net sales by $1.4 billion for Q3 2023 and had an overall adverse influence of $1.3 billion for the nine months ended September 30, 2023. Operating income grew significantly, from $2.5 billion in Q3 2022 to $11.2 billion in Q3 2023, and from $9.5 billion to $23.6 billion for the nine-month period, demonstrating Amazon's increased profitability.
The North America segment exhibited an 11% growth rate for both Q3 and the nine-month period in 2023, primarily due to increased sales, advertising sales, and subscription services, offset by higher shipping and fulfillment costs. International sales increased to 16% for Q3 2023 and 9% for the nine-month period, driven by similar factors. Interestingly, AWS (Amazon Web Services) sales increased by 12% in Q3 2023 and 13% over the nine months, highlighting growing customer usage and cost structure improvements, though offset by investments to support business expansion.
Operating expenses saw growth due to higher product and shipping costs, salary expenses, and investments in technology infrastructure. Despite that, operating income improved across all three of Amazon's reported segments. The Company also took significant non-operating income from its equity investment in Rivian Automotive, Inc., affecting its results positively in Q3 and the nine-month periods of 2023.
Cash flow from operations rose substantially, reaching $21.2 billion in Q3 2023 and $42.5 billion for the nine-month period, compared to $11.4 billion and $17.6 billion for the comparable periods in 2022. This reflects a solid ability to generate internal funds. Cash capital expenditures decreased, signaling a strategic reduction in spending, particularly on fulfillment networks.
Amazon provided guidance for Q4 2023 with net sales expected to range between $160.0 billion and $167.0 billion, representing a growth rate between 7% and 12% relative to Q4 2022. Operating income for Q4 2023 is projected to fall between $7.0 billion and $11.0 billion, compared to $2.7 billion in Q4 2022. This guidance assumes no significant business acquisitions, restructurings, or legal settlements.
Overall, Amazon's strong financial performance is evident, with substantial growth in sales, operating income, and cash flow from operations. The rise in profitability from its North America and AWS segments and the expanding international footprint, despite the challenging global economic conditions, reflect the Company's resilience and ability to sustain growth. Amazon's investments in technology and infrastructure also demonstrate a commitment to long-term growth, supported by sound execution and efficient capital allocation. The guidance for the fourth quarter suggests continued confidence in the Company's ability to grow and deliver value to stakeholders.
Amazon.com, Inc. continues to disrupt the media landscape with its evolving strategy in sports broadcasting. The company is reportedly engaged in discussions with Diamond Sports Group for a potential strategic investment and a multi-year streaming partnership, actions that would see Amazon Prime Video become the official streaming platform for Diamonds games. As Diamond Sports Group navigates through Chapter 11 bankruptcy, this partnership could serve as a crucial respite to avoid liquidation and restructure their operations successfully.
This move by Amazon reflects a broader trend of tech giants, such as Apple and Google, venturing into the sports broadcasting domain. These companies are leveraging sports to penetrate deeper into consumer households and integrate their products and services into a synergistic ecosystem. Amazon stands to capitalize substantially on localized sports broadcasts, targeting markets traditionally catered to by regional sports networks, which have been challenged financially in recent times.
The prospect of an Amazon and Diamond partnership signifies a shift in the approach to sports viewership from traditional cable networks to streaming platforms. This remains a potential win-win for both entities, as it could solidify Amazons position in sports broadcasting while offering Diamond Sports Group a lifeline amidst financial struggles. The initial reaction from financial markets was positive, with shares of both Amazon and Sinclair Broadcasting Group (owner of Diamond Sports Group) experiencing a rise following the news.
Beyond broadcasting, Amazon also bears the resemblance of an investment magnet. Wall Street analyst Ronald Josey from Citigroup has labeled Amazon a "Top Pick" for 2024, setting a price target that forecasts a 37% upside potential. This bullish sentiment is echoed across other analysts, with mentions of Amazon's efficiency improvements and growth prospects expected from decelerating inflation and potential Federal Reserve rate stabilizations. Amazons ventures into generative AI, like Amazon Q, its AI-powered digital assistant, symbolize its continuous innovation. Furthermore, the companys stock valuation appears attractive, trading below its five-year average of 3.5 times sales, potentially rendering it a worthwhile investment.
Amazons growing influence in sports broadcasts has been a subject of discussion by experts like Tom Rogers, Founder of CNBC and Editor at Large. Regional sports contracts, vital for local teams revenue, are under duress, putting Amazon in a position where a partnership can avert the collapse of this niche market. The unpredictable nature of bankruptcy court proceedings plays a vital role here. Yet, there is also anticipation for reshaped national sports packages that could integrate streaming more comprehensively. Amazon may emerge as a key stabilizer in the regional sports market, with potential effects on the structure and pricing of streaming packages nationwide.
The latter part of 2023 witnessed Amazon overcome a challenging phase from the previous year, with the company's stock recovering and growing by nearly 80%. The motivation for this surge includes cost-cutting measures, closures of unprofitable ventures, and workforce reductions. In the third quarter of 2023, revenue and operating incomes reported positive rebounds. Amazons prospects appear further buoyed by its preeminent position in online retail and the AWS division in the AI market. Industry forecasts suggest that Amazon's earnings could grow robustly, supporting the assessment that its stock remains an attractive proposition for investment.
Amazon and Shopify, two leading forces in e-commerce, have been contrasted in an investor's portfolio. Despite their similar operational domain, both companies represent distinct investment theses. Shopify's growth outpaced Amazon in terms of percentage gains, yet both contributed equally to portfolio growth, showcasing the strength of portfolio diversification.
With the market showing signs of renewal in 2024, Amazon is considered by some analysts to have a competitive edge for continued success. Factors like a transition towards service-based business models, indication of increased earnings performance, and valued stock pricing suggest Amazon may not only sustain but potentially enlarge its market presence. Moreover, Amazons engagement in the burgeoning AI sphere points to an influential role as AI technologies become vital across various industry applications. Despite this, comparisons with competitors like Alphabet shed light on the complex dynamics of valuation and industry growth potential, suggesting nuanced investing perspectives.
Within the context of large-cap stocks, predictions by analyst Alex Haissl place Amazon as a strong candidate for significant stock price appreciation, driven by the growth of AWS and other secondary segments, such as advertising and Prime subscriptions. Amazons valuation, when viewed in terms of future cash flow, adds to the appeal for investors as the company maintains a lead in market capitalization among tech giants.
As 2024 approaches, investors are also encouraged to seize timely opportunities rather than rely on calendar-based investment effects such as the January Effect. Focusing on companies like Amazon, with their forward earning estimates and value propositions, can yield significant long-term payoffs.
In sum, Amazons strategic pivots, growth in AI and cloud services, and continuous diversification across sectors underline its resilience and capacity for further ascension. While Amazon remains at the forefront of industry innovation, the stock market continues to register confidence in the tech giant's long-term potential, further attracting investors to consider Amazon and related tech sectors for added variety and strength in their investment portfolios.
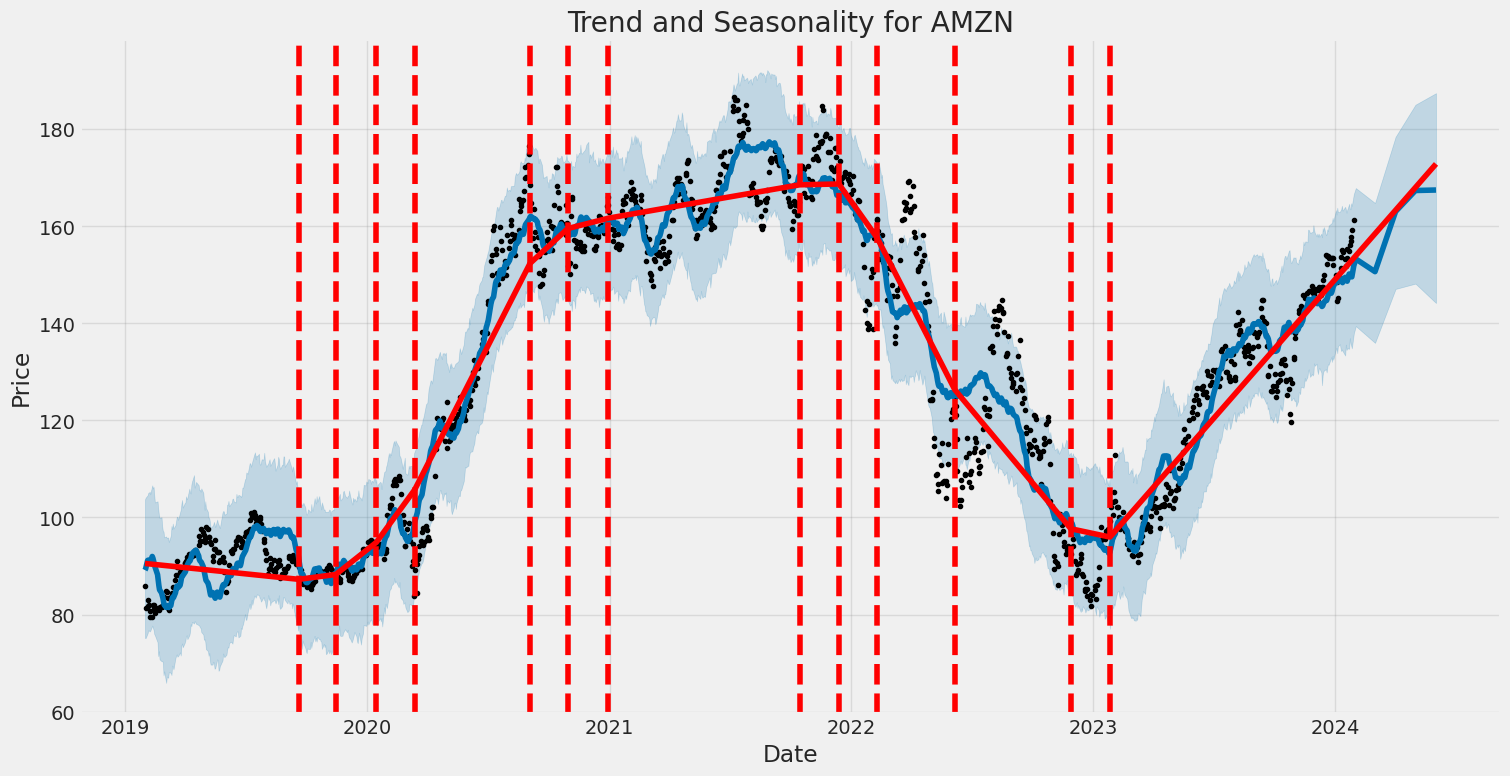
Over the period from January 2019 to January 2024, the volatility of Amazon.com, Inc. (AMZN) stock price returns appears to be significant, as modeled by the ARCH framework. The 'omega' coefficient, which is a baseline level of volatility, is notably large at 3.4487, indicating that the returns have a considerable amount of inherent variation. In addition, the 'alpha[1]' coefficient, which measures the impact of the previous time period's return on current volatility, is 0.3100, signifying a high degree of autoregressive volatility, meaning that past large changes in the stock price tend to predict future large changes.
| Statistic | Value |
|---|---|
| Mean Model | Zero Mean |
| R-squared | 0.000 |
| Adj. R-squared | 0.001 |
| Log-Likelihood | -2723.09 |
| AIC | 5450.18 |
| BIC | 5460.45 |
| No. Observations | 1256 |
| Df Residuals | 1256 |
| Variance (omega) | 3.4487 |
| Alpha[1] | 0.3100 |
To analyze the financial risk of a $10,000 investment in Amazon.com, Inc. over a one-year period, a combination of volatility modeling and machine learning predictions was employed. Volatility modeling is essential in understanding the inherent fluctuations in the stock price of Amazon, which directly affects the uncertainty and the risks involved in the investment.
In this context, volatility modeling is used to estimate the changing levels of volatility over time. Specifically, this method allows for estimating conditional volatility based on past information, which is a fundamental aspect of financial time series analysis. By using time-series data of Amazon's stock prices, this model captures the persistence and the potential clustering of volatility, providing a dynamic and updated view of risk.
Machine learning predictions augment this financial analysis by employing a predictive algorithm capable of analyzing complex patterns within the historical data to forecast future returns. By feeding historical price data and relevant financial indicators into the machine learning algorithm, it generates predictions about Amazon's future stock performance. These predictions take into account the various interactions between multiple features, making the forecast more robust than traditional univariate time-series forecasts.
Focusing on the VaR at a 95% confidence interval for the investment in question, the calculation of $311.88 represents the maximum expected loss over a one-year period, under normal market conditions. This means that there is only a 5% chance that the investment will lose more than $311.88 over the next year. This figure provides investors with a quantitative risk estimate, helping in the evaluation of whether the potential returns of investing in Amazon are worth the level of risk taken.
The integration of volatility modeling and machine learning predictions provides a comprehensive view of the equity investment's risk profile. By capturing the dynamic nature of Amazon's stock volatility and employing advanced forecasting techniques, the investor gains a nuanced understanding of the potential financial risks involved. These analytical tools enable the anticipation of various market conditions and equip investors with a data-informed strategy for managing their portfolios.
Similar Companies in Internet Retail:
JD.com, Inc. (JD), PDD Holdings Inc. (PDD), Sea Limited (SE), Report: MercadoLibre, Inc. (MELI), MercadoLibre, Inc. (MELI), Alibaba Group Holding Limited (BABA), Vipshop Holdings Limited (VIPS), Jumia Technologies AG (JMIA), Global-e Online Ltd. (GLBE), Etsy, Inc. (ETSY), Report: Walmart Inc. (WMT), Walmart Inc. (WMT), eBay Inc. (EBAY), Report: Target Corporation (TGT), Target Corporation (TGT), Report: Costco Wholesale Corporation (COST), Costco Wholesale Corporation (COST), Alphabet Inc. (GOOGL), Report: Apple Inc. (AAPL), Apple Inc. (AAPL), Microsoft Corporation (MSFT), Report: Netflix Inc. (NFLX), Netflix Inc. (NFLX), Best Buy Co., Inc. (BBY), Salesforce.com Inc. (CRM)
https://www.youtube.com/watch?v=GCC_0SoyFiA
https://www.fool.com/investing/2023/12/19/reasons-amazon-stock-could-extend-rally-in-2024/
https://www.fool.com/investing/2023/12/19/better-artificial-intelligence-ai-stock-alphabet-v/
https://www.fool.com/investing/2023/12/19/2-reasons-to-buy-amazon-stock-like-theres-no-tomor/
https://www.youtube.com/watch?v=oixdcIjXoDA
https://www.fool.com/investing/2023/12/19/my-6-largest-portfolio-holdings-heading-into-2024/
https://www.youtube.com/watch?v=4NEZeH7uGJY
https://www.fool.com/investing/2023/12/20/3-faang-stocks-30-to-53-upside-in-2024-wall-street/
https://www.fool.com/investing/2023/12/20/is-amazon-stock-a-smart-buy-before-the-end-of-2023/
https://www.fool.com/investing/2023/12/20/best-stocks-to-buy-for-2024-wall-street-amazon/
https://www.fool.com/investing/2023/12/21/better-growth-stock-for-2024-amazon-vs-shopify/
https://www.fool.com/investing/2023/12/22/3-magnificent-seven-stocks-50-to-122-upside-2024/
https://www.fool.com/investing/2023/12/22/i-beg-you-to-buy-stocks-before-january-heres-why/
https://www.fool.com/investing/2023/12/22/up-over-80-is-amazon-stock-a-buy-for-2024/
https://www.fool.com/investing/2023/12/22/1-stock-down-nearly-59-that-wall-street-expects/
https://www.sec.gov/Archives/edgar/data/1018724/000101872423000018/amzn-20230930.htm
Copyright © 2024 Tiny Computers (email@tinycomputers.io)
Report ID: 1X7pLX
Cost: $1.18054
https://reports.tinycomputers.io/AMZN/AMZN-2024-01-30.html Home