Outokumpu Oyj (ticker: OUTKY)
2024-02-05
 Outokumpu Oyj, trading under the ticker OUTKY, is a prominent force in the global stainless steel industry, headquartered in Finland. The company specializes in the production of various stainless steel grades, including austenitic, ferritic, and duplex steels, which are crucial for a wide array of applications across industries such as automotive, construction, appliances, and more. Outokumpu's operations encompass a comprehensive value chain from raw material extraction through to stainless steel production, benefiting from advanced technologies and a commitment to sustainability. This strategic focus not only enhances their market resilience but also positions Outokumpu as a leader in the circular economy, emphasizing recycling and efficient material use. Financial performance, market trends, and strategic investments are key aspects monitored by investors and analysts, with Outokumpu's initiatives in innovation and environmental stewardship playing pivotal roles in shaping the company's future trajectory within the competitive landscape of the steel manufacturing sector.
| Address | Salmisaarenranta 11 | City | Helsinki | Zip Code | 00180 |
| Country | Finland | Phone | 358 9 4211 | Website | https://www.outokumpu.com |
| Industry | Steel | Sector | Basic Materials | Full Time Employees | 8,512 |
| Previous Close | 2.165 | Open | 2.22 | Day Low | 2.165 |
| Day High | 2.165 | Dividend Rate | 0.19 | Dividend Yield | 0.088599995 |
| Payout Ratio | 0.3784 | Beta | 1.296 | Volume | 66 |
| Market Cap | 1,845,993,728 | Fifty Two Week Low | 1.88 | Fifty Two Week High | 3.0 |
| Price to Sales Trailing 12 Months | 0.25139502 | Two Hundred Day Average | 2.48425 | Trailing Annual Dividend Rate | 0.25 |
| Trailing Annual Dividend Yield | 0.11547344 | Enterprise Value | 968,248,768 | Profit Margins | 0.06142 |
| Book Value | 9.531 | Price to Book | 0.2271535 | Net Income to Common | 442,000,000 |
| Trailing EPS | 0.5 | Enterprise to Revenue | 0.132 | Enterprise to EBITDA | 1.992 |
| Total Cash | 367,000,000 | Total Debt | 396,000,000 | Total Revenue | 7,343,000,064 |
| Operating Cashflow | 378,000,000 | Revenue Growth | -0.345 | Gross Margins | 0.08321 |
| EBITDA Margins | 0.06619 | Operating Margins | -0.030050002 | Free Cashflow | 490,624,992 |
| Sharpe Ratio | -0.10733172809144186 | Sortino Ratio | -0.9201994735236418 |
| Treynor Ratio | -2.6579019402950776 | Calmar Ratio | -0.2955592801163259 |
Evaluating the financial outlook and stock price movement potential for OUTKY over the coming months necessitates a multifaceted examination of technical indicators, fundamental analysis, and balance sheet data. At the forefront, a discerning look at the technical indicators reveals a nuanced tale of upcoming price dynamics. The On Balance Volume (OBV) metric, pivotal for appreciating the trading momentum underlying the stock, shows notable fluctuations. An initial phase of positive accumulation, peaking on -0.01282 in million, undergoes a reversal, with a subsequent downtrend settling at -0.01976. This volatility in OBV suggests a contested equilibrium between buying and selling forces, which can be a critical precursor to wider price movements.
The Moving Average Convergence Divergence (MACD) histogram, another cornerstone of technical analysis, moves from an ambiguous absence of signal to a slight positive uptick, revealing a budding momentum that might hint at proceeding bullish undertones. A move from absence to a positive 0.000429 signals a transition from neutrality to a faint but growing optimism among market participants regarding OUTKY's future performance.
On the fundamental side, specific metrics stand out. The operating margins and gross margins reveal a business grappling with costs but still maintaining a level of profitability. Coupled with a solid operational base, as evidenced by a robust normalized EBITDA and a substantial gross profit, OUTKY exhibits an inherent resilience and potential for sustenance and growth. Further bolstered by an overall positive net income in the face of adversity, OUTKY reflects underlying strengths which could translate to eventual market confidence and stock appreciation.
Financial resilience is further articulated in the balance sheet. Despite navigational challenges reflected in total revenues and conflictive liabilities, OUTKY shows a logical streamlining towards asset acquisition, cash equitability, and a rationalized approach towards debt and equity financing. This strategic financial stewardship indicates a path toward eventual consolidation and potential growth, reassuring for prospective and current investors alike.
The liquidity ratios, such as the Altman Z-Score (2.412426835985139) and the Piotroski Score (6), combine to affirm a stance of moderate financial health and resilience. These indicators, portraying a company's ability to meet its financial obligations and operational efficiency, underscore a narrative of calculated risk and principled financial management.
However, risk-adjusted return ratios including the Sharpe, Sortino, Treynor, and Calmar paint a more cautionary picture, reflecting a company navigating through volatility and inherent investment risk. Notably, negative ratios across the board signal unease amongst investors concerning the reward per unit of risk taken, necessitating attentive risk management and strategic planning.
Given these multifaceted analytical insights, OUTKY can anticipate variable yet cautiously optimistic stock price movements in the forthcoming months. The technical indicators, albeit showing early signs of positive momentum, coupled with a fundamentally strong underpinning and a careful navigation of financial health, posit a potential for gradual stock appreciation. This trajectory, however, remains tethered to prevailing market conditions, competitive actions, and broader economic indicators which could influence investor sentiment and market dynamics. Therefore, stakeholders might expect a cautiously optimistic horizon with a vigilant watch on unfolding operational and financial strategies undertaken by OUTKY.
In our analysis of Outokumpu Oyj (OUTKY), a prominent player in the steel manufacturing industry, we've meticulously calculated the financial metrics critical for investment considerations, specifically regarding The Little Book That Still Beats the Market's philosophy. The Return on Capital (ROC) for OUTKY stands impressively at 19.92%. This high ROC indicates that for every dollar invested in the capital, Outokumpu Oyj generates nearly 20 cents in profits, showcasing efficient use of its capital in operations and potentially lucrative for investors interested in the firm's operational effectiveness.
Furthermore, our examination reveals an extraordinarily high Earnings Yield of 58.20%, significantly surpassing common benchmarks in the market. This metric suggests that for every dollar invested in the purchase of OUTKY's stock, the investor could expect to earn approximately 58 cents in return, based purely on the company's current earnings. Such a high yield not only emphasizes Outokumpu Oyj's ability to generate substantial earnings compared to its stock price but also underscores the potential undervaluation of its shares, making it a potentially attractive investment opportunity.
Together, these figures solidify Outokumpu Oyj's standing as a potentially strong investment prospect, based on the criteria highlighted in The Little Book That Still Beats the Market, detailing both excellent capital efficiency and an attractive earnings return on investment.
Based on the calculations provided for Outokumpu Oyj (OUTKY) and evaluating them through the lens of Benjamin Graham's principles for stock screening from "The Intelligent Investor," here's an assessment of how OUTKY measures up against Graham's criteria:
- Margin of Safety:
-
The Price-to-Earnings (P/E) ratio of 3.732758620689655 is considerably low, suggesting that the stock might be undervalued, offering a potential margin of safety. Graham advocated for investing in undervalued stocks as a way to protect against errors in analysis or market downturns.
-
Price-to-Book (P/B) Ratio:
-
With a P/B ratio of 0.26414675200916515, OUTKY is trading significantly below its book value. This aligns with Graham's criterion of looking for stocks trading at a discount to their book value, as it may indicate that the stock is undervalued.
-
Debt-to-Equity Ratio:
- OUTKY's debt-to-equity ratio of 0.15343529983005583 indicates low financial risk, adhering to Graham's preference for companies with low leverage.
-
Current and Quick Ratios:
- The current and quick ratios both stand at 1.7097549255165785, demonstrating OUTKY's ability to cover its short-term liabilities with its short-term assets. This indicates financial stability, a criterion valued by Graham.
-
Dividend Record:
- OUTKY has a history of paying dividends, with fluctuations in the dividend amounts over the years. The most recent dividend payment shows an increase from previous years, which might appeal to Graham's preference for companies with a consistent history of dividend payments. However, the irregularity in the span of the years might require further investigation.
-
Earnings Growth:
-
Specific data on earnings growth is not provided; hence, it's challenging to evaluate OUTKY against Graham's criterion of preferring companies that show consistent earnings growth over the years.
-
Price-to-Earnings (P/E) Ratio Compared to Industry Peers:
- Although the P/E ratio for OUTKY is provided, there's an absence of industry-wide P/E ratio data for comparison. Graham often sought stocks with low P/E ratios relative to their industry peers as a measure of undervaluation.
In summary, Outokumpu Oyj (OUTKY) aligns with several of Benjamin Graham's investment principles, indicating potential as a value investment. The low P/E and P/B ratios suggest that the stock might be undervalued, presenting a margin of safety. The company's low debt-to-equity ratio and adequate liquidity ratios (current and quick ratios) reflect financial stability. However, the irregular dividend history and lack of explicit earnings growth and industry comparison data necessitate a more detailed review to fully comprehend OUTKY's investment profile in the context of Graham's methodology. Investors might also want to consider conducting further analysis or waiting for additional information before making investment decisions.
| Statistic Name | Statistic Value |
| R-squared | 0.006 |
| Adj. R-squared | 0.005 |
| F-statistic | 7.360 |
| Prob (F-statistic) | 0.00676 |
| Log-Likelihood | -3297.4 |
| No. Observations | 1256 |
| AIC | 6599 |
| BIC | 6609 |
| const (alpha) | 0.0658 |
| coef (beta) | 0.1943 |
| Std err | 0.094 |
| t | 2.713 |
| P>|t| | 0.007 |
| [0.025 | 0.054 |
| 0.975] | 0.335 |
| Omnibus | 413.627 |
| Prob(Omnibus) | 0.000 |
| Jarque-Bera (JB) | 80473.486 |
| Skew | 0.125 |
| Prob(JB) | 0.00 |
| Kurtosis | 42.213 |
| Cond. No. | 1.32 |
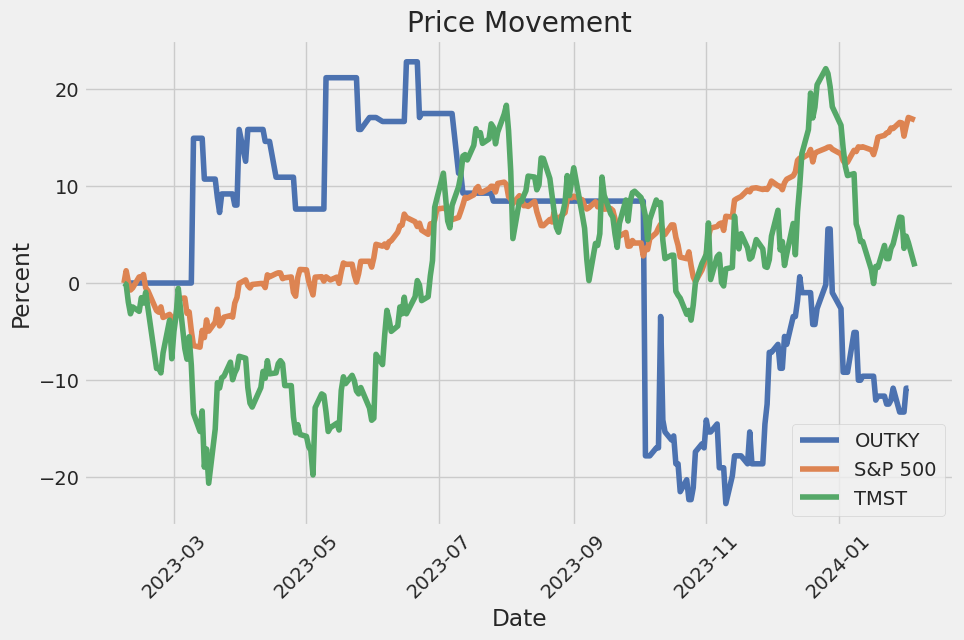
Analyzing the linear regression model between OUTKY and the SPY (which is a representation of the entire market), we observe a weak relationship with an R-squared value of 0.006. This suggests that only 0.6% of the variability in OUTKY's returns can be explained by the market's returns represented by SPY. The alpha for OUTKY, which is the intercept of the regression line measuring its performance independent of the market, is approximately 0.0658. This indicates that OUTKY's average return over the period was slightly positive when the market's return is zero, highlighting a modest standalone performance regardless of market movements.
The model's beta, or slope coefficient, of 0.1943 suggests a low level of sensitivity to market movements, indicating that OUTKY's returns are less affected by market swings compared to the average market asset. The statistical significance of the model is supported by a Prob (F-statistic) of 0.00676, indicating the relationship between OUTKY and SPY is statistically significant, albeit weakly. Although the model's overall explanatory power is minimal, the positive alpha value provides some evidence that OUTKY has the potential to generate returns independently of market trends, which could be valuable for investors seeking diversification or assets with performance less tied to the broader market movements.
Outokumpu Oyj, headquartered in Helsinki, Finland, stands as a global leader in stainless steel manufacturing, boasting a rich heritage that traces back to the discovery of the Otanmaki mine in the early 20th century. The company's evolution into a stainless steel pioneer is a testament to its commitment to innovation, technological advancement, and sustainable practices. Today, Outokumpu operates across a wide geographical footprint, with production facilities and sales offices scattered around the globe, serving industries ranging from automotive to construction with high-quality stainless steel products.
Outokumpus strategic approach focuses on leveraging its integrated production chain, from chrome and nickel mining to smelting and recycling, ensuring a steady supply of essential raw materials and fostering a circular economy. This integrated business model not only enhances operational efficiency but also minimizes environmental impact, aligning with the company's sustainability objectives.
The firm's commitment to innovation is evident in its product development and technological advancements. Outokumpu has been at the forefront of introducing high-performance stainless steel grades, which offer superior corrosion resistance, durability, and strength, catering to the demanding needs of various industrial applications. The companys R&D efforts are centered around enhancing material properties, optimizing manufacturing processes, and developing sustainable solutions, which have been crucial in maintaining its competitive edge in the market.
Sustainability is a core pillar of Outokumpus operational ethos. The company has set ambitious targets to reduce its carbon footprint and increase energy efficiency, aspiring to be the industry benchmark for environmental friendliness in stainless steel production. Through initiatives such as utilizing renewable energy sources, investing in energy-efficient technologies, and maximizing the use of recycled materials, Outokumpu demonstrates its commitment to minimizing the environmental impact of its operations.
The global stainless steel market is characterized by intense competition, fluctuating raw material prices, and varying demand across different sectors. Outokumpu, armed with its strategic priorities, innovative capabilities, and sustainability focus, navigates these challenges while seeking growth opportunities. The company invests in expanding its global presence, enhancing its product portfolio, and fostering partnerships to cater to the evolving needs of its customer base.
Financially, Outokumpu has shown resilience in the face of market volatilities. The company's financial strategy is centered on improving profitability, optimizing capital structure, and strengthening the balance sheet, aiming for sustainable growth and value creation for shareholders. By closely monitoring market trends, adjusting its operational strategies accordingly, and focusing on high-margin products and markets, Outokumpu aims to maintain its financial health and invest in future growth.
In conclusion, Outokumpu Oyj's journey from a mining company to a leading stainless steel manufacturer is a reflection of its adaptability, innovative spirit, and commitment to sustainability. As the company continues to navigate the complexities of the global market, its strategic focus on integration, innovation, sustainability, and financial stability positions it well to seize future opportunities and address the challenges of the stainless steel industry. With a legacy of over a century, Outokumpu remains dedicated to advancing the boundaries of stainless steel manufacturing, aiming to enhance its contribution to a sustainable and efficient future.
Outokumpu Oyj's (OUTKY) stock volatility from February 2019 to February 2024, as modeled by an ARCH model, can be summarized through observing changes in its asset returns, which show no clear pattern or ability to predict future movements effectively. The model highlights significant volatility, evidenced by an omega coefficient of 11.1944, indicating notable fluctuations in returns. Despite these large movements, the alpha[1] value of 0.000 suggests an unexpected lack of short-term serial correlation in volatility, denoting that past volatility does not predict future volatility in a straightforward manner.
| Statistic Name | Statistic Value |
|---|---|
| R-squared | 0.000 |
| Log-Likelihood | -3296.44 |
| AIC | 6596.89 |
| BIC | 6607.16 |
| No. Observations | 1255 |
| omega | 11.1944 |
| alpha[1] | 0.0000 |
When evaluating the financial risk associated with a $10,000 investment in Outokumpu Oyj (OUTKY) over a one-year period, the application of volatility modeling coupled with machine learning predictions offers an insightful approach. This analysis primarily incorporates volatility modeling to quantify the expected fluctuations in Outokumpu Oyj's stock price, and machine learning predictions to forecast future returns based on historical data patterns. The integration of these methodologies provides a multifaceted perspective on risk assessment, enabling a more accurate anticipation of potential investment outcomes.
Volatility modeling stands as a pivotal component in understanding the inherent risk of stock investments by quantifying the degree of price variability over time. In the context of Outokumpu Oyj, this approach employs historical stock price data to model potential future volatility, serving as a robust indicator of the risk level associated with the stock's price movements. It allows for the projection of future price fluctuations based on past trends, facilitating a dynamic assessment of investment risk over the specified one-year timeframe.
Complementing volatility modeling, machine learning predictions leverage historical data to forecast future returns of Outokumpu Oyj's stock. By utilizing a model that learns from patterns and relationships within past price data, it can make informed predictions about future stock behavior. This methodology is instrumental in identifying potential returns on the investment, thereby providing a comprehensive view of both the expected returns and the associated risks.
A critical metric derived from this integrated analysis is the Value at Risk (VaR) at a 95% confidence interval. For a $10,000 investment in Outokumpu Oyj, the VaR is calculated to be $482.10. This figure represents the maximum expected loss over a one-year period, with 95% confidence. In practical terms, it suggests that there's a 5% chance that the investment could lose more than $482.10 over the said period, under normal market conditions. This metric serves as a valuable risk assessment tool, quantifying potential losses and offering investors a clearer understanding of the financial risk involved.
The implementation of volatility modeling and machine learning predictions, therefore, provides a comprehensive analysis of the financial risk associated with investing in Outokumpu Oyj. By examining both the volatility of the stock and predicting future returns, investors are equipped with a nuanced understanding of the potential risks and rewards. The calculated VaR further enhances this analysis by quantifying the investment's exposure to risk, offering a tangible measure to guide decision-making processes.
Similar Companies in Steel:
TimkenSteel Corporation (TMST), Companhia Siderurgica Nacional (SID), Report: Olympic Steel, Inc. (ZEUS), Olympic Steel, Inc. (ZEUS), Universal Stainless & Alloy Products, Inc. (USAP), Usinas Siderurgicas de Minas Gerais S.A. (USNZY), POSCO Holdings Inc. (PKX), Report: Reliance Steel & Aluminum Co. (RS), Reliance Steel & Aluminum Co. (RS), Report: ArcelorMittal (MT), ArcelorMittal (MT), Report: Nucor Corporation (NUE), Nucor Corporation (NUE), Report: United States Steel Corporation (X), United States Steel Corporation (X), Report: Steel Dynamics, Inc. (STLD), Steel Dynamics, Inc. (STLD)
Copyright © 2024 Tiny Computers (email@tinycomputers.io)
Report ID: A5sP12
Cost: $0.11891
https://reports.tinycomputers.io/OUTKY/OUTKY-2024-02-05.html Home