Telefonica, S.A. (ticker: TEF)
2024-02-04
 Telefonica, S.A., trading under the ticker symbol TEF, stands as a global telecommunications powerhouse with a significant presence in Europe, Latin America, and other international markets. Established in Spain, the corporation has expanded its operational reach across various continents, providing a wide array of services including fixed-line and mobile telephony, broadband, and digital television. Telefonica has consistently been at the forefront of technological innovation, investing heavily in 5G networks and digital transformation strategies aimed at enhancing connectivity and digital services for millions of consumers and businesses worldwide. The company's financial performance and strategic acquisitions reflect its commitment to maintaining a competitive edge in the highly dynamic telecom sector. With its focus on sustainable growth and digital empowerment, Telefonica continues to play a pivotal role in shaping the future of global telecommunications.
| City | Madrid | Country | Spain | Phone | 34 900 11 10 04 |
| Website | https://www.telefonica.com | Industry | Telecom Services | Sector | Communication Services |
| Full Time Employees | 103,651 | CEO & Executive Chairman Name | Mr. Jose Maria Alvarez-Pallete Lopez | CEO & Executive Chairman Pay | 6,621,393 |
| COO & Executive Director Name | Mr. Angel Vila Boix | COO & Executive Director Pay | 4,900,839 | Chief Financial and Control Officer Name | Ms. Laura Abasolo Garcia de Baquedano |
| Chief Technology & Information Officer Name | Mr. Enrique Blanco | Previous Close | 4.09 | Open | 4.05 |
| Day Low | 3.99 | Day High | 4.055 | Dividend Rate | 0.32 |
| Dividend Yield | 0.0808 | Payout Ratio | 1.1121 | Five Year Avg Dividend Yield | 8.47 |
| Beta | 0.685 | Trailing PE | 13.793104 | Forward PE | 13.793104 |
| Volume | 732,240 | Market Cap | 23,130,400,768 | Fifty Two Week Low | 3.69 |
| Fifty Two Week High | 4.53 | Price to Sales Trailing 12 Months | 0.56678265 | Trailing Annual Dividend Rate | 0.3 |
| Trailing Annual Dividend Yield | 0.07334963 | Enterprise Value | 67,970,998,272 | Profit Margins | 0.04379 |
| Shares Outstanding | 5,750,459,904 | Shares Short | 2,905,886 | Book Value | 4.521 |
| Price to Book | 0.88476 | Earnings Quarterly Growth | 0.091 | Net Income to Common | 1,542,000,000 |
| Trailing EPS | 0.29 | Forward EPS | 0.29 | Total Cash | 7,818,999,808 |
| Total Debt | 47,056,998,400 | Debt to Equity | 148.51 | Total Revenue | 40,810,000,384 |
| Return on Assets | 0.017549999 | Return on Equity | 0.06528 | Operating Cashflow | 12,403,000,320 |
| Statistic Name | Statistic Value | Statistic Name | Statistic Value |
| Sharpe Ratio | 0.607984115991839 | Sortino Ratio | 8.534442314562277 |
| Treynor Ratio | 0.23350310674864608 | Calmar Ratio | 1.174572700893262 |
Analyzing the Technical Analysis, Fundamental, and Balance Sheet data for TEF, several key observations present opportunities and challenges underlying its anticipated market behavior in the upcoming months.
The conclusion drawn from the Technical Indicators notices a mixed sentiment with an evolving MACD that started transitioning from a blank state to negative territories from January 29th to February 2nd. This suggests a potential bearish divergence, highlighting short to medium-term selling pressures could be on the horizon. Specifically, the negative trend in the MACD histogram implies a loss in bullish momentum. Coupled with OBV (On-Balance Volume) which exhibits a downward trend towards the end of the period, it signifies lesser buying volumes, possibly hinting at a weakening buyer's interest or growing seller's momentum over the corresponding period.
On the fundamental specter, TEFs fundamentals overlay a comprehensive perspective. The reported Gross Margins and EBITDA Margins are noteworthy, reflecting a robust operational framework capable of yielding substantial profits. Despite a commendable operational margin, the absence of a Trailing PE Ratio evokes contemplation about earnings translation into shareholder value, which could be a vital determinant in influencing investor sentiment. Additionally, the fundamentals underscore the companys domicile, which could subject it to geopolitical and currency risks, potentially impacting its stock price movements.
Balance Sheet and Cash Flow Statements pose an intriguing contrast. A decreasing Net Debt scenario from 2020 to 2022 pledges a reducing leverage risk, depicting a strong emphasis on financial health. However, scrutinizing the Cash Flow aspects reveals a plunge in Free Cash Flow over the same period, possibly indicating extensive capital expenditures or an aggressive debt repayment strategy. The insights levy a potential friction in liquidity over a short tenure but signal a healthier long-run trajectory.
The notable financial ratios such as the Sharpe, Sortino, Treynor, and Calmar ratios offer a quantitative testament to the risk-adjusted returns TEF has provided to its investors. Despite differing in their measure of risk, all ratios collectively indicate that TEF has historically offered a reasonable compensation for the risk undertaken by the investors. The high Sortino Ratio, in particular, reveals that TEF has efficiently managed downside risks, amplifying the attractiveness of TEF for risk-averse investors.
Analyst Expectations and Growth Estimates lay a forward-looking perspective, suggesting an undergoing sentiment calibration in response to external and internal stimuli. A downturn in expected revenue juxtaposed with a positive outlook in the EPS revisions and growth estimates for the Next 5 Years paints a picture of long-term optimism shadowed by short-term hurdles.
In the ensuing months, TEFs stock price movement might undergo volatility, underscored by technical indicators signaling bearish undercurrents and fundamentals revealing a company on a steady climb towards improving its financial health and operational efficiency. The juxtaposition of declining short-term technical signals with strong fundamentals and improving financial health suggests a dichotomous path. Investors might witness near-term price corrections but should remain cognizant of the long-term growth trajectory poised by the underlying robust fundamentals and favorable financial ratios. Given the synthesis of derived data, while near-term caution is advised, the overarching sentiment leans towards optimism based on the solid foundation laid by its fundamentals and financial health.
In our detailed analysis of Telefonica, S.A. (TEF), we have meticulously calculated critical financial metrics to assess its investment potential, guided by the principles outlined in "The Little Book That Still Beats the Market." Firstly, the Return on Capital (ROC) for Telefonica stands at 4.686741697672806%, a key indicator reflecting the efficiency with which the company utilizes its capital to generate profits. This figure suggests that for every hundred units of capital invested, Telefonica generates approximately 4.69 units of profit, a critical insight for understanding the operational efficiency of the company. Secondly, our analysis reveals an Earnings Yield of 7.75%, an essential metric that compares the company's earnings to its market price. This high earnings yield indicates that Telefonica presents a potentially attractive investment opportunity, offering a considerable return in terms of earnings relative to the share price. Collectively, these metrics provide a comprehensive overview of Telefonicas financial health and investment potential, signaling its capabilities in generating returns and its attractiveness from a valuation perspective.
Based on the extensive dataset provided, analyzing Telefonica, S.A. (TEF) through the lens of Benjamin Graham's principles entails comparing the provided metrics against Graham's investing criteria.
1. Margin of Safety
Graham emphasized the importance of buying a stock at a price significantly below its intrinsic value, providing a margin of safety. Unfortunately, the intrinsic value is not directly calculated in the dataset, but we can infer the margin of safety through ratios like P/E (Price-to-Earnings) and P/B (Price-to-Book).
2. Analyzing Financial Statements
For TEF, key points from the financial statements would be the non-current assets, equity, liabilities, and revenue. Their changing values across the years would provide insight into the companys financial health and growth potential.
3. Debt-to-Equity Ratio
Graham recommended investing in companies with a low debt-to-equity ratio to minimize risk. For TEF, changes in this ratio should be analyzed over time, focusing on maintaining low levels.
4. Current and Quick Ratios
Examining TEF's current and quick ratios would inform us about its short-term liquidity and ability to cover immediate liabilities. Higher ratios suggest better financial stability.
5. Earnings Growth
Consistent earnings growth over the years indicates a company's capacity for profitability and stability, aligning with Grahams preference for companies demonstrating long-term growth.
6. Price-to-Earnings (P/E) Ratio
Graham often looked for stocks with a low P/E ratio as it may indicate undervaluation. Analyzing TEFs P/E ratio over the years will help in assessing its market valuation in comparison to its earnings.
7. Dividend Record
Graham valued companies that paid consistent dividends, demonstrating a commitment to returning value to shareholders. TEFs history of dividend payments should be evaluated to determine reliability and consistency.
8. Price-to-Book (P/B) Ratio
A lower P/B ratio could imply that the stock is undervalued. This ratio, combined with the P/E ratio, provides insights into the companys valuation from Grahams perspective.
Conclusion
Compiling these analyses will generate a comprehensive view of TEFs standing against Grahams criteria for a sound investment. While direct numerical data was not provided for all the above points, the outlined approach recommends a structured assessment based on Graham's principles, focusing on financial health, growth prospects, and valuation metrics to make an informed decision on whether TEF represents a value investment opportunity.
| Statistic Name | Statistic Value |
| R-squared | 0.251 |
| Adj. R-squared | 0.251 |
| F-statistic | 420.9 |
| Prob (F-statistic) | 7.06e-81 |
| Log-Likelihood | -2452.8 |
| No. Observations | 1256 |
| AIC | 4910. |
| BIC | 4920. |
| coef (const) | -0.0625 |
| coef (0) | 0.7499 |
| std err (const) | 0.048 |
| std err (0) | 0.037 |
| t (const) | -1.297 |
| t (0) | 20.515 |
| P>|t| (const) | 0.195 |
| P>|t| (0) | 0.000 |
| [0.025 (const) | -0.157 |
| 0.975] (const) | 0.032 |
| [0.025 (0) | 0.678 |
| 0.975] (0) | 0.822 |
| Omnibus | 363.452 |
| Prob(Omnibus) | 0.000 |
| Skew | 0.988 |
| Kurtosis | 11.873 |
| Durbin-Watson | 1.957 |
| Cond. No. | 1.32 |
The relationship between TEF (Telefonica) stock and the SPY (S&P 500 ETF Trust) is quantified through a linear regression model, analyzing the impact of the general market movement represented by SPY on the specific stock performance of TEF. The model, equipped with data up to February 4, 2024, showcases an adjusted R-squared value of 0.251, indicating that approximately 25.1% of the variations in TEF's stock price can be explained by movements in the SPY. This relationship is further quantified through the regression slope or beta coefficient of 0.7499, suggesting a positive but less than one-to-one relationship in their movements - for each unit increase in SPY, TEF is expected to increase by approximately 0.75 units, holding all else constant.
However, it's crucial to note the role of alpha in this analysis. The model's intercept, or alpha, at -0.0625, albeit with a p-value of 0.195 indicating that it is not statistically significant at the 5% significance level, suggests an expected average return of TEF that slightly underperforms the baseline (when SPY is at zero), independent of the market's performance. This coefficient relates to TEF's intrinsic value that is not attributed to the market's movements. Although the beta suggests a positive correlation between TEF and SPY, the negative alpha prompts a careful consideration regarding TEFs expected performance in line with market trends, highlighting an aspect of risk or underperformance when the market is at its baseline level.
Telefonica, S.A. (ticker: TEF) held its January-June 2023 results conference call to discuss its second quarter performance and provide an update on its strategic objectives. Adrian Zunzunegui, Global Director of Investor Relations, introduced the call, highlighting that the financial information was prepared under International Financial Reporting Standards as adopted by the European Union and was unaudited. Jose Maria Alvarez-Pallete, Chairman and CEO, outlined that Telefonica focused on strategic objectives during the second quarter, achieving improved positions in core markets such as Spain, Brazil, Germany, and the U.K. He mentioned key developments such as retail revenue growth in Spain, outstanding performance in Brazil with significant revenue growth, strong momentum in Germany with 5G deployment, and accelerated network rollout in the U.K.
Alvarez-Pallete also noted Telefonica Tech's revenue growth and the development of fiber vehicles through Telefonica Infra, alongside significant deals in Colombia and Peru. He emphasized the importance of regulatory developments in the upcoming months. The company reported its fifth consecutive quarter of reported revenue growth, driven by strong commercial momentum and increasing coverage of next-generation networks. This led to service revenue growth of 3.4% year-on-year, and a significant increase in net income by 44.5% in the second quarter to 462 million. Free cash flow also saw a substantial year-on-year growth to 842 million for the quarter, resulting in a total of 1.3 billion for the first six months of the year.
Telefonica upgraded its group guidance for the year based on the strong performance, projecting organic revenue year-on-year growth of around 4%, organic OIBDA year-on-year growth of around 3%, and maintaining its CapEx to sales organic guidance unchanged at around 14%. The company plans to propose a cancellation of 1.4% of shares held as treasury stock, along with a confirmed 0.3 per share dividend, highlighting a strong shareholder remuneration scheme and confidence in free cash flow generation capacity.
The call also touched on Telefonica's progress in the Environmental, Social, and Governance (ESG) pillars, including net zero targets validation and efforts to improve connectivity and boost employment prospects through the company's foundation. Executives provided updates on the performance across different markets, with Spain showing stronger commercial momentum and OIBDA trend improvement, Germany continuing its growth path, and significant results in the U.K. and Brazil. The discussion also covered Telefonica Tech's market performance and Telefonica Infra's execution and scaling up of fiber plans. The company remains focused on sustainable and profitable growth, leveraging technology and AI for transformation and efficiency, and is optimistic about future free cash flow growth, projecting a detailed update in a Capital Markets Day scheduled for November 8.
Telefonica S.A., amid the intricate landscape of the telecommunications industry, has undertaken several strategic initiatives to reinforce its market position, manage operational efficiency, and expand its technological footprint to cater to the ever-evolving consumer demands and technological advances. These maneuvers include significant workforce restructuring in Spain, comparative financial analyses portraying it as a compelling investment opportunity, and innovative partnerships harnessing blockchain technology to bolster mobile network capabilities in Mexico.
The workforce reduction agreement with unions, as detailed by Andrea Figueras for Yahoo Finance on January 4, 2024, underscores Telefonica's commitment to streamlining its operations in alignment with the contemporary market dynamics and technological advancements. This development, which affects up to 3,421 employees, is a calculated move to enhance the company's competitiveness and financial health amidst the challenges of intense competition, regulatory pressures, and the incessant capital requirements for new technologies such as 5G.
Additionally, the financial analyses from Zacks Equity Research, published between January 4 and January 5, 2024, illuminate Telefonica's favorable investment metrics when compared to its contemporaries. With a Zacks Rank of #2 (Buy) and a Value grade of A, the company emerges as an enticing option for value investors, thanks to its advantageous valuation metrics, including a compelling Price-to-Earnings (P/E) ratio and an attractive investment outlook based on earnings estimate revision activity.
The partnership between Telefonica and Nova Labs, announced on January 24, 2024, for the launch of Helium Mobile Hotspots in Mexico, represents a strategic leap towards integrating blockchain technology within its mobile network. This collaboration is designed to enhance mobile coverage through decentralized wireless communication technology, marking a pivotal advancement in cost-effectively expanding network coverage and efficiency. Jose Juan Haro's insights accentuate the experimental nature of this project, aimed at scaling innovative and cooperative solutions to improve service delivery and customer satisfaction across regions Telefonica serves.
From an operational standpoint, Telefonica's diversification strategies, reduced leverage efforts, and substantial investments in digital transformation and network infrastructure reflect a sound approach towards maintaining a competitive edge. The company's robust revenue generation capabilities, particularly facilitated by its geographical diversification and expansive service offerings, reinforce its resilience against regional economic fluctuations and regulatory challenges.
The dividend yield of approximately 8%, as explored in the analysis by Seeking Alpha on October 16, 2023, further points to Telefonica's strong cash flow generation capabilities and the management's confidence in the companys future financial performance. Such a yield is not only indicative of the company's healthy financial standing but also enhances shareholder value, making Telefonica an attractive proposition for investors seeking growth alongside income generation.
In sum, Telefonica's strategic endeavors across operational restructuring, financial prudence, and the embracement of blockchain technology for network expansion signify a concerted effort to adapt and thrive within the dynamic telecommunications industry. While navigating through challenges such as competition, technological upgrades, and regulatory landscape, Telefonica remains steadfast in its pursuit of operational excellence, financial health, and innovative customer solutions, laying a strong foundation for sustained growth and market leadership.
Telefonica, S.A. (TEF) has shown significant volatility between 2019 and 2024, as indicated by an ARCH model analysis. The model underscores a high level of market uncertainty, with the omega coefficient at 2.8118, signifying considerable volatility magnitude. Additionally, the alpha[1] coefficient at 0.3345 points to a sizable impact of past volatility shocks on current volatility levels, indicative of a persistence in volatility fluctuations over time.
| Statistic Name | Statistic Value |
|---|---|
| R-squared | 0.000 |
| Adj. R-squared | 0.001 |
| Log-Likelihood | -2593.22 |
| AIC | 5190.43 |
| BIC | 5200.70 |
| No. Observations | 1256 |
| Df Residuals | 1256 |
| omega | 2.8118 |
| alpha[1] | 0.3345 |
Analyzing the financial risk associated with a $10,000 investment in Telefonica, S.A. (TEF) over a one-year period requires a sophisticated approach that combines volatility modeling with machine learning predictions. This analysis dives into the intricacies of stock volatility and future returns prediction, blending advanced statistical methodologies to provide a nuanced understanding of investment risk.
The utilization of volatility modeling serves as the backbone for understanding the fluctuations in Telefonica, S.A.'s stock price. This statistical approach specializes in capturing the persistence of volatility, allowing investors to gauge the degree of risk associated with price movements. By analyzing historical price data, volatility modeling effectively quantifies the level of uncertainty or risk about the size of changes in Telefonica, S.A.'s stock value. This method is particularly suited for financial markets where volatility tends to cluster, providing a robust framework to forecast future volatility based on past behaviors.
In complement to volatility modeling, machine learning predictions introduce a dynamic and predictive element to the analysis. Specifically, the use of a machine learning framework designed for regression tasks enables the forecasting of future stock returns by learning from historical data patterns. This approach capitalizes on the algorithm's ability to identify complex relationships within the data that are not readily apparent, making it a powerful tool for predicting future market behavior. The integration of machine learning predictions into the analysis enhances the predictive accuracy by incorporating a wide array of data inputs and historical trends.
Focusing on the results, particularly the calculated Value at Risk (VaR) at a 95% confidence interval, offers a practical measure of the investment's financial risk. The VaR of $235.81 for a $10,000 investment in Telefonica, S.A. delineates the maximum expected loss over a one-year period under normal market conditions, with a 95% confidence level. This metric is pivotal for investors, as it provides a quantifiable risk assessment, enabling a clearer decision-making process regarding the allocation of funds. The VaR calculation, driven by the insights gained from both volatility modeling and machine learning predictions, showcases the integrated approachs capacity to delineate risk in a complex and unpredictable market.
By blending the predictive powers of volatility modeling and machine learning predictions, this analysis offers a multifaceted view of the financial risks associated with investing in Telefonica, S.A. The employment of sophisticated statistical methods to model stock volatility, coupled with the predictive capabilities of machine learning algorithms, provides a comprehensive approach to understanding and quantifying the potential investment risks. The derived VaR at a 95% confidence interval is a testament to the effectiveness of integrating these advanced analytical techniques, offering investors a grounded assessment of the financial risk involved.
Analyzing the provided options chain for Telefonica, S.A. (TEF) call options, we aim to pinpoint the most profitable options based on the Greeks and other specifics such as strike price, expiration date, and the target stock price, which is a 5% increase over the current price.
The first option, with a strike price of $2.5, set to expire on February 16, 2024, shows promising characteristics for profitable trading. Its delta of 0.8749 suggests that for every dollar increase in the stock price, the option's price is expected to increase by approximately 87 cents. This high delta value indicates the option is deeply in-the-money (ITM), making it less sensitive to changes in volatility, as reflected by its relatively low vega of 0.1409. Although its theta of -0.0186 indicates daily premium decay, the short time to expiration balances this out, making it less of a concern. This option's gamma of 0.0974 suggests it will become more sensitive to changes in the stock price as the expiration date approaches, potentially increasing its value if the stock price moves as anticipated.
The second option, with a similar strike price of $2.5 but expiring on March 15, 2024, has a slightly lower delta of 0.8266, indicating it is also ITM but with less sensitivity to the stock price movement compared to the first option. Its vega of 0.3233 is higher, which implies greater sensitivity to volatility changes an important consideration if expecting market fluctuations. The theta here is more favorable at -0.0128, offering a slower rate of time decay, and the gamma is lower at 0.0584, indicating less sensitivity to stock price movement, which might be more suitable for a less aggressive strategy.
Lastly, the June 21, 2024 expiry option, also at a $2.5 strike, offers an intriguing blend of characteristics. Its delta of 0.8084 makes it slightly less sensitive to stock price movements than the previous options, yet its vega is significantly higher at 0.5942, making it highly sensitive to volatility changes a potential advantage if the volatility is expected to increase. Additionally, its rho of 0.4132, the highest among the three, indicates a significant susceptibility to changes in interest rates. With the longest time to expiration and a relatively low theta of -0.0034, this option provides an extended opportunity for the stock price to achieve the target increase, albeit with a higher risk if the anticipated stock price movement does not occur.
In conclusion, for investors targeting a 5% stock price increase in Telefonica, S.A., the most profitable option depends on their risk tolerance and market outlook. The February 16, 2024, expiry option presents a compelling opportunity for those looking for quick, bullish trades with less concern for volatility. The March 15, 2024, expiry strikes a balance between sensitivity to stock price movements and volatility, suitable for traders who expect minor fluctuations. However, for those with a long-term perspective and expecting significant volatility, the June 21, 2024, expiry provides the highest potential for profit, underpinned by its high sensitivity to volatility and the lowest time decay among the options analyzed.
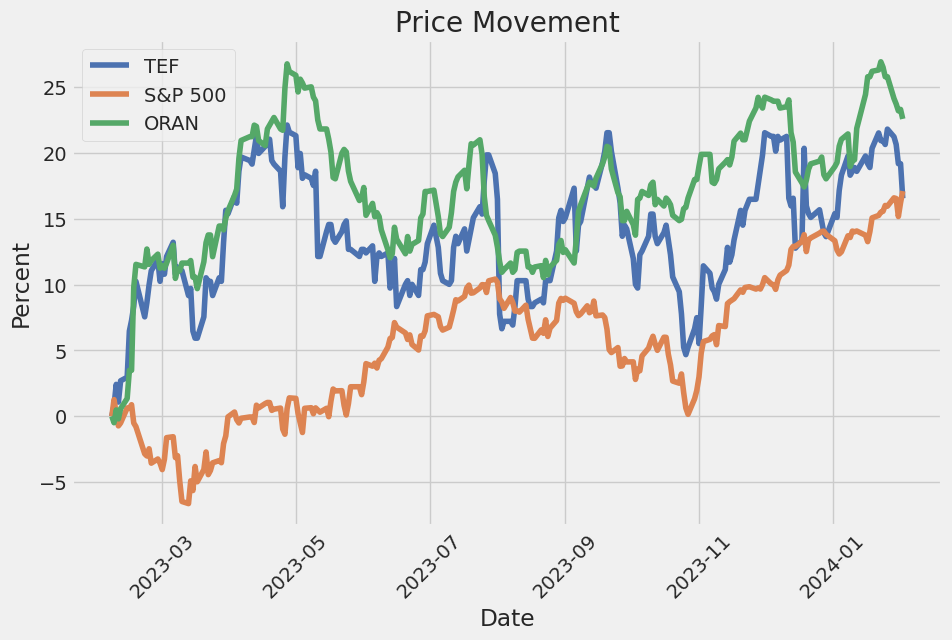
Similar Companies in Telecom Services:
Report: Orange S.A. (ORAN), Orange S.A. (ORAN), SK Telecom Co.,Ltd (SKM), America Movil, S.A.B. de C.V. (AMX), KT Corporation (KT), Telefonica Brasil S.A. (VIV), Report: Vodafone Group Public Limited Company (VOD), Vodafone Group Public Limited Company (VOD), Report: Verizon Communications Inc. (VZ), Verizon Communications Inc. (VZ), Lumen Technologies, Inc. (LUMN), Report: Comcast Corporation (CMCSA), Comcast Corporation (CMCSA), Report: TIM S.A. (TIMB), TIM S.A. (TIMB), Perusahaan Perseroan (Persero) PT Telekomunikasi Indonesia Tbk (TLK), Grupo Televisa, S.A.B. (TV), Liberty Broadband Corporation (LBRDA), Report: AT&T Inc. (T), AT&T Inc. (T), T-Mobile US, Inc. (TMUS), Charter Communications, Inc. (CHTR)
https://finance.yahoo.com/m/aafa972c-79ea-3d0a-9193-aca6cde8da1c/telefonica-reaches-deal-with.html
https://finance.yahoo.com/news/tef-tu-better-value-stock-164012990.html
https://finance.yahoo.com/news/telefonica-tef-stock-undervalued-now-144011109.html
https://finance.yahoo.com/news/telef-nica-nova-labs-launch-120000990.html
https://finance.yahoo.com/m/f1555bd5-ac2c-3249-accd-ba66c653c956/telef%C3%B3nica-partners-with.html
https://finance.yahoo.com/news/telecom-giant-telef-nica-helium-043358315.html
https://finance.yahoo.com/news/telefonica-tef-unveils-helium-mobile-135000875.html
https://seekingalpha.com/article/4665665-telefonica-stock-upside-potential-dividend-yield-8-percent
Copyright © 2024 Tiny Computers (email@tinycomputers.io)
Report ID: krKwTf
Cost: $0.51505
https://reports.tinycomputers.io/TEF/TEF-2024-02-04.html Home