Turkcell Iletisim Hizmetleri A.S. (ticker: TKC)
2024-02-06
 Turkcell Iletisim Hizmetleri A.S., trading under the ticker symbol TKC, is a prominent telecommunications company based in Turkey, offering a wide array of services, including mobile voice and data services, fixed broadband, and TV. In addition to its core operations within Turkey, Turkcell has extended its presence into neighboring countries, thereby expanding its market reach and diversifying its revenue streams. The company is at the forefront of technological innovation within the telecom sector, heavily investing in 5G technology and related infrastructure to enhance its service quality and meet the growing demand for high-speed internet and telecommunications services. Turkcell's strategic focus on customer satisfaction, digital transformation, and international expansion has positioned it as a leading player in the telecommunications industry, both within Turkey and in the broader region. Financially, TKC has shown resilience and continued growth, reflected in its stock performance and financial statements, making it a significant entity in the global communications market.
| Current Price | 5.62 | Market Cap | 5,066,233,344 | Volume | 330,656 |
|---|---|---|---|---|---|
| Dividend Rate | 0.09 | Dividend Yield | 1.57% | Beta | 0.777 |
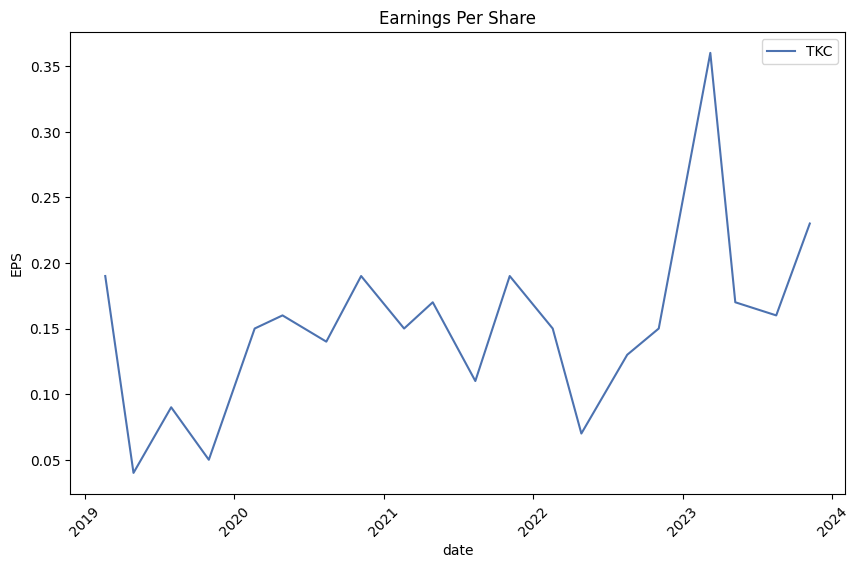
| EPS | 0.4 | 52 Week Low | 3.52 | 52 Week High | 5.7 |
| Total Revenue | 80,963,756,032 | Total Cash | 52,455,243,776 | Total Debt | 83,452,190,720 |
| Trailing PE | 14.05 | Forward PE | 4.29 | Profit Margin | 21.56% |
| Operating Cash Flow | 37,412,401,152 | Free Cash Flow | -5,826,469,888 | Revenue Growth | 77.3% |
| Earnings Growth | 128.2% | Debt to Equity | 203.644 | Return on Assets | 11.006% |
| Return on Equity | 52.469% | Gross Margins | 37.411% | EBITDA Margins | 28.359% |
| Operating Margins | 23.386% | Recommendation Mean | 1.0 | Number of Analyst Opinions | 1 |
| Sharpe Ratio | 0.4808616143601604 | Sortino Ratio | 7.624680447242728 |
| Treynor Ratio | 0.33523287223677967 | Calmar Ratio | 0.6031263607573198 |
Upon examining the recent performance and financials of TKC (Turkcell), an informed forecast concerning its stock price movement in the ensuing months can be established. By synthesizing technical indicators, fundamental analysis, and balance sheet data, a comprehensive understanding of Turkcell's current market standing and potential future performance is achieved.
Technical Analysis Overview:
The observed technical indicators display a noticeable trend. The On-Balance Volume (OBV) has demonstrated an ascending trajectory from 0.035410 to 0.642556 million, indicating growing buying pressure and potential investor confidence. This ascension of OBV is coupled with a gradual upturn in the stock's price from an open of 4.84 to a close near 5.60. Furthermore, the MACD histogram values, commencing from the end, denote an ongoing positive momentum, albeit at a decreasing rate towards the last recorded day. This combination of increasing OBV and a positive, yet declining, MACD histogram suggests a bullish trend, with caution advised due to the decrease in momentum as indicated by the MACD.
Fundamentals and Financial Health:
The fundamental analysis highlights several pivotal factors. TKC's gross margins and EBITDA margins at 0.37411 and 0.28359, respectively, reflect a healthy operational efficiency which is critical in sustaining profit growth. The non-disclosure of the trailing Peg Ratio raises a need for scrutinizing growth estimates. The generated revenue and normalized EBITDA suggest a solid financial performance. Conversely, the detailed balance sheet reveals escalating debt levels which call for a meticulous evaluation of the company's capital structure and leverage.
Risk-Adjusted Return Metrics:
The assessment of risk-adjusted returns via the Sharpe, Sortino, Treynor, and Calmar ratios reveals a mixed perspective. An above-median Sharpe ratio at 0.4808616143601604 indicates that the investment has offered reasonable returns given the risk undertaken, factoring in the volatility. The exceptionally high Sortino ratio of 7.624680447242728 further accentuates that the returns in excess of the minimum acceptable returns have been significant, emphasizing the stock's positive performance in upward movements. The Treynor and Calmar Ratios further corroborate a favorable risk-adjusted return over the past year, suggesting sustainability provided market conditions remain conducive.
Market and Analyst Expectations:
The anticipated growth in earnings per share (EPS) for the upcoming year to 1.31 from a year ago EPS of 0.75 underlines positive sentiment among analysts regarding TKC's future profitability. Likewise, an ambitious revenue forecast signifies expected top-line growth. Coupled with the companys current strategic position in Istanbul, Turkey, and its expansive operational base, such optimistic estimates may invigorate investor optimism.
Conclusion:
In synthesis, the integration of technical indicators, robust fundamentals, and promising analyst expectations positions TKC for a positive trajectory in the forthcoming months. Investors should remain vigilant of the decelerating momentum as indicated by the MACD, and the mounting debt levels which necessitate a rigorous analysis of the company's financial leverage and its implications on future growth prospects. Furthermore, with TKC operating out of a geographically and economically strategic nexus in Istanbul, Turkey, regional economic and political developments could play a pivotal role in shaping its market performance. The confluence of these insights suggests a cautiously optimistic outlook for TKC, with an advised emphasis on monitoring forthcoming financial statements, analyst revisions, and regional economic indicators to refine this forecast as new data emerges.
In our analysis of Turkcell Iletisim Hizmetleri A.S. (TKC), two key financial metrics stand out, both of which are crucial in evaluating the company's potential investment value as outlined in "The Little Book That Still Beats the Market." Firstly, the Return on Capital (ROC) for TKC is calculated at 19.64%, which is a robust figure. This percentage indicates that for every hundred dollars invested in the company, Turkcell is generating nearly $19.64 in pre-tax profit. This high ROC suggests that Turkcell efficiently utilizes its capital, a sign of strong management and potentially a competitive advantage in its sector.
Equally impressive is Turkcell's Earnings Yield, standing at an astonishing 225.09%. This metric is derived from the company's earnings divided by its market value, and such a high yield not only dwarfs typical earnings yield figures but also signals an extraordinary level of profitability relative to the company's current share price. In essence, it suggests that for every dollar invested in Turkcell's shares, the company generates $2.25 in earnings. While this figure may prompt a double-take, it's crucial to verify it for correctness due to its unusually high level, as traditional earnings yield figures are generally much lower.
Together, these metrics suggest that Turkcell is not just performing well in terms of profitability and efficient capital use, but also appears to be significantly undervalued by the market. Such a scenario presents a potentially lucrative opportunity for investors, according to the investment philosophy put forth in "The Little Book That Still Beats the Market." However, potential investors should also conduct a thorough due diligence, considering both qualitative factors and other quantitative metrics, to form a comprehensive view of Turkcell's investment potential.
Based on the financial data provided for Turkcell Iletisim Hizmetleri A.S. (TKC), the application of the principles and methods described in Benjamin Graham's "The Intelligent Investor" can aid in assessing the investment potential of this stock. Here are the key financial metrics derived from the data, interpreted against Graham's criteria:
-
Margin of Safety: Without a clear intrinsic value calculation provided, the direct application of the margin of safety principle is challenging. However, the low Price-to-Earnings (P/E) ratio (0.736) can be indicative of a potential margin of safety if the intrinsic value is understood to be higher.
-
Price-to-Earnings (P/E) Ratio: Graham typically favored a P/E ratio of no more than 15. Turkcell's P/E ratio of 0.736 is significantly lower than this threshold, suggesting the stock may be undervalued, which aligns with Graham's principle of looking for stocks trading below their intrinsic value.
-
Price-to-Book (P/B) Ratio: Graham often sought stocks with a P/B ratio of less than 1.5. The P/B ratio for TKC at 0.048 is well below this level, hinting again at potential undervaluation.
-
Debt-to-Equity Ratio: Graham preferred companies with a low debt-to-equity ratio, indicating financial stability. TKCs ratio of 1.743, although higher than what might be considered optimal by Graham's standards, is not uncommon for companies within certain capital-intensive industries. This ratio would merit further investigation into the industry average and comparison with peers.
-
Dividend Record: TKC has a history of paying dividends, consistent with Graham's preference for companies that return value to shareholders. The documented dividends indicate a company that has the ability and willingness to pay back its investors, contributing positively to its investment profile.
-
Current Ratio: Turkcell's current ratio of 1.594 suggests it has more than enough liquidity to cover its short-term liabilities, which is a good sign of financial health and aligns with Graham's criteria for defensive investing.
-
Earnings Growth: While specific figures for earnings growth are not detailed here, Graham recommended companies that have shown consistent earnings growth over a long period. This metric would require a longitudinal analysis of TKC's earnings to assess compliance with Graham's principles.
-
Industry P/E Ratio: The comparison to the industry average P/E is not specified in the provided information. However, given GK's emphasis on relative valuation, an assessment of TKC's P/E in relation to its industry peers could offer further insights into its valuation status.
Based on Grahams investment philosophy and the available financial metrics:
- Potential Undervaluation: The very low P/E and P/B ratios suggest that TKC might be undervalued according to Graham's criteria, potentially offering a margin of safety to investors.
- Financial Stability: The debt-to-equity ratio, while relatively high, should be evaluated in the context of industry norms. However, the presence of consistent dividend payments signals a level of financial stability and shareholder focus, characteristic of companies Graham recommended.
- Liquidity: The current ratio indicates sufficient liquidity, which is positive from a Graham perspective.
Conclusion: While certain metrics align well with Benjamin Graham's principles, suggesting that TKC could be an undervalued investment opportunity with signs of financial stability, a comprehensive assessment including earnings growth comparison, industry benchmarking, and a deeper dive into the company's operational efficiency and market position would be necessary for a definitive investment decision.
| Statistic Name | Statistic Value |
| R-squared | 0.091 |
| Adj. R-squared | 0.090 |
| F-statistic | 125.1 |
| Prob (F-statistic) | 9.58e-28 |
| Log-Likelihood | -2897.9 |
| No. Observations | 1256 |
| AIC | 5800. |
| BIC | 5810. |
| coef (const) | -0.0048 |
| coef | 0.5828 |
| std err | 0.069 |
| t | 11.184 |
| P>|t| | 0.000 |
| [0.025 | 0.481 |
| 0.975] | 0.685 |
| Omnibus | 94.111 |
| Prob(Omnibus) | 0.000 |
| Jarque-Bera (JB) | 383.930 |
| Skew | 0.226 |
| Prob(JB) | 4.27e-84 |
| Kurtosis | 5.671 |
| Cond. No. | 1.32 |
The regression analysis between TKC and SPY for the period ending today highlights a specific relationship, with TKC dependent on the movements of SPY, which represents the broader market. The model's alpha, valued at -0.0048, shows that the return of TKC was slightly negative when SPY had no movement, indicating an insignificant but negative average performance of TKC against a neutral market. This can be interpreted as TKC typically not achieving positive returns in the absence of movements in SPY. The coefficient of determination, or R-squared value, which stands at 0.091, implies that approximately 9.1% of the variance in TKC's returns can be explained by the returns of SPY, suggesting a mild-to-moderate level of co-movement between TKC's and the market's returns.
Moreover, the model's beta, measured at 0.5828, indicates that TKC experiences less than proportional returns in response to movements in the SPY. This shows a lower sensitivity to market movements, meaning TKC's returns tend to be less affected by the market's fluctuations than an average asset. Despite the directional insight provided by beta, the low R-squared value suggests that other factors beyond SPY's performance likely have a significant influence on TKC's return. This model also underscores the importance of considering both sensitivity to the market (beta) and the asset's intrinsic performance relative to a neutral market (alpha) when evaluating the investment profile of TKC relative to broader market movements.
Turkcell Iletisim Hizmetleri A.S., a leader in mobile telecommunications in Turkey, conducted its third-quarter earnings call for 2023, featuring insights from new CEO Ali Taha Koc and CFO Kamil Kalyon. The call, moderated by Ozlem Yardim, the newly appointed Head of Investor Relations and M&A success, focused on the company's operational and financial progress. Koc, striving to enhance Turkcells digital sovereignty, emphasized the company's advancements in technology and innovation under his leadership. He highlighted the company's commitment to maintaining a pioneering role in Turkey's digital space as the nation looks forward to its second century.
Financially, Turkcell reported an impressive third quarter, with a 7% acceleration in revenue growth attributed to an expanding subscriber base and unparalleled ARPU growth. Their EBITDA surpassed TRY11 billion, marking an 89% annual increase driven by a strong top-line performance and reduced energy costs, alongside an increase in profitability margins. Net profit soared to TRY5.5 billion, a testament to Turkcell's operational excellence and risk management strategies, enabling it to enhance its full year guidance further.
Operational performance showcased Turkcell's aggressive strategies in both mobile and fixed broadband segments. The mobile sector experienced substantial growth with 392,000 postpaid and 193,000 prepaid subscriber net additions, credited to strategic pricing and summer season promotions. Despite increased competition, Turkcell retains a healthy churn rate of 2%. In the fixed broadband arena, a net gain of 48,000 fiber subscribers was reported, fueled by an expanded fiber footprint and the back-to-school demand, thereby boosting its IPTV subscribers to 1.4 million with a strategic focus on 12-month contract options.
Turkcell's diversification into digital services and solutions, including OTT platforms and cloud services, evidenced significant revenue growth, marking a strategic pivot towards digital transformation. The tech-fin division, notably Paycell, showcased an exceptional performance, doubling its transaction value and aiding the groups top-line growth. In the international arena, Turkcell reported a 75% year-on-year growth, with positive prospects for sustainable energy initiatives taking center stage. The company commits to a green energy transition, aligning with global sustainability trends.
In conclusion, under the new leadership of CEO Ali Taha Koc, Turkcell is poised for continued success, capitalizing on technological innovations and digital service expansions. The financial and operational metrics underscore the company's robust growth trajectory and readiness to navigate the challenges of the digital and telecommunication landscape, promising value creation for shareholders and a sustainable future.
Turkcell Iletisim Hizmetleri A.S., commonly known as Turkcell, stands as a stalwart in Turkey's telecommunication sector. Established in 1994, Telecommunications giant Turkcell has distinguished itself not only as the leading mobile phone operator of Turkey but also made significant strides on the international platform, especially in Ukraine, Belarus, Cyprus, and several other countries where it has formidable operations. This multi-dimensional expansion reflects Turkcell's strategic vision to cement its footprint beyond its domestic market, aiming at broader horizons in the telecommunications landscape.
Turkcell's portfolio is remarkably diverse, covering everything from GSM to broadband internet. The company prides itself on a rich array of services including voice, data, and value-added services, catering to a wide spectrum of customers ranging from individual consumers to large-scale enterprises. This diversity in services is pivotal to Turkcell's robust customer base, which continues to grow, demonstrating the company's ability to meet evolving consumer demands and technological advancements.
Innovation is at the heart of Turkcell's operations. The company has consistently leveraged cutting-edge technology to enhance its service offerings. One of the pivotal areas of focus is the deployment of 5G networks. Turkcell has been at the forefront, embracing 5G technology to provide ultra-fast internet services, which is a critical component of its growth strategy. This commitment to innovation not only enhances its competitive edge but also ensures it remains at the forefront of the telecommunication industry's evolution.
Besides technological innovations, Turkcell has made considerable strides in digital services and applications. The company's foray into digital services, including fintech, digital education, and health applications, signifies Turkcell's ambition to transcend traditional telecom services. This strategic diversification has enabled Turkcell to tap into new revenue streams and cater to the digital needs of a modern society, thus broadening its market reach and enhancing customer retention.
Corporate social responsibility (CSR) is another cornerstone of Turkcell's operational philosophy. The company has undertaken numerous initiatives aimed at giving back to the community, ranging from environmental conservation efforts to educational programs. Such initiatives underscore Turkcell's commitment to sustainable development and corporate citizenship, fostering goodwill and reinforcing its brand reputation among consumers and stakeholders alike.
Financially, Turkcell has exhibited strong performance, underpinned by steady revenue growth and profitability. The company's financial results reflect its operational success and strategic investments, which have been critical in navigating the competitive and rapidly changing telecommunications industry. Despite the challenges posed by regulatory changes and market dynamics, Turkcell has managed to sustain its financial health, which is indicative of its resilient business model and prudent management strategies.
On the regulatory front, Turkcell operates in a highly regulated environment, both domestically and in its international markets. The company has adeptly navigated this complex regulatory landscape, ensuring compliance while advocating for policies that support industry growth and innovation. This ability to effectively manage regulatory challenges is testament to Turkcell's robust governance structure and strategic foresight.
Looking ahead, Turkcell is well-positioned for continued growth and expansion. The company's focus on innovation, digital services, and international markets sets the stage for future achievements. Moreover, Turkcell's resilient financial position and strategic investments in technology and infrastructure provide a solid foundation for its long-term success.
In conclusion, Turkcell Iletisim Hizmetleri A.S. exemplifies a dynamic and forward-looking company within the telecommunications industry. Through its commitment to innovation, diversification, and sustainability, Turkcell has not only solidified its leadership position in Turkey but also made significant inroads on the international stage. Its ability to adapt to changing market conditions and consumer preferences, coupled with a responsible approach to business, positions Turkcell for ongoing success in the evolving telecommunications landscape.
Turkcell Iletisim Hizmetleri A.S. (TKC) has experienced significant volatility during the period from early 2019 to early 2024, as evidenced by the statistical analysis of its asset returns. The volatility model highlights an omega coefficient of 5.3533, indicating a high base level of volatility in the asset's returns. Furthermore, the alpha coefficient of 0.1796 suggests that past returns have a considerable impact on the current volatility, highlighting the asset's sensitivity to market movements and news.
| Statistic Name | Statistic Value |
|---|---|
| Mean Model | Zero Mean |
| Vol Model | ARCH |
| Log-Likelihood | -2934.13 |
| AIC | 5872.26 |
| BIC | 5882.53 |
| No. Observations | 1,256 |
| omega | 5.3533 |
| alpha[1] | 0.1796 |
When assessing the financial risk associated with a $10,000 investment in Turkcell Iletisim Hizmetleri A.S. (TKC) over a one-year horizon, a sophisticated approach combines volatility modeling and machine learning predictions. This technique leverages the strengths of both quantitative financial analysis and predictive analytics to provide a nuanced view of potential risks.
Volatility modeling is pivotal for understanding the fluctuation in Turkcell Iletisim Hizmetleri A.S.'s stock prices. By deploying this methodology, we're able to quantify the variability or the rate at which the stock's price increases or decreases for a given set of returns. This model is particularly effective in capturing the persistence of volatility, an essential aspect when examining stock market investments. It provides insights into the nature of the volatility, whether it's stable or prone to sudden spikes, which is critical when planning long-term investments.
On the other hand, incorporating machine learning predictions into this analysis allows for forecasting future returns based on historical data. Here, the focus is on leveraging patterns derived from past stock performance to predict future trends. The application of a machine learning model, specifically designed for regression tasks, fits into this framework by utilising a plethora of variables that influence stock prices. This includes trading volumes, previous closing prices, and other market indicators that collectively feed into the model to forecast future prices.
Integrating these two analysesvolatility modeling and machine learning predictionsoffers a comprehensive view of the investment's risk profile. Particularly, it addresses the dynamic and complex nature of financial markets, where traditional models might fail to capture the full spectrum of risks.
The calculated Annual Value at Risk (VaR) at a 95% confidence level for the $10,000 investment in TKC stands at $431.68. This figure essentially suggests that with 95% certainty, the maximum expected loss over a one-year period would not exceed $431.68. This metric is a pivotal outcome of the combined analysis; it encapsulates the potential downside risk based on both the predicted volatility of the stock and the expected returns derived from machine learning forecasts.
By grounding the financial risk assessment in both the historical volatility of the stock and predictive insights into future returns, an investor is better equipped to gauge the potential risks inherent in a $10,000 equity investment in Turkcell Iletisim Hizmetleri A.S. This integrated approach, utilizing both volatility modeling and machine learning predictions, delineates not just the extent of potential financial loss (as denoted by the VaR metric) but also aligns investment expectations with a more data-driven, probabilistic view of stock market investments.
When analyzing the options chain for Turkcell Iletisim Hizmetleri A.S. (TKC) with a focus on call options, certain "Greeks" play a pivotal role in identifying the most profitable options. "The Greeks" include delta, gamma, vega, theta, rho, along with other factors such as the strike price, days to expiration, expiration date, premium, return on investment (ROI), and profit. In this case, aiming for a stock price that's 5% above the current price, the options with varying expiration dates and strike prices present differing opportunities.
Key Options Analysis
For shorter-term investments, particularly those expiring in just 9 days, the option with a strike price of $5.0 stands out. This option carries a delta of 0.7718 and a gamma of 0.3000, indicating a high sensitivity to stock price changes and the rate of change in delta, which can be beneficial for capturing price movements towards our target. With a relatively low premium of $0.60, its ROI of 50.17% and a profit of $0.301 make it attractive for those betting on a quick, substantial move.
Looking ahead to a medium-term horizon of 72 days until expiration, options with both $2.5 and $5.0 strike prices offer interesting opportunities. The option with a $5.0 strike has a lower delta (0.7427) but significant gamma (0.2555) and the highest vega (0.7991) among analyzed options, suggesting considerable sensitivity to changes in the underlying's volatility. Despite a premium of $0.75, its potential ROI stands at 20.13%, reflecting moderate profitability potential.
For a longer-term investment, with an expiration date 163 days away, both options for strike prices of $2.5 and $5.0 present unique opportunities. The option with a strike price of $2.5, possessing a delta of 0.9028 and a substantial vega of 0.6098, suggests high responsiveness to the stock's price changes and volatility, a vital aspect considering our target price. With a premium of $2.6, it promises a ROI of 30.81% and a notable profit of $0.801.
The option at a $5.0 strike price for the same expiration date also merits attention. Although its delta is lower at 0.7126, it boasts the highest rho (1.3315) among the selections, indicating a significant sensitivity to interest rate changes. Given its premium of $0.9, it notably stands out with a marginal ROI but may serve as a lucrative choice if interest rates sway favorably.
Conclusion
Considering the diverse array of options with varying expirations, the $5.0 strike options for both short-term (9 days) and longer-term (163 days) horizons show promising profitabilities, especially when accounting for lower premiums and balanced sensitivities across the Greeks. The option expiring in 9 days potentially offers quick returns for those speculating on immediate price jumps, whereas the option with a 163-day expiration could appeal to those betting on more significant, long-term shifts, influenced by volatility and possibly interest rates. Each option carries its own set of risks and opportunities, underscoring the importance of a balanced approach in options trading, keeping in line with one's investment timeline and risk tolerance.
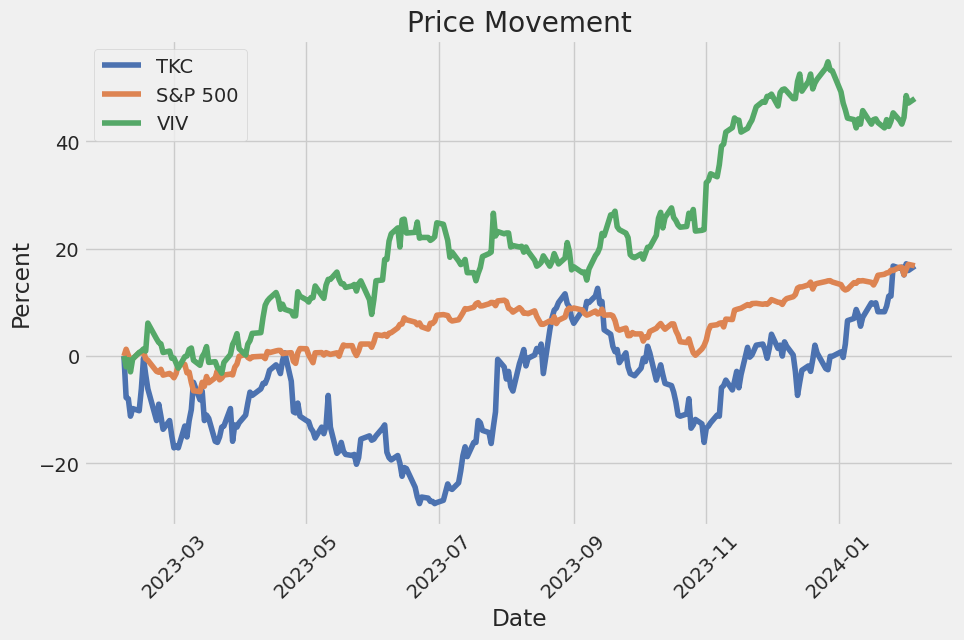
Similar Companies in Telecom Services:
Telefonica Brasil S.A. (VIV), Report: TIM S.A. (TIMB), TIM S.A. (TIMB), Perusahaan Perseroan (Persero) PT Telekomunikasi Indonesia Tbk (TLK), PLDT Inc. (PHI), Liberty Broadband Corporation (LBRDA), SK Telecom Co.,Ltd (SKM), KT Corporation (KT), Report: Telefonica, S.A. (TEF), Telefonica, S.A. (TEF), Report: Orange S.A. (ORAN), Orange S.A. (ORAN), America Movil, S.A.B. de C.V. (AMX), Report: AT&T Inc. (T), AT&T Inc. (T), Report: Verizon Communications Inc. (VZ), Verizon Communications Inc. (VZ), T-Mobile US, Inc. (TMUS), Report: Vodafone Group Plc (VOD), Vodafone Group Plc (VOD)
Copyright © 2024 Tiny Computers (email@tinycomputers.io)
Report ID: eK6Klh
Cost: $0.27186
https://reports.tinycomputers.io/TKC/TKC-2024-02-06.html Home