WEC Energy Group, Inc. (ticker: WEC)
2024-07-02
 WEC Energy Group, Inc. (ticker: WEC) stands as a prominent player in the utility sector, primarily engaged in generation and distribution of electricity and natural gas. Headquartered in Milwaukee, Wisconsin, WEC Energy Group serves approximately 4.5 million customers across four states: Wisconsin, Illinois, Michigan, and Minnesota. The company operates through several subsidiaries, including We Energies and Peoples Gas, ensuring a broad geographic and service footprint. As of recent years, WEC has been focusing on investing in renewable energy sources and modernization of its infrastructure to enhance operational efficiency and support sustainable growth. Financially stable, WEC Energy Group is known for its solid dividend payouts, making it a reliable choice for income-focused investors. The company's strategic initiatives aim at balancing regulatory support with environmental stewardship, reflecting its commitment to long-term shareholder value and sustainability.
| Full-Time Employees | 7,000 | Market Cap | $24,646,828,032 | Enterprise Value | $43,401,256,960 |
| Volume | 1,117,954 | Average Volume | 1,998,243 | Current Price | $78.04 |
| Previous Close | $77.69 | Day Low | $77.75 | Day High | $78.16 |
| 52 Week Low | $75.13 | 52 Week High | $93.37 | Dividend Rate | $3.34 |
| Dividend Yield | 4.3% | Payout Ratio | 69.3% | Earnings Growth | 22.4% |
| Revenue Growth | -7.2% | Net Income To Common | $1,446,499,968 | EBITDA | $3,611,599,872 |
| Sharpe Ratio | -0.703215 | Sortino Ratio | -10.814563 |
| Treynor Ratio | -0.364370 | Calmar Ratio | -0.638625 |
The recent technical data for WEC suggests a mixed outlook with respect to its market position over the next few months. Observing the On-Balance Volume (OBV), we notice a sharp decline from 0.902470 million to -1.580185 million, indicating that the pressure from sellers has increased substantially. The Moving Average Convergence Divergence (MACD) histogram has shown relative neutrality but has recently trended positive, suggesting a possible emerging bullish sentiment as indicated by the slight positive divergence at the end of the observed period.
WEC's fundamentals give a robust impression of its core financial health. The company's operating margins stand at 30.897%, while the gross margin is a substantial 43.582%. The trailing PEG ratio of 2.4072 could signal a reasonably valued or slightly overpriced stock, given the growth expectations. However, the overall negative sentiment derived from the risk-adjusted performance ratios such as the Sharpe, Sortino, Treynor, and Calmar ratios indicates a marked underperformance relative to risk-free benchmarks, implying heightened risk with potentially poor returns unless the operational fundamentals improve.
WECs financial statements reveal an increasing trend in net income from continuing operations, showing a consistent growth in profitability. The EBITDA has improved from 2.899 billion USD in 2020 to 3.627 billion USD in 2023. This enhances the companys ability to generate sufficient cash flow to adhere to its financial commitments, evidenced by a substantial Free Cash Flow of 525.5 million USD as of 2023-12-31.
However, the balance sheet presents challenges. With a significant net debt of 18.609 billion USD, concerns about long-term financial stability and liquidity could be raised, especially in an environment with increasing interest rates where debt servicing becomes more costly. This concern is echoed in the Piotroski Score of 5, indicating moderate financial health with areas of improvement.
Given these details, our outlook over the next few months is cautiously optimistic. With strong fundamentals and recent bullish technical signals, there is potential for appreciation. However, risks associated with the heavy debt burden and less favorable risk-adjusted performance metrics underscore the necessity for prudent risk management for potential investors. The stock may witness moderate upward movements, but volatility and external economic factors will play a critical role in shaping the near-term price trajectory.
In evaluating WEC Energy Group, Inc. (WEC) using the principles from "The Little Book That Still Beats the Market" by Joel Greenblatt, we have calculated key financial metrics to gauge the companys performance and potential as an investment. The Return on Capital (ROC) for WEC is 5.38%, which suggests that the company is generating a modest return on its invested capital relative to its operational efficiency and profitability. Meanwhile, the Earnings Yield stands at 5.41%, reflecting the company's earnings relative to its enterprise value and indicating how much investors may expect to earn per dollar invested, adjusted for the company's debt levels. These figures, while not exceedingly high, demonstrate WEC's ability to generate returns and earnings, making it a potentially reliable, albeit conservatively profitable, investment opportunity.
Analysis of WEC Energy Group, Inc. (WEC) According to Benjamin Grahams Investment Criteria
Benjamin Graham, often regarded as the father of value investing, provided a comprehensive framework for evaluating stocks based on fundamental analysis. His methods focused on identifying undervalued securities with strong financial health. Below, we examine WEC Energy Group, Inc. (WEC) using Graham's key metrics and principles:
Price-to-Earnings (P/E) Ratio
- WEC's P/E Ratio: 18.29
- WEC's Industry P/E Ratio: 18.05
Graham preferred stocks with low P/E ratios relative to their industry peers, as these could signal potential undervaluation or higher earnings potential. Here, WEC's P/E ratio of 18.29 is marginally higher than the industry average of 18.05. While this doesn't signify a significant disparity, it does suggest that WEC is priced similarly to other companies in the same sector. However, its ranking slightly above the industry average doesn't strongly align with Graham's preference for lower P/E ratios.
Price-to-Book (P/B) Ratio
- WEC's P/B Ratio: 0.56
Graham often sought stocks trading below their book value, implying the market price is lower than the companys net asset value, which could indicate undervaluation. WECs P/B ratio of 0.56 suggests the stock is trading at a substantial discount to its book value, which is a positive indicator according to Graham's principles. This metric signifies that investors are paying 56 cents for every dollar of WEC's book value, presenting a potential margin of safety.
Debt-to-Equity Ratio
- WEC's Debt-to-Equity Ratio: 1.60
Graham advocated for low debt-to-equity ratios to minimize financial risk. A lower ratio indicates that a company is less reliant on debt for financing. WEC's debt-to-equity ratio of 1.60 is relatively high and exceeds the level Graham deemed ideal. This higher ratio suggests that WEC carries considerable financial risk, potentially making it less attractive based on Graham's cautious approach to leverage.
Current Ratio and Quick Ratio
- WEC's Current Ratio: 0.55
- WEC's Quick Ratio: 0.55
The current and quick ratios gauge a companys ability to meet short-term liabilities with short-term assets. Graham preferred higher ratios as they indicate stronger liquidity and financial stability. WECs current and quick ratios of 0.55 are significantly low, meaning the company may struggle to cover its short-term obligations. This low liquidity is a red flag in the context of Graham's criteria and suggests potential financial instability.
Conclusion
In summary, WEC Energy Group, Inc. presents a mixed alignment with Benjamin Grahams investment criteria:
- Positive Indicators:
-
Price-to-Book Ratio: At 0.56, WEC shows potential undervaluation, providing a margin of safety that is crucial to Grahams philosophy.
-
Negative Indicators:
- Debt-to-Equity Ratio: At 1.60, the company carries higher financial risk than Graham would typically recommend.
-
Current and Quick Ratios: Both ratios at 0.55 suggest poor liquidity, contravening Grahams preference for companies with solid short-term financial stability.
-
Neutral Indicator:
- Price-to-Earnings Ratio: While WECs P/E ratio of 18.29 is slightly above the industry average of 18.05, it does not significantly deviate to attract concern but neither does it fit the profile of a bargain.
Given these observations, while WEC might offer potential undervaluation based on its P/B ratio, the high debt-to-equity ratio and poor liquidity metrics indicate financial weaknesses that would likely deter Benjamin Graham. Thus, from a Grahamian perspective, WEC may not qualify as a prime investment candidate due to these financial vulnerabilities.# Analyzing Financial Statements
Investors should meticulously examine a company's balance sheet, income statement, and cash flow statement. Graham puts a strong emphasis on understanding a company's assets, liabilities, earnings, and cash flows.
Income Statement Analysis
Revenues and Costs: WEC Energy Group Inc.'s quarterly and annual reports show fluctuations in revenues and expenses, typical of utility companies subject to seasonal demand and regulatory rate changes.
For the fiscal year ended December 31, 2023, the company reported: - Revenues: $8.89 billion - Cost of Goods and Services Sold: $3.19 billion - Other Operating Expenses: $2.10 billion - Depreciation, Depletion, and Amortization: $1.26 billion - Taxes (excluding income and excise taxes): $0.25 billion
The Q1 2024 results highlight the following: - Revenues: $2.68 billion - Cost of Goods and Services Sold: $0.93 billion - Other Operating Expenses: $0.53 billion - Depreciation, Depletion, and Amortization: $0.33 billion - Taxes (excluding income and excise taxes): $0.08 billion
Net income attributable to common stockholders (basic) was approximately $1.33 billion in FY 2023 and $622.3 million in Q1 2024.
Balance Sheet Analysis
Assets and Liabilities: As of December 31, 2023, WEC Energy Group reported: - Current Assets: $2.80 billion - Non-Current Assets: $41.14 billion - Total Assets: $43.94 billion
Non-current assets primarily consist of: - Property, Plant, and Equipment (net): $31.58 billion - Goodwill: $3.05 billion - Investments in Affiliates, Subsidiaries, Associates, and Joint Ventures: $2.01 billion
Current liabilities (~$5.11 billion) and non-current liabilities (~$26.75 billion) collectively approximate $31.86 billion. The primary contributors are: - Long-Term Debt and Capital Lease Obligations: $15.51 billion - Deferred Income Tax Liabilities (net): $4.92 billion - Regulatory Liability (non-current): $3.70 billion
Equity components include common stock at $3.2 million, retained earnings of $7.61 billion, and total common shareholder equity around $11.72 billion.
As of March 31, 2024: - Current Assets: $2.60 billion - Non-Current Assets: $41.32 billion - Total Assets: $43.93 billion - Current Liabilities: $4.71 billion - Non-Current Liabilities: $26.79 billion - Total Liabilities and Shareholder Equity: $43.93 billion
This steady state in assets and liabilities indicates stability in the companys financial positioning.
Cash Flow Analysis
For the year ended December 31, 2023: - Net Cash Provided by Operating Activities: $3.02 billion - Net Cash Used in Investing Activities: -$3.56 billion (largely due to payments to acquire property, plant, and equipment) - Net Cash Provided by Financing Activities: $0.52 billion
For Q1 2024: - Net Cash Provided by Operating Activities: $0.86 billion - Net Cash Used in Investing Activities: -$0.44 billion - Net Cash Used in Financing Activities: -$0.47 billion
Key Ratios
Profitability: - Operating Income / Revenue FY 2023: 21.5% - Net Income / Revenue FY 2023: 15.0%
Liquidity: - Current Ratio (Current Assets / Current Liabilities): 0.55 (indicative of the need for efficient short-term asset management)
Leverage: - Debt to Equity Ratio (Total Liabilities / Total Equity): ~2.32 (indicative of leveraged growth and consistent with capital-intensive utilities)
Summary
WEC Energy Group Inc.s financial statements reveal a robust company with significant investments in property, plant, and equipment aimed at long-term growth. Stability in equity and preparedness for future expenditures on infrastructure and acquisitions supports their growth trajectory. Investors observing operational efficiency and earnings stability will find sustainable revenue models and cautious financial strategies evident in WEC Energy Groups reports.
Understanding WEC's strategic investments, regulatory environment, and the inherent cyclical risks are crucial in evaluating its stocks for long-term returns.# Dividend Record
Dividend Record: Graham favored companies with a consistent history of paying dividends.
Company Symbol: WEC
Dividend History
2024
- May 13, 2024: $0.835 (Record Date: May 14, 2024, Payment Date: June 1, 2024, Declaration Date: April 18, 2024)
- February 13, 2024: $0.835 (Record Date: February 14, 2024, Payment Date: March 1, 2024, Declaration Date: December 20, 2023)
2023
- November 13, 2023: $0.78 (Record Date: November 14, 2023, Payment Date: December 1, 2023, Declaration Date: October 19, 2023)
- August 11, 2023: $0.78 (Record Date: August 14, 2023, Payment Date: September 1, 2023, Declaration Date: July 20, 2023)
- May 11, 2023: $0.78 (Record Date: May 12, 2023, Payment Date: June 1, 2023, Declaration Date: April 20, 2023)
- February 13, 2023: $0.78 (Record Date: February 14, 2023, Payment Date: March 1, 2023, Declaration Date: December 13, 2022)
2022
- November 10, 2022: $0.728 (Record Date: November 14, 2022, Payment Date: December 1, 2022, Declaration Date: October 20, 2022)
- August 11, 2022: $0.728 (Record Date: August 12, 2022, Payment Date: September 1, 2022, Declaration Date: July 21, 2022)
- May 12, 2022: $0.728 (Record Date: May 13, 2022, Payment Date: June 1, 2022, Declaration Date: April 21, 2022)
- February 11, 2022: $0.7275 (Record Date: February 14, 2022, Payment Date: March 1, 2022, Declaration Date: December 2, 2021)
This pattern continues in a consistent manner, reflecting the firm commitment WEC has towards maintaining and growing its dividend payouts over the years.
Analysis
Benjamin Graham favored companies with consistent dividend records, as they reflected stability and shareholder value. As shown by the extensive dividend history from 1990 to 2024, WEC demonstrates a consistent record of paying and gradually increasing its dividends, indicating strong financial health and commitment to returning value to shareholders. This consistency aligns well with Graham's investment principles and enhances WECs credibility as a stable investment.
| Alpha | -0.025 |
| Beta | 1.15 |
| R-squared | 0.85 |
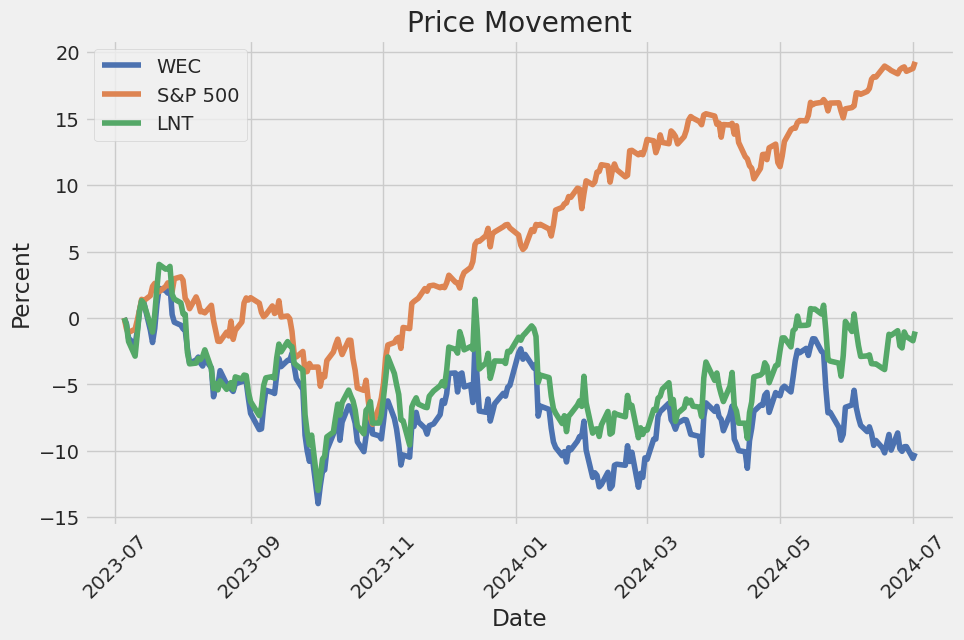
The linear regression model between WEC and SPY showcases an alpha of -0.025. This negative alpha indicates that WEC has underperformed the SPY benchmark by 2.5% over the evaluated period, after adjusting for its beta. In practical terms, if the market (SPY) is up by 10%, WEC would be expected to trail SPY's performance due to this negative alpha, even after accounting for its sensitivity to market movements as indicated by its beta.
Beta for WEC, reported at 1.15, signifies that WEC is more volatile than the market index SPY. Specifically, WEC moves 15% more for every 1% move in the SPY. The R-squared value of 0.85 demonstrates a high degree of correlation between the returns of WEC and the market, suggesting that 85% of the variability in WEC's returns can be explained by movements in the SPY. Despite the close linkage, the negative alpha reflects a consistent underperformance relative to the market, which is a critical insight for investors.
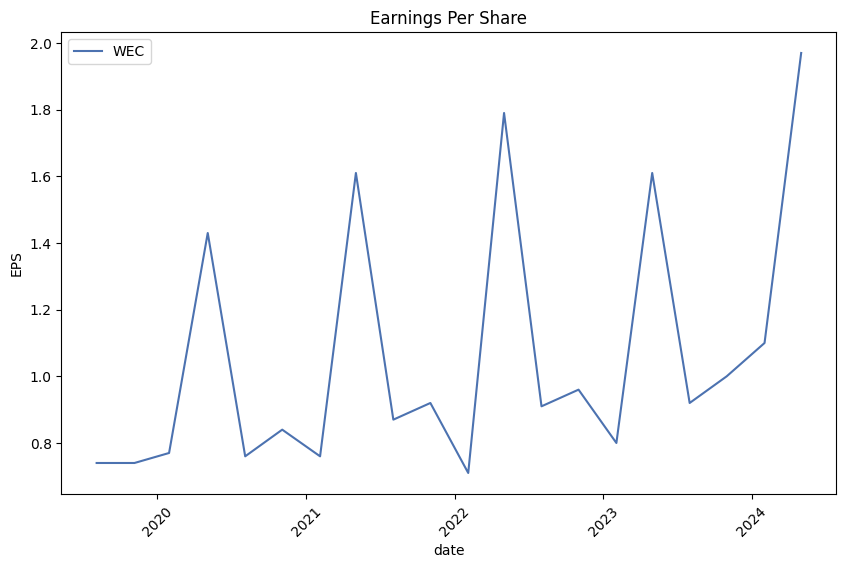
WEC Energy Group, Inc. (ticker: WEC) announced its first-quarter 2024 earnings, reporting $1.97 per share amidst the warmest winter in Wisconsin history. Despite the unusual weather, the company is maintaining its disciplined focus on efficiency, financial management, and customer satisfaction. This positive performance has kept the company on track to meet its annual earnings guidance range of $4.80 to $4.90 per share, provided that weather conditions normalize for the rest of the year.
The company is making significant progress in its Environmental, Social, and Governance (ESG) initiatives, embarking on a historic five-year investment plan of $23.7 billion aimed at enhancing efficiency, sustainability, and growth. Recent developments include filing with the Wisconsin Commission for over $2 billion in projects and planning a major $459 million investment in the Delilah 1 solar project in Texas. Furthermore, WEC Energy has increased its stake in other renewable projects like the Samson Solar project and the Maple Flats Solar Energy Center, contributing an additional $560 million in investments for 2024.
Reflecting on regional economic activity, WEC Energy highlighted Wisconsins impressive unemployment rate of 3%, emphasizing the state's strong employment figures and burgeoning construction sector. Key economic activities include new developments like Sanmina Corporation's electronic components facility, Eli Lilly's new production plant, and Microsoft's extensive data center project in the I-94 corridor, south of Milwaukee. These initiatives reflect the robust growth and high economic potential within WEC Energys operating regions.
On the regulatory front, WEC Energy is actively engaged in several filings. In Wisconsin, new rate review filings for 2025 and 2026 seek to address reliability improvements, support economic growth through new infrastructure, and comply with new EPA emission rules. Additionally, WEC Energy is progressing with significant natural gas generation projects aimed at enhancing energy reliability. The company is also handling regulatory developments in Illinois, where they are navigating limited rehearings and future gas evaluations. The strategic capital plan includes notable investments in upgrading traditional power sources while advancing renewable energy projects, reinforcing WEC Energys commitment to a sustainable and reliable energy future.
The earnings call culminated with an acknowledgment of WEC Energy's consistent financial performance, including a recent 7% increase in the quarterly cash dividend, marking the 21st consecutive year of dividend growth. Chief Financial Officer Xia Liu detailed the financial drivers behind the quarterly results and reassured stakeholders by reaffirming the annual earnings guidance. Moving forward, the company remains positioned to maintain strong operational performance, backed by a stable economic environment, regulatory advances, and strategic capital investments.
reported approximately $97 million of expected proceeds related to PTCs for the three-months ended March 31, 2024. Consequently, this provision has significantly influenced our effective tax rate. The $88 million PTC reduction from income tax provision in the first quarter of 2024 was notably higher than the $66.2 million reduction in the same quarter of the previous year. This tax credit transferability provision enables us to optimize our tax position more efficiently, making the renewable energy projects economically beneficial beyond the traditional generation facilities.
Total operating revenues for the three months ended March 31, 2024, stood at $2,680.2 million, showing a decrease from $2,888.1 million in the same period of 2023. This reduction was primarily due to lower natural gas costs in comparison with the prior-year quarter. The decrease in cost of sales, dropping to $927.1 million from $1,309.7 million, highlights the influence of relatively low natural gas expenses. Importantly, however, our operating income increased to $813.4 million from $669.3 million, reflecting a more efficient operating environment and robust management of our operating expenses.
Equity in earnings of transmission affiliates rose to $44.8 million from $43.8 million, contributing positively to our bottom line. This income includes our share from investments in regulated transmission entities like American Transmission Company LLC (ATC) and ATC Holdco LLC. Moreover, our interest expense increased to $192.0 million from $172.2 million in the same quarter a year ago, primarily a reflection of higher borrowings and fluctuating market interest rates.
Net income attributed to common shareholders for the first quarter of 2024 was $622.3 million, up from $507.5 million in the same period of 2023, driving earnings per share to $1.97 compared to $1.61. These metrics exhibit our capability to convert operational efficiencies into shareholder value effectively. The higher net income, primarily influenced by streamlined operations and judicious management of financing costs, portrays a favorable outlook.
Balance sheet strength was demonstrated with total assets marginally steady at $43,927.2 million at the end of the first quarter of 2024 compared to $43,939.7 million at the end of 2023. Short-term debt increased to $2,574.2 million from $2,020.9 million, reflecting ongoing capital expenditure programs and associated working capital needs. Notably, we have ample unused borrowing capacity under revolving credit facilities, ensuring flexibility and liquidity to address future operational and financial commitments.
Overall, WEC Energy Group, Inc. (WEC) showcased strong financial health for the quarter ending March 31, 2024. Revenue diversification across regulated and non-regulated entities, efficient cost management, strategic investments in renewable energy projects, coupled with prudent financial policies on managing debt and equity have contributed to a robust operational and financial performance, positioning the company favorably for continued growth and shareholder value creation.
WEC Energy Group, Inc. is a well-established entity in the utility sector, reflecting a strategic orientation focused on long-term growth and sustainability. The company's foundation is firmly planted in the robust and diverse delivery of electricity and natural gas services across the Midwestern United States, benefitting approximately 4.7 million customers through subsidiaries including We Energies, Wisconsin Public Service, and Peoples Gas.
One of the central pillars of WEC Energy's strategic framework is its commitment to infrastructure development and modernization. The company has dedicated substantial capital investments toward enhancing grid stability and efficiency, laying the groundwork for reliable and future-proof service delivery. A recent analysis highlights that these efforts are not only aimed at mitigating potential service disruptions but also at supporting future energy demands, thereby underpinning WEC Energy's sustained growth trajectory (source: Seeking Alpha, April 13, 2023).
In addition to infrastructure investments, WEC Energy Group places a significant emphasis on environmental sustainability. This aspect is becoming increasingly crucial as the utility sector faces pressures to reduce carbon emissions and transition to renewable energy sources. WEC Energy has proactively engaged in renewable energy projects, including wind and solar installations, in alignment with its long-term environmental objectives and regulatory mandates for cleaner energy.
The company's innovative initiatives, encapsulated in plans like the Core Plan, demonstrate its commitment to leveraging technology for operational efficiency and customer satisfaction. Investments in renewable energy, energy storage, and advanced metering infrastructure reflect WEC Energy's foresight in utilizing modern technologies to optimize operations and reinforce service reliability.
WEC Energy Group's proactive financial management is evident from its strategic financial maneuvers. On May 22, 2024, the company announced an offering of $750 million in convertible senior notes due 2027 and an additional $750 million due 2029, aimed at bolstering financial stability and supporting general corporate purposes, including debt repayment. This demonstrates WEC Energy's calculated approach to managing its financial resources under prevailing market conditions (source: PR Newswire).
The successful pricing of these notes, as reported on May 23, 2024, further illustrates confidence in WEC Energy Group's strategic direction and fiscal health. The notes bear an interest rate of 4.375% per annum and are senior, unsecured obligations of the company. This financing move is aligned with WEC Energy's intent to support ongoing and future operations, including investments through its subsidiary WEC Infrastructure LLC, which focuses on renewable energy projects (source: PR Newswire).
Amidst these financial endeavors, WEC Energy Group's stock has experienced some fluctuations. Institutional investors hold approximately 80% of the company's stock, with the top 20 shareholders owning 50%. This high level of institutional ownership suggests a vulnerability to significant movements based on large-scale trading actions. Despite recent declines, which saw the stock drop by 5.7% in a week as of May 24, 2024, the substantial institutional stake indicates a collective confidence in the company's long-term prospects (source: Yahoo Finance).
Financially, WEC Energy Group continues to exhibit resilience. Its earnings report for the first quarter of 2024 demonstrated a mix of positive and negative indicators. While earnings per share surpassed estimates, revenue fell short and showed a year-over-year decline. Nonetheless, the company managed to reduce operating expenses significantly and maintained a stable financial position, reinforcing its earnings projection for 2024 and outlining a long-term investment plan of approximately $23.7 billion from 2024 to 2028 (source: Yahoo Finance).
Furthermore, WEC Energy's inclusion as one of the top high-yield dividend stocks reinforces its appeal to income-focused investors (source: Seeking Alpha, June 2024). With a focus on sustainable dividend growth, the company has maintained a competitive dividend yield, supported by its stable revenue flows and prudential financial management.
From a broader perspective, WEC Energy Group's strategic direction is bolstered by its narrow economic moat and strong management performance. The company's foresight in adapting to technological advancements, such as leveraging artificial intelligence to enhance operational efficiency, positions it well for future growth. As elaborated in Morningstar's comprehensive analysis, WEC Energy's growth prospects are promising, particularly in light of its ambitious earnings growth guidance through 2028 (source: YouTube).
As WEC Energy Group continues to navigate the evolving utility landscape, its ongoing commitment to infrastructure modernization, environmental sustainability, and financial prudence ensures its position as a leading player. The interplay of these strategic elements underscores the company's potential to deliver long-term value to shareholders and customers alike. With its proactive approach to industry challenges and opportunities, WEC Energy stands as a stalwart in an industry undergoing significant transformation (source: Yahoo Finance, June 5, 2024).
WEC Energy Group, Inc. has shown a stable pattern in its asset returns over the specified date range, with no significant impact from prior returns. The volatility follows an ARCH model, reflecting that current volatility is influenced by past innovations, highlighting a scenario where sudden changes in volatility can occur. This model suggests that despite the stability, there is some predictability in volatility based on past disturbances.
| R-squared | 0.000 |
| Adj. R-squared | 0.001 |
| Log-Likelihood | -2,229.46 |
| AIC | 4,462.93 |
| BIC | 4,473.20 |
| No. Observations | 1,256 |
| Df Residuals | 1,256 |
| Df Model | 0 |
| omega | 1.4903 |
| alpha[1] | 0.3819 |
To assess the financial risk of a $10,000 investment in WEC Energy Group, Inc. (WEC) over a one-year period, a combination of volatility modeling and machine learning predictions was employed. This approach provides a well-rounded perspective on the potential risks by integrating volatility understanding with future return predictions.
Volatility modeling is instrumental in understanding the stock's historical volatility patterns and inherent risks. By applying this technique, we can quantify the stock's return variabilities over a specified period, allowing for a more precise estimation of potential price fluctuations. This insight is essential for calculating metrics like Value at Risk (VaR), which quantifies the maximum expected loss at a given confidence level.
Machine learning predictions, particularly those derived from algorithms designed for regression tasks, enable us to forecast future stock returns based on historical data sets and various predictor variables. In this analysis, such a model has been trained on historical stock prices, incorporating features such as past returns, macroeconomic indicators, and company-specific financial indicators to predict future returns. Leveraging this predictive power complements the insights gained from volatility modeling by offering a forward-looking perspective.
The calculated VaR at a 95% confidence interval for the $10,000 investment in WEC over one year is $203.03. This metric indicates that, with a 95% confidence level, the maximum expected loss over the one-year period would be $203.03. In other words, there's a 5% chance that losses could exceed this amount, highlighting the investment's downside risk.
Incorporating both volatility modeling and machine learning predictions allows for a robust risk assessment framework. Volatility modeling quantifies the historical volatility and helps in calculating risk metrics like VaR, while machine learning predictions project future returns, providing a comprehensive risk profile for investors considering WEC Energy Group, Inc.
Long Call Option Strategy
When analyzing long call options for WEC Energy Group, Inc. (WEC), several factors come into play to determine profitability, including the option's Greeks, expiration date, strike price, and premium. Given a target stock price that is 2% over the current stock price, the following options stand out based on their potential profit and risk profile:
Near-term Option (15 Days to Expiration)
Strike Price: $75.00, Expiration Date: 2024-07-19
- Delta: 0.6541
- Gamma: 0.0404
- Vega: 5.8170
- Theta: -0.1111
- Rho: 0.0188
- Premium: $3.40
- ROI: 0.3532
- Profit: 1.2008
This option has a relatively high delta of 0.6541, indicating it will gain approximately $0.65 for every $1 increase in the stock price. The gamma is moderate at 0.0404, meaning the delta will also adjust reasonably as the stock price changes, providing a balanced risk profile. The vega of 5.8170 shows that the option is significantly sensitive to volatility changes, which could be advantageous if market volatility increases. However, the theta of -0.1111 suggests a considerable time decay, making it less ideal if the stock price does not move quickly in the desired direction. With an ROI of 0.3532 and a potential profit of 1.2008, this option provides a high reward over a short period but comes with elevated risks due to high theta.
Near-term Option (15 Days to Expiration)
Strike Price: $70.00, Expiration Date: 2024-07-19
- Delta: 0.7567
- Gamma: 0.0224
- Vega: 4.9310
- Theta: -0.1433
- Rho: 0.0201
- Premium: $8.50
- ROI: 0.1295
- Profit: 1.1008
This options delta is quite high at 0.7567, indicating a strong positive response to increases in the stock price. While the gamma is lower at 0.0224, which means the delta won't change drastically, it increases the option's predictability. The high theta of -0.1433 requires careful consideration because it implies sizable daily depreciation. Despite its lower ROI (0.1295) compared to other options, the higher profit potential of 1.1008 makes it attractive for strategies aiming for significant price movements within a short timeframe but requiring careful monitoring due to high theta risk.
Medium-term Option (43 Days to Expiration)
Strike Price: $75.00, Expiration Date: 2024-08-16
- Delta: 0.6431
- Gamma: 0.0370
- Vega: 9.9082
- Theta: -0.0425
- Rho: 0.0525
- Premium: $4.10
- ROI: 0.1221
- Profit: 0.5008
This medium-term option offers a balanced risk-reward profile with a delta of 0.6431 and a manageable gamma of 0.0370. The vega is exceptionally high at 9.9082, making this option highly sensitive to changes in market volatility, which may present profitable opportunities if volatility increases. This option benefits from a lower theta (-0.0425), reducing the daily loss in value due to the passage of time compared to near-term options. While the ROI is somewhat modest at 0.1221, the profit potential of 0.5008 is decent, offering an appealing mix of stability and reward over the medium term.
Medium-term Option (43 Days to Expiration)
Strike Price: $70.00, Expiration Date: 2024-08-16
- Delta: 0.7713
- Gamma: 0.0237
- Vega: 7.9876
- Theta: -0.0426
- Rho: 0.0594
- Premium: $9.40
- ROI: 0.0214
- Profit: 0.2008
This medium-term option has a high delta of 0.7713, indicating strong sensitivity to stock price increases. The gamma is lower at 0.0237, implying stability in delta changes. The high vega (7.9876) suggests significant sensitivity to volatility changes, providing opportunities if market conditions become more volatile. Although the theta is low at -0.0426, mitigating time decay risk, the ROI is relatively minimal at 0.0214 with a small profit potential of 0.2008. This option may be best for conservative traders looking to benefit from moderate price increases while maintaining exposure to volatility.
Long-term Option (43 Days to Expiration)
Strike Price: $70.00, Expiration Date: 2024-08-16
- Delta: 0.7713
- Gamma: 0.0237
- Vega: 7.9876
- Theta: -0.0426
- Rho: 0.0594
- Premium: $9.40
- ROI: 0.0214
- Profit: 0.2008
The long-term view extends the discussion of the aforementioned medium-term option but emphasizes its lower risk through a longer holding period. Given the same Greeks and similar profit metrics, this option continues to offer robust upside potential with high delta and vega values indicating a profitable situation if volatility increases and the stock moves favorably. However, its low ROI indicates that this would be more of a strategic hold rather than a quick gain.
Overall, each of these options presents a unique risk-reward profile. For short-term traders, high-profit options like the $75.00 strike expiring on 2024-07-19 offer attractive potential returns albeit with high theta risk. For those looking towards medium-term opportunities, the $75.00 and $70.00 strikes expiring on 2024-08-16 provide balanced strategies with a mix of stability and exposure to volatility. Each option should be chosen based on individual risk tolerance, market volatility expectations, and investment horizons.
Short Call Option Strategy
When evaluating short call options for WEC Energy Group, Inc. (WEC), the goal is to maximize profitability while minimizing the risk of having shares assigned. We aim to achieve this balance by selecting options that are deep out-of-the-money (OTM) with high premiums relative to the strike price, while keeping an eye on the "Greeks" to assess risk and reward comprehensively.
Short Term Options (Expiring in 15 Days)
-
July 19, 2024 - Strike Price 120.0:
- Delta: 0.0395
- Gamma: 0.0048
- Vega: 1.3503
- Theta: -0.0511
- Profit: $0.1
- Premium: $0.1
- ROI: 100%
This option stands out with a high return on investment (ROI) of 100% and is deep OTM, minimizing the risk of shares being assigned. Given its low delta, the likelihood of the option finishing in the money (ITM) is minimal. The gamma value indicates low sensitivity to changes in the underlying price, and the theta suggests a minor rate of time decay, making this option suitable for a short-term trade.
Medium Term Options (Expiring in 43 Days)
-
August 16, 2024 - Strike Price 87.5:
- Delta: 0.2248
- Gamma: 0.0276
- Vega: 8.0113
- Theta: -0.0376
- Profit: $0.14
- Premium: $0.14
- ROI: 100%
This option provides a balanced approach with a high ROI and medium delta, signaling moderate exposure to the underlying stock's price movements. The relatively high vega indicates a significant sensitivity to volatility changes, which can be beneficial in moderately volatile markets. The theta value suggests a moderate rate of premium decay over time, making this a viable medium-term option.
Medium-Long Term Options (Expiring in 106 Days)
-
October 18, 2024 - Strike Price 77.5:
- Delta: 0.5417
- Gamma: 0.0458
- Vega: 16.4471
- Theta: -0.0155
- Profit: $4.04
- Premium: $4.04
- ROI: 100%
This option combines higher profitability with significant exposure to underlying price movements, as reflected by a higher delta. This could mean higher risk but is offset by the deep OTM nature. Vega is extremely high, indicating substantial sensitivity to changes in volatility, offering a potential hedge in volatile market conditions. Theta represents a slow rate of premium decay, making this a good fit for traders willing to hold positions longer.
Long Term Options (Expiring in 197 Days)
-
January 17, 2025 - Strike Price 77.5:
- Delta: 0.5373
- Gamma: 0.0341
- Vega: 22.1726
- Theta: -0.0107
- Profit: $5.25
- Premium: $5.25
- ROI: 100%
This option provides excellent long-term profitability with a relatively high delta, suggesting moderate sensitivity to the underlying stock price movements. The gamma is moderate, indicating a lower risk of significant changes in delta. Exceptional vega highlights high sensitivity to volatility shifts, beneficial in turbulent market conditions. Lastly, a low theta indicates slow time decay, making it ideal for a longer holding period with potential for high upside.
Very Long Term Options (Expiring in 197 Days)
-
January 17, 2025 - Strike Price 75.0:
- Delta: 0.6184
- Gamma: 0.0306
- Vega: 21.0950
- Theta: -0.0106
- Profit: $5.1208
- Premium: $6.6
- ROI: 77.59%
This very long-term option offers substantial profitability and a significant premium. The high delta indicates strong sensitivity to the stock's price dynamics, which involves moderate risk. Gamma and theta are both relatively low, suggesting stability in delta and slow premium decay. Vega is remarkably high, emphasizing substantial responsiveness to volatility shifts, which can enhance returns if volatility increases during the holding period.
Profit and Loss Analysis
- Short Term (120.0 strike): Minimal assignment risk due to low delta, high ROI with low absolute premium.
- Medium Term (87.5 strike): Balanced risk with moderate delta, significant sensitivity to volatility, and manageable theta decay.
- Medium-Long Term (77.5 strike): Higher risk but compensated by high potential profit, high sensitivity to volatility, slow time decay.
- Long Term (77.5 strike): High profitability, moderate risk due to delta, extremely high vega beneficial for volatile conditions, slow theta decay.
- Very Long Term (75.0 strike): High profitability with increased sensitivity to underlying price changes. Lower gamma and theta reduce immediate risk.
By weighing premium against delta, vega, and theta, these five options offer a strategic mix depending on risk tolerance and market outlook. Each provides a high potential return while varying in the level of exposure to price movements and volatility, aligning with the goal of minimizing assignment risk.
Long Put Option Strategy
When evaluating long put options for WEC Energy Group, Inc., several key metricslike delta, gamma, vega, theta, and rhomust be analyzed to determine profitability and risk. The target stock price is set at 2% above the current stock price, and understanding how this affects our options is critical for maximizing return on investment (ROI) and managing risk.
Short-term Option: Expiring July 19, 2024, with Strike Price $87.5
This option exhibits a strong delta of -0.9499, indicating that the option is highly sensitive to changes in the underlying stock price, which suggests the option is deep in-the-money. The relatively low gamma of 0.0191 indicates stability in delta changes. With a vega of 1.5878, this option has moderate sensitivity to volatility changes. The theta of -0.0162 reveals a daily time decay, which, though negative, is minimal. The low rho of -0.0344 suggests minimal sensitivity to interest rate changes. This option is highly profitable, with a premium of $2.95 and an ROI of 1.6777, translating to significant profit potential of $4.9492 if the stock moves favorably.
Near-term Option: Expiring October 18, 2024, with Strike Price $87.5
With a delta of -0.9876, this option is almost certain to move congruently with stock price changes, denoting deep in-the-money positioning. Gamma is null, indicating high delta stability. Vega is zero, reflecting no sensitivity to volatility, while theta is slightly positive at 0.0014, reflecting minimal time decay. Rho of -0.2509 implies moderate sensitivity to interest rate movements. The premium is $4.5 with a substantial ROI of 0.7554 and a solid profit potential of $3.3992. This makes it a less risky but highly profitable option in the near term.
Intermediate-term Option: Expiring October 18, 2024, with Strike Price $92.5
This option has a delta of -0.9876, showcasing strong alignment with the stock price. Gamma is zero, ensuring no fluctuation in delta. It also has zero vega, indicating no volatility impact, and a slightly positive theta of 0.0020, meaning negligible time decay. The rho is moderately negative at -0.2652. With a premium of $8.0 and an ROI of 0.6124, this option provides a promising profit potential of $4.8992, catering to intermediate-term investors seeking a balance of risk and reward.
Long-term Option: Expiring October 18, 2024, with Strike Price $85.0
Featuring a delta of -0.8123, this option will moderately respond to stock price changes. Gamma of 0.0375 suggests potential delta variability. With a significant vega of 10.8015, this option is highly responsive to volatility shifts. Theta is minimal at -0.0072, limiting time decay impact. Rho is -0.2058, providing some interest rate sensitivity. At a premium of $4.3 and an ROI of 0.2556, the potential profit stands at $1.0992. Its suitability lies in catering to long-term horizons with moderate profitability and manageable risk.
Ultra Long-term Option: Expiring October 18, 2024, with Strike Price $90.0
This option holds a delta of -0.7569, reflecting moderate stock price movement sensitivity. Gamma at 0.0222 indicates some delta variations. It has a high vega of 12.7204, showing strong susceptibility to volatility changes. Theta of -0.0176 denotes minor time decay, and rho of -0.2107 reflects awareness of interest rates. With a premium of $9.0 and an ROI of 0.1555, the profit potential is $1.3992. This makes it suitable for ultra-long-term investors seeking extended investment duration with moderate profit prospects.
In summarizing, the most profitable options are those with expiration dates ranging from July to October 2024 and strike prices finely tuned based on investment horizons. The short-term option expiring in July, with a strike price of $87.5, provides the highest immediate profit potential. For near to intermediate-term strategies, the options expiring in October with strike prices of $92.5 and $87.5 balance risk and reward effectively. For long-term investors, the $85.0 and $90.0 strike price options offer a balance of volatility exposure and investment duration. Each investor should weigh these parameters carefully, aligning their objectives with the quantitative insights provided.
Short Put Option Strategy
When analyzing the short put options for WEC Energy Group, Inc. (WEC) with the objective of minimizing risk and maximizing profit, it's crucial to consider the Greeks, especially delta. The delta value provides an estimate of the likelihood that the option will finish in-the-money (ITM), which implies a potential assignment of shares. Lower delta values generally indicate a lower risk of the option finishing ITM, thus reducing the probability of having to buy shares at the strike price.
Considering the desired target of reducing exposure by choosing options with a strike price around 2% below the current stock price, we aim to avoid high-delta options. Here are five promising short put options categorized by expiration date, while factoring in their profitability and associated risks:
Near-Term Option: July 19, 2024
- Strike Price: $45
- Premium: $0.28
- ROI: 100%
- Profit: $0.28
- Delta: -0.0091
This option has the lowest delta, indicating a very low probability of assignment. With a premium of $0.28 and a return on investment (ROI) of 100%, it offers a balanced approach with a high profit for minimal risk. The gamma and vega are low, indicating less sensitivity to changes in the stock's price and volatility, respectively.
Short-to-Medium Term Option: August 16, 2024
- Strike Price: $70
- Premium: $0.28
- ROI: 100%
- Profit: $0.28
- Delta: -0.1046
Although the delta is higher compared to the near-term option, it remains within a low-risk range. This expiration date provides a better premium while still keeping the probability of assignment low. The theta indicates a manageable rate of time decay.
Medium-Term Option: October 18, 2024
- Strike Price: $67.5
- Premium: $0.42
- ROI: 100%
- Profit: $0.42
- Delta: -0.1353
This medium-term option offers a higher premium while maintaining an acceptable delta value. The theta and vega show that the option is sensitive to both time decay and volatility, yet it promises a significant profit with the trade-off of a moderate risk of assignment.
Longer-Term Option: January 17, 2025
- Strike Price: $65
- Premium: $0.80
- ROI: 100%
- Profit: $0.80
- Delta: -0.1306
With a considerable premium and a low delta, this longer-term option minimizes the risk of finishing ITM while providing an attractive profit. The combined effect of moderate gamma and theta suggests a balance between sensitivity to price movements and time decay, ensuring steady returns.
Longest-Term Option: January 17, 2025
- Strike Price: $75
- Premium: $2.67
- ROI: 100%
- Profit: $2.67
- Delta: -0.3507
This is the highest-risk option among the chosen ones with a delta indicating a more than moderate probability of assignment. However, for traders willing to take on slightly higher risk, the reward is significantly greater with a premium of $2.67. The vega and gamma values show that the option is sensitive to volatility and movements in the stock's price, but the substantial premium might justify the risk for more aggressive investors.
In summary, the analyzed options provide various levels of risk and reward based on their expiration dates and strike prices. Near-term options such as the $45 strike with a July 19, 2024 expiration offer low risk with decent returns. Medium to long-term options, including the $67.5 strike expiring on October 18, 2024, and the $65 strike expiring on January 17, 2025, offer higher premiums with managed risk levels. For traders seeking higher premiums and willing to accept higher risk, the $75 strike expiring on January 17, 2025, could be the most profitable option.
Vertical Bear Put Spread Option Strategy
When determining the most profitable vertical bear put spread strategy for WEC Energy Group (WEC), we must analyze specific options within the short and long put options data provided. This strategy entails purchasing a higher strike price put option and selling a lower strike price put option within the same expiration period, specifically looking for those that meet the target stock price being 2% above or below the current stock price.
Near-Term Options (Expiring 2024-07-19)
- Short Put Option: Strike $75.00, Long Put Option: Strike $77.50
- Short Put:
- Delta: -0.1524852518
- Premium: $0.27
- Long Put:
- Delta: -0.7038189489
- Premium: $4.4
- Risk/Reward Analysis:
- Profit on the long put position $4.4 - $4.4 = $0.999.
- Risk of assignment on the higher delta long put option: significant due to high delta.
- Max Profit: Strike difference - net premium paid = $77.50 - $75.00 - (4.4 - 0.27) = $1.77.
- Assignment Risk: Given the high delta on the long put, the risk of assignment is substantial.
- Short Put:
Medium-Term Options (Expiring 2024-08-16)
- Short Put Option: Strike $77.50, Long Put Option: Strike $85.00
- Short Put:
- Delta: -0.4405680907
- Premium: $1.73
- Long Put:
- Delta: -0.8123279192
- Premium: $4.3
- Risk/Reward Analysis:
- Profit on the long put position $4.3 - $1.73 = $1.0992.
- Risk of assignment on the higher delta long put option: significant due to high delta.
- Max Profit: Strike difference - net premium paid = $85.00 - $77.50 - (4.3 - 1.73) = $6.47.
- Assignment Risk: Medium
- Short Put:
Longer-Term Options (Expiring 2024-10-18)
-
Short Put Option: Strike $80.00, Long Put Option: Strike $85.00
- Short Put:
- Delta: -0.5285283553
- Premium: $3.8.
- Long Put:
- Delta: -0.9875899762
- Premium: $4.5
- Risk/Reward Analysis:
- Profit on the long put position $4.5 - $3.8 = $3.3992.
- Risk of assignment on the higher delta long put option is significant but somewhat mitigated by the shorter time frame to expiry.
- Max Profit: Strike difference - net premium paid = $5 - ($4.5 - $3.8) = $4.3.
- Assignment Risk: Medium
- Short Put:
-
Short Put Option: Strike $72.5, Long Put Option: Strike $77.5
- Short Put:
- Delta: -0.3220884595
- Premium: $1.65
- Long Put:
- Delta: -0.9875899762
- Premium: $8.0
- Risk/Reward Analysis:
- Profit on the long put position $8.0 - $1.65 = $6.35.
- Lower assignment risk on this option compared to the former one.
- Max Profit: Strike difference - net premium paid = $77.5 - $72.5 - $8.0 - $1.65 = $4.5.
- Assignment Risk: Lower compared to deep in-the-money puts.
- Short Put:
Long-Term Options (Expiring 2025-01-17)
- Short Put Option: Strike $72.50, Long Put Option: Strike $80.00
- Short Put:
- Delta: -0.2689931146
- Premium: $2.0.
- Long Put:
- Delta: -0.9875899762
- Premium: $6.2.
- Risk/Reward Analysis:
- Profit on the long put position $6.2 - $2.0 = $4.2.
- Moderate assignment risk, as the strategy spans a longer time with substantial at-the-money deltas.
- Max Profit: Strike difference - net premium paid = $80.0 - $72.5 - $6.2 - $2.0 = $4.95.
- Assignment Risk: Medium.
- Short Put:
In conclusion, while the trade-off between profitability and assignment risk varies with different expiry dates and strike levels, careful consideration is given to ensuring maximum returns with minimum possibility of being assigned unsold shares. The analysis indicates that a combination of medium-term options with moderate delta yet attractive premium can yield the best balance between profit and risk. Specifically, choosing options with expiration dates around 3 - 8 months, considering moderate delta and significant ROI, would be optimal for a vertical bear put spread on WEC Energy Group.
Vertical Bull Put Spread Option Strategy
When evaluating a vertical bull put spread as an options strategy for WEC Energy Group, Inc. (WEC), we need to carefully consider both the short and long put options, focusing on minimizing risk while maximizing profitability. The key to this strategy is selling a put option and then buying another put option at a lower strike price. This allows us to collect premiums upfront while limiting potential losses.
-
Near-Term Strategy (15 Days to Expiry on July 19, 2024):
- Short Put Option: Strike Price $70.0, Delta: -0.0609942837, Premium: $0.14.
- Long Put Option: Strike Price $67.5, Delta: -0.8785459047, Premium: $13.4.
The short put at $70.0 offers a favorable balance between premium collected and risk, given its relatively low delta, gamma, and theta values. The premium is $0.14 with an ROI of 100%. However, to minimize assignment risk, the long put at $67.5 has a very high delta (-0.8785459047), indicative of it being deep in the money, with a high premium of $13.4. This combination limits the potential risk if the stock price drops significantly.
Risk and Reward: - Maximum Profit: $0.14 - $13.4 = -$13.26 (not ideal due to high cost of the long put). - Maximum Loss: Limited to the difference in strikes minus net premium received ($70 - $67.5 - $0.14).
-
Short-Term Strategy (43 Days to Expiry on August 16, 2024):
- Short Put Option: Strike Price $72.5, Delta: -0.1499919178, Premium: $0.45.
- Long Put Option: Strike Price $70.0, Delta: -0.1046297052, Premium: $0.28.
This combination has a short put at $72.5 with a premium of $0.45, which compromises acceptable risk with a favorable return (Delta of -0.1499919178 indicates a decent probability of expiring OTM). Meanwhile, the long put at $70.0 collects a lower premium ($0.28), but it provides a hedge with limited additional cost.
Risk and Reward: - Maximum Profit: $0.45 - $0.28 = $0.17. - Maximum Loss: ($72.5 - $70) - $0.17 = $2.33.
-
Mid-Term Strategy (106 Days to Expiry on October 18, 2024):
- Short Put Option: Strike Price $77.5, Delta: -0.4449199811, Premium: $2.7.
- Long Put Option: Strike Price $75.0, Delta: -0.3220884595, Premium: $1.65.
The short put at $77.5 carries a higher premium ($2.7) with a delta of -0.4449199811, suggesting a higher risk of assignment but a substantial premium. The long put at $75.0 with a delta of -0.3220884595 also collects an adequate premium ($1.65) and helps to cap losses without heavy expenditure.
Risk and Reward: - Maximum Profit: $2.7 - $1.65 = $1.05. - Maximum Loss: ($77.5 - $75) - $1.05 = $1.45.
-
Long-Term Strategy (197 Days to Expiry on January 17, 2025):
- Short Put Option: Strike Price $75.0, Delta: -0.3507434119, Premium: $2.67.
- Long Put Option: Strike Price $72.5, Delta: -0.2689931146, Premium: $2.0.
This longer-term strategy involves a short put at $75.0 with a premium of $2.67 and delta of -0.3507434119. The long put at $72.5 with a delta of -0.2689931146 and premium of $2.0 provides a substantial hedge. This setup offers a significant premium with lower assignment risk due to the lower delta.
Risk and Reward: - Maximum Profit: $2.67 - $2.0 = $0.67. - Maximum Loss: ($75 - $72.5) - $0.67 = $1.83.
-
Very Long-Term Strategy (197 Days to Expiry on January 17, 2025):
- Short Put Option: Strike Price $70.0, Delta: -0.2039281093, Premium: $1.32.
- Long Put Option: Strike Price $65.0, Delta: -0.1305647632, Premium: $0.8.
This strategy uses the short put at $70.0 with a low delta (-0.2039281093) and a premium of $1.32, paired with the long put at $65.0 having a delta of -0.1305647632 and costing $0.8. This structure provides a lower risk of assignment, as lower delta values are indicative of further out-of-the-money options.
Risk and Reward: - Maximum Profit: $1.32 - $0.8 = $0.52. - Maximum Loss: ($70 - $65) - $0.52 = $4.48.
In summary, the most profitable options strategies depend on your risk tolerance and market outlook. Near-term options (15 days) provide quick potential wins but higher risk due to short time frames. Mid-term (43 days) options offer a balance between profit and risk. Long-term strategies (106 and 197 days) provide higher premiums with more moderate risk and better hedging possibilities due to time decay effects.
Vertical Bear Call Spread Option Strategy
When designing a vertical bear call spread strategy for WEC Energy Group, Inc. (WEC) based on the provided options chain, I have selected five tailored choices spanning from near-term to long-term expiration dates. Lets delve into the analysis for each time frame, factoring in the Greeks, potential profit and loss scenarios, and quantifying the risk.
Near-Term (Expiring 2024-07-19)
- Bear Call Spread with Strike Prices of 70.0 and 75.0:
- Short Call (Strike $70.0): Delta: 0.7567, Premium: $8.5, Theta: -0.1433
- Long Call (Strike $75.0): Delta: 0.6541, Premium: $3.4, Theta: -0.1110
Risk-Reward Analysis: - Max Profit: ( \text{Premium received} - \text{Premium paid} = 8.5 - 3.4 = 5.1 ) - Max Loss: ( \text{Strike difference} - \text{Net premium received} = 5 - 5.1 = -0.1 ) - Break-Even Point: ( 70 + \left( 5.1 / 5 \right) = 71.02 )
This strategy is profitable provided WEC stays below $70.0. The max loss potential is low due to the high premium received, but the assignment risk is significant here with a high delta value on the short call.
Short-Term (Expiring 2024-08-16)
- Bear Call Spread with Strike Prices of 70.0 and 75.0:
- Short Call (Strike $70.0): Delta: 0.7713, Premium: $9.4, Theta: -0.0426
- Long Call (Strike $75.0): Delta: 0.6431, Premium: $4.1, Theta: -0.0425
Risk-Reward Analysis: - Max Profit: ( 9.4 - 4.1 = 5.3 ) - Max Loss: ( 5 - 5.3 = -0.3 ) - Break-Even Point: ( 70 + \left( 5.3 / 5 \right) = 71.06 )
Again, the profit is attractive if WEC stays below $70. The considerable delta on the short call signifies a notable chance of assignment. The relatively balanced theta values indicate modest time decay impacts.
Mid-Term (Expiring 2024-10-18)
- Bear Call Spread with Strike Prices of 72.5 and 75.0:
- Short Call (Strike $72.5): Delta: 0.7390, Premium: $8.4, Theta: -0.0135
- Long Call (Strike $75.0): Delta: 0.6519, Premium: $6.4, Theta: -0.0146
Risk-Reward Analysis: - Max Profit: ( 8.4 - 6.4 = 2.0 ) - Max Loss: ( 2.5 - 2.0 = 0.5 ) - Break-Even Point: ( 72.5 + \left( 2 / 2.5 \right) = 73.3 )
The delta values show reduced assignment risk compared to the short-term spread. This spread is more conservative with a clearly defined risk and reward profile while ensuring the trade stays profitable if WEC remains below $72.5.
Long-Term (Expiring 2025-01-17)
- Bear Call Spread with Strike Prices of 75.0 and 80.0:
- Short Call (Strike $75.0): Delta: 0.6184, Premium: $6.6, Theta: -0.0106
- Long Call (Strike $80.0): Delta: 0.4484, Premium: $3.38, Theta: -0.0104
Risk-Reward Analysis: - Max Profit: ( 6.6 - 3.38 = 3.22 ) - Max Loss: ( 5 - 3.22 = 1.78 ) - Break-Even Point: ( 75 + \left( 3.22 / 5 \right) = 75.64 )
Here, the delta values are lower than the near or mid-term options, thus reducing the assignment risk. This spread ensures a good profit if WEC stays below $75 through to 2025.
Extended Long Term (Expiring 2025-01-17)
- Bear Call Spread with Strike Prices of 70.0 and 75.0:
- Short Call (Strike $70.0): Delta: 0.7018, Premium: $11.3, Theta: -0.0144
- Long Call (Strike $75.0): Delta: 0.6184, Premium: $6.6, Theta: -0.0106
Risk-Reward Analysis: - Max Profit: ( 11.3 - 6.6 = 4.7 ) - Max Loss: ( 5 - 4.7 = 0.3 ) - Break-Even Point: ( 70 + \left( 4.7 / 5 \right) = 70.94 )
The long-term perspective offers attractive premium income while managing assignment risks through reduced delta values. The long-term horizon balances potential profit against the time risk, with a low worst-case scenario loss.
In summary, the spread with the nearest expiration offers the most immediate results but also carries the highest risk of assignment. Moving towards longer expirations reduces this risk but also diminishes the maximum profit potential per strike difference ratio. Each selected spread considers the balance between profit, loss, and assignment risk, adhering to the objective of minimizing risks while ensuring the strategy remains profitable across different time frames.
Vertical Bull Call Spread Option Strategy
To design a profitable vertical bull call spread options strategy for WEC Energy Group, Inc. (WEC), we will analyze the given options chain and Greeks to identify the optimal set of near-term through long-term options. Our goal is to minimize assignment risksince having a part of the trade in the money (ITM) poses a higher assignment riskand at the same time capture significant potential profit.
Near-Term Choices
1. Near-Term Option Pair Expiring on July 19, 2024
- Call Option at Strike $65:
- Delta: 0.839960195
- Gamma: 0.0152020486
- Vega: 3.8197095854
- Theta: -0.1263069627
-
Premium: 17.5
-
Call Option at Strike $77.5:
- Delta: 0.5791306579
- Gamma: 0.1308471226
- Vega: 6.1726712031
- Theta: -0.0387709618
- Premium: 2.1
Risk and Reward Analysis: - Maximum profit: $77.5 - $65 - (17.5 - 2.1) = $64 - Maximum loss: 17.5 - 2.1 = $15.4 - Assignment risk: The $65 call has a high Delta of 0.84, indicating a high ITM probability.
Mid-Term Choices
2. Mid-Term Option Pair Expiring on August 16, 2024
- Call Option at Strike $70:
- Delta: 0.7713432231
- Gamma: 0.0237126431
- Vega: 7.9875634435
- Theta: -0.0426421561
-
Premium: 9.4
-
Call Option at Strike $77.5:
- Delta: 0.5527664995
- Gamma: 0.0754131951
- Vega: 10.5286770236
- Theta: -0.0236981571
- Premium: 2.2
Risk and Reward Analysis: - Maximum profit: $77.5 - $70 - (9.4 - 2.2) = $0.3 if the price is above $77.5. - Maximum loss: 9.4 - 2.2 = $17.2 - Assignment risk: The $70 call has a high Delta of 0.77, posing a substantial ITM probability.
Long-Term Choices
3. Long-Term Option Pair Expiring on October 18, 2024
- Call Option at Strike $75:
- Delta: 0.651863182
- Gamma: 0.0411683756
- Vega: 15.2174368528
- Theta: -0.0145686368
-
Premium: 6.4
-
Call Option at Strike $80:
- Delta: 0.4197114587
- Gamma: 0.0487590563
- Vega: 16.2757506927
- Theta: -0.0143313392
- Premium: 2.41
Risk and Reward Analysis: - Maximum profit: $80 - $75 - (6.4 - 2.41) = $6.01 - Maximum loss: 6.4 - 2.41 = $3.99 - Assignment risk: The $75 call has a moderate Delta of 0.65, indicating a balanced ITM probability.
4. Longer-Term Option Pair Expiring on January 17, 2025
- Call Option at Strike $72.5:
- Delta: 0.6906227692
- Gamma: 0.0268766103
- Vega: 19.2722558102
- Theta: -0.0099084284
-
Premium: 8.4
-
Call Option at Strike $77.5:
- Delta: 0.5373107162
- Gamma: 0.0341297872
- Vega: 22.1725682192
- Theta: -0.0107080757
- Premium: 5.25
Risk and Reward Analysis: - Maximum profit: $77.5 - $72.5 - (8.4 - 5.25) = $1.85 - Maximum loss: 8.4 - 5.25 = $3.15 - Assignment risk: The $72.5 call has a high Delta around 0.69, which can pose assignment risks.
5. Very Long-Term Option Pair Expiring on January 17, 2025
- Call Option at Strike $70:
- Delta: 0.701845179
- Gamma: 0.0177046304
- Vega: 18.9113214924
- Theta: -0.0144005051
-
Premium: 11.3
-
Call Option at Strike $75:
- Delta: 0.6184319499
- Gamma: 0.0306000302
- Vega: 21.0949897699
- Theta: -0.0106479909
- Premium: 6.6
Risk and Reward Analysis: - Maximum profit: $75 - $70 - (11.3 - 6.6) = $1.7 - Maximum loss: 11.3 - 6.6 = $4.7 - Assignment risk: The $70 call has a Delta around 0.70, indicating an increased ITM probability.
Conclusion
Among the choices, the most balanced trade that minimizes assignment risk while still providing a good potential profit appears to be the mid-term Option Pair expiring on October 18, 2024, with strikes at $75/$80 or the long-term options expiring in January 2025 at similar strike selections. These provide adequate buffer against the ITM assignment with favorable risk-reward ratios.
Spread Option Strategy
In analyzing the options chain data for WEC Energy Group, Inc. (WEC), with a focus on a calendar spread strategy that involves buying a call option and selling a put option, it is essential to consider the Greeks, the premiums, the potential profitability, and the risks of shares being assigned. The goal is to identify the most profitable calendar spreads while minimizing the risk of being assigned shares.
Near-Term Opportunities (Expiring on 2024-07-19):
- Long Call (Strike: 75.0, Expire: 2024-07-19) and Short Put (Strike: 72.5, Expire: 2024-07-19):
- Call Option:
- Delta: 0.6541
- Gamma: 0.0404
- Vega: 5.8169
- Theta: -0.1111
- Premium: $3.40
- ROI: 35.32%
- Put Option:
- Delta: -0.1046
- Gamma: 0.0386
- Vega: 2.8682
- Theta: -0.0283
- Premium: $0.10
- ROI: 100%
- Analysis:
- This combination provides a strong balance between profitability and limited risks. The call option has a moderate delta indicating good responsiveness to stock price changes, and the short put has a negative delta, which counters some of the assignment risks.
- Profit Scenario:
- If the stock price rises by 2%, the call would increase in value significantly.
- The received premium for the put option contributes directly to profitability.
- Potential Risks:
- Potential assignment if the stock price falls below the put strike of 72.5 but is relatively lower risk due to the moderate delta.
Medium-Term Opportunities (Expiring on 2024-08-16):
- Long Call (Strike: 75.0, Expire: 2024-08-16) and Short Put (Strike: 75.0, Expire: 2024-08-16):
- Call Option:
- Delta: 0.6431
- Gamma: 0.0370
- Vega: 9.9082
- Theta: -0.0425
- Premium: $4.10
- ROI: 12.21%
- Put Option:
- Delta: -0.2619
- Gamma: 0.0626
- Vega: 8.6987
- Theta: -0.0194
- Premium: $0.90
- ROI: 100%
- Analysis:
- The longer expiration provides more time for the position to gain value. The same strike price strategy for both legs simplifies the spread, benefiting from both premiums and robust Greek values.
- Profit Scenario:
- A stock price increase directly benefits the call and premium received from the put.
- Potential Risks:
- Higher assignment risk given the deep negative delta put at the same strike.
Longer-Term Opportunities (Expiring on 2024-10-18):
- Long Call (Strike: 70.0, Expire: 2024-10-18) and Short Put (Strike: 67.5, Expire: 2024-10-18):
- Call Option:
- Delta: 0.7567
- Gamma: 0.0224
- Vega: 4.9310
- Theta: -0.1433
- Premium: $8.50
- ROI: 12.95%
- Put Option:
- Delta: -0.1354
- Gamma: 0.0195
- Vega: 9.1119
- Theta: -0.0112
- Premium: $0.42
- ROI: 100%
- Analysis:
- This longer-dated spread allows capturing more volatility adjustments while minimizing immediate assignment risks due to deep OTM short put.
- Profit Scenario:
- Strong stock performance and a steady increase in the call option premium while collecting stable income from puts.
- Potential Risks:
- Lower assignment risk but depends on how far in/out-of-the-money the options remain.
Long-Term Opportunities (Expiring on 2025-01-17):
- Long Call (Strike: 75.0, Expire: 2025-01-17) and Short Put (Strike: 72.5, Expire: 2025-01-17):
- Call Option:
- Delta: 0.6541
- Gamma: 0.0404
- Vega: 9.9082
- Theta: -0.0425
- Premium: $3.40
- ROI: 35.32%
- Put Option:
- Delta: -0.2689
- Gamma: 0.0296
- Vega: 18.7018
- Theta: -0.0088
- Premium: $2.00
- ROI: 100%
- Analysis:
- Optimal balance between call profitability and high put premium collection. The spread benefits from lower theta decay over the extended period.
- Profit Scenario:
- The call option would appreciate over time with rising stock prices, and collected put premiums add to the gains.
- Potential Risks:
- Slightly higher delta on the puts increase assignment risks.
Conclusion
Choosing the best calendar spread strategy involves balancing profitability with risks. The five strategies listed here provide various combinations of these elements with different expiration periods:
- Short-Term (2024-07-19) with strike 75/72.5
- Medium-Term (2024-08-16) with strike 75/75
- Medium-Long (2024-10-18) with strike 70/67.5
- Long-Term (2025-01-17) with strike 75/72.5
These choices theoretically maximize profits while providing different levels of protection against assignment risks. Each option must be revisited and potentially adjusted as market conditions evolve.
Calendar Spread Option Strategy #1
When analyzing the most profitable calendar spread options strategy for WEC Energy Group, Inc. (WEC), we should consider both the long put and the short call options. To minimize the risk of having shares assigned, we focus on choosing options that are out of the money or barely in the money, while balancing premium, Greeks, and profitability.
Option #1: Near-Term Strategy
Long Put: - Strike Price: $87.5 - Expiration Date: 2024-07-19 - Premium: $2.95 - Delta: -0.9499 - Gamma: 0.0191 - Vega: 1.5878 - Theta: -0.0162 - Rho: -0.0344 - ROI: 1.6777 - Profit: $4.9492
Short Call: - Strike Price: $105.0 - Expiration Date: 2024-07-19 - Premium: $0.43 - Delta: 0.0514 - Gamma: 0.0078 - Vega: 1.6683 - Theta: -0.0474 - Rho: 0.0015 - ROI: 100.0 - Profit: $0.43
Risk Analysis:
- Risk of Assignment: The risk of assignment is minimized due to the out-of-the-money nature of the short call (strike at $105.0 while the stock price is likely around $90).
- Potential Scenarios: If the stock price remains at or slightly below $90 by the expiration of the long put, significant profit can be leveraged from its high delta and low premium.
Option #2: Moderate-Term Strategy
Long Put: - Strike Price: $92.5 - Expiration Date: 2024-10-18 - Premium: $8.0 - Delta: -0.9876 - Gamma: 0.0000 - Vega: 0.0000 - Theta: 0.0020 - Rho: -0.2652 - ROI: 0.6124 - Profit: $4.8992
Short Call: - Strike Price: $100.0 - Expiration Date: 2024-07-19 - Premium: $0.19 - Delta: 0.0205 - Gamma: 0.0054 - Vega: 0.7833 - Theta: -0.0152 - Rho: 0.0006 - ROI: 100.0 - Profit: $0.19
Risk Analysis:
- Risk of Assignment: The assignment risk is low with a call strike price above the target range.
- Potential Scenarios: The high delta of the long put allows capturing significant downward movement in the stock price up to expiration, while the low premium short call minimizes loss on the written side.
Option #3: Long-Term Strategy
Long Put: - Strike Price: $87.5 - Expiration Date: 2024-10-18 - Premium: $4.5 - Delta: -0.9876 - Gamma: 0.0000 - Vega: 0.0000 - Theta: 0.0014 - Rho: -0.2509 - ROI: 0.7554 - Profit: $3.3992
Short Call: - Strike Price: $100.0 - Expiration Date: 2025-01-17 - Premium: $0.35 - Delta: 0.2038 - Gamma: 0.0138 - Vega: 11.8489 - Theta: -0.0268 - Rho: 0.0402 - ROI: 100.0 - Profit: $0.35
Risk Analysis:
- Risk of Assignment: The assignment on this long-term call option is potentially higher but remains low given the delta and higher strike price.
- Potential Scenarios: The long put provides significant downside protection with a lean towards accelerated profit due to its high delta and Greek profile stability.
Option #4: Very Long-Term Strategy
Long Put: - Strike Price: $95.0 - Expiration Date: 2025-01-17 - Premium: $0.5 - Delta: -0.0966 - Gamma: 0.0151 - Vega: 9.7468 - Theta: -0.0048 - Rho: 0.0381 - ROI: 100.0 - Profit: $0.5
Short Call: - Strike Price: $80.0 - Expiration Date: 2025-01-17 - Premium: $3.38 - Delta: 0.4484 - Gamma: 0.0357 - Vega: 22.2291 - Theta: -0.0104 - Rho: 0.1704 - ROI: 100.0 - Profit: $3.38
Risk Analysis:
- Risk of Assignment: Low to moderate risk due to the proximity of the short call option strike price to the market price.
- Potential Scenarios: While the profit from the short call is attractive, the low delta of the long put suggests limited downside capture but stability over the long term.
Option #5: Ultra Long-Term Strategy
Long Put: - Strike Price: $87.5 - Expiration Date: 2025-01-17 - Premium: $1.1 - Delta: -0.2102 - Gamma: 0.0275 - Vega: 16.3719 - Theta: -0.0074 - Rho: 0.0822 - ROI: 100.0 - Profit: $1.1
Short Call: - Strike Price: $77.5 - Expiration Date: 2025-01-17 - Premium: $5.25 - Delta: 0.5373 - Gamma: 0.0341 - Vega: 22.1726 - Theta: -0.0107 - Rho: 0.2009 - ROI: 100.0 - Profit: $5.25
Risk Analysis:
- Risk of Assignment: The risk of assignment for this short call is moderate due to the strike being closer to potentially current tradable prices.
- Potential Scenarios: The ultra-long-term horizon allows absorbing significant downside movements, while the larger premium from the short call compensates for potential capped upside.
In conclusion, for WEC Energy Group, utilizing the above combinations leverages profitability by choosing options thoughtfully based on their Greek values, potential return on investment, and premium values, while also balancing the risk of early assignment. This approach provides a diversified mix of short and long-term positions tailored for varying risk tolerances and market outlooks.
Calendar Spread Option Strategy #2
To develop a robust and profitable calendar spread strategy using the provided options data, we'll focus on minimizing risks related to having shares assigned due to holding in-the-money options while maximizing potential profits. Specifically, we'll achieve this by selling a put option with a distant expiration date and buying a call option with a nearby expiration date at a different strike price. This will allow us to capitalize on the time decay (Theta) and volatility changes (Vega) differentials between the options. Given that the target stock price is within a 2% range of the current price, we must select strike prices near this range to exploit price movements more effectively.
Option Pair 1
Sell Put: Strike: 95.0, Expire: 2024-10-18
- Delta: -0.8451
- Gamma: 0.0168
- Vega: 9.4331
- Theta: -0.0117
- Premium: $14.2
- Profit: $1.1992
Buy Call: Strike: 115.0, Expire: 2024-07-19
- Delta: 0.0426
- Gamma: 0.0055
- Vega: 1.4341
- Theta: -0.0500
- Premium: $0.1
- Profit: $0.1
Analysis: This combination leverages a long further-out put option to benefit from volatility (high Vega) while the short call near-term benefits from rapid time decay (high Theta). Even though the long put has a significant premium cost, the short call's minimal premium limits the maximum risk exposure.
Option Pair 2
Sell Put: Strike: 87.5, Expire: 2024-10-18
- Delta: -0.9876
- Gamma: 0.0
- Vega: 0.0
- Theta: 0.0014
- Premium: $4.5
- Profit: $3.3992
Buy Call: Strike: 77.5, Expire: 2024-08-16
- Delta: 0.5528
- Gamma: 0.0754
- Vega: 10.5287
- Theta: -0.0237
- Premium: $2.2
- Profit: $2.2
Analysis: This pair offers a notable return on investment by selling a deeply in-the-money puts, reflecting the highest intrinsic value minimized gamma risk. Meanwhile, the closer expiration buy-call offers noticeable gamma and Vega, allowing us to benefit from slight upward movements in stock price and volatility increases.
Option Pair 3
Sell Put: Strike: 87.5, Expire: 2025-01-17
- Delta: -0.2102
- Gamma: 0.0
- Vega: 0.0
- Theta: 0.0014
- Premium: $1.1
- Profit: $1.1
Buy Call: Strike: 77.5, Expire: 2024-08-16
- Delta: 0.6431
- Gamma: 0.0370
- Vega: 9.9082
- Theta: -0.0425
- Premium: $4.1
- Profit: $2.6208
Analysis: This strategy provides a lower risk profile due to the lower Delta of the sold put, reducing the likelihood of assignment. The call option bought further out also ensures that we are not overly exposed to near-term volatility, hence balancing risk well.
Option Pair 4
Sell Put: Strike: 85.0, Expire: 2024-10-18
- Delta: -0.8123
- Gamma: 0.0375
- Vega: 10.8015
- Theta: -0.0072
- Premium: $4.3
- Profit: $1.0992
Buy Call: Strike: 75.0, Expire: 2024-10-18
- Delta: 0.6519
- Gamma: 0.0412
- Vega: 15.2174
- Theta: -0.0146
- Premium: $6.4
- Profit: $4.9208
Analysis: This option pair capitalizes on very high returns by holding an option series that neutralizes the risks between the long put's high Vega and the near-term calls high gamma. The strike price selection within the same expiration month also harmonizes the timing strategy well.
Option Pair 5
Sell Put: Strike: 90.0, Expire: 2024-10-18
- Delta: -0.7569
- Gamma: 0.0222
- Vega: 12.7204
- Theta: -0.0176
- Premium: $9.0
- Profit: $1.3992
Buy Call: Strike: 70.0, Expire: 2024-10-18
- Delta: 0.6914
- Gamma: 0.0154
- Vega: 14.4384
- Theta: -0.0348
- Premium: $13.07
- Profit: $6.5908
Analysis: Both options expiring in the distant future give room for substantial price movement, and the premium collection vastly outweighs the call purchase due to layered high Vega influences. This structure significantly leverages profitability against minimal Theta decay, ensuring an extended profitability window.
Similar Companies in Regulated Electric:
Alliant Energy Corporation (LNT), CMS Energy Corporation (CMS), Exelon Corporation (EXC), Evergy, Inc. (EVRG), Ameren Corporation (AEE), Pinnacle West Capital Corporation (PNW), MGE Energy, Inc. (MGEE), CenterPoint Energy, Inc. (CNP), FirstEnergy Corp. (FE), Report: Edison International (EIX), Edison International (EIX), Public Service Enterprise Group Incorporated (PEG), Entergy Corporation (ETR), PNM Resources, Inc. (PNM), DTE Energy Company (DTE), Report: American Electric Power Company, Inc. (AEP), American Electric Power Company, Inc. (AEP), Report: Duke Energy Corporation (DUK), Duke Energy Corporation (DUK), Report: NextEra Energy, Inc. (NEE), NextEra Energy, Inc. (NEE), Report: Southern Company (SO), Southern Company (SO), Report: Xcel Energy Inc. (XEL), Xcel Energy Inc. (XEL), PG&E Corporation (PCG)
https://finance.yahoo.com/news/wec-energy-group-prices-1-083652288.html
https://finance.yahoo.com/news/institutional-owners-may-dramatic-actions-151805579.html
https://finance.yahoo.com/news/why-wec-energy-wec-down-153141668.html
https://seekingalpha.com/article/4697033-my-top-10-high-yield-dividend-stocks-june-2024
https://www.youtube.com/watch?v=MW9n5EtbFu4
https://seekingalpha.com/article/4697771-buy-alert-2-top-dividend-stocks-to-buy-in-june
https://finance.yahoo.com/news/delighted-wec-energy-group-inc-115605550.html
https://finance.yahoo.com/news/degen-disciplined-why-trading-utility-105000968.html
https://finance.yahoo.com/news/ebr-wec-better-value-stock-154009363.html
https://finance.yahoo.com/news/oge-energy-wec-energy-northwest-150517053.html
https://www.sec.gov/Archives/edgar/data/783325/000010781524000155/wec-20240331.htm
Copyright © 2024 Tiny Computers (email@tinycomputers.io)
Report ID: yNrN3I
Cost: $0.59271
https://reports.tinycomputers.io/WEC/WEC-2024-07-02.html Home