Crown Castle Inc. (ticker: CCI)
2024-01-21
 Crown Castle Inc. (CCI) is an American telecommunication infrastructure company that specializes in owning, operating, and leasing cell towers, small cells, and fiber networks critical for the provision of wireless communication services. As of the knowledge cutoff in early 2023, the company's extensive portfolio consists of approximately 40,000 cell towers and more than 80,000 route miles of fiber supporting small cells and fiber solutions. Headquartered in Houston, Texas, Crown Castle operates predominantly in the United States, providing infrastructure solutions to a wide range of customers, including wireless carriers, enterprises, and cable companies. With the burgeoning demand for high-speed mobile and data services, the rollout of 5G technology, and the increasing need for connectivity, Crown Castle's services are pivotal. The company's business model focuses on long-term leases, which provides stability in cash flows and positions it to capitalize on the continuous growth in mobile data traffic. Crown Castle Inc. is a publicly traded company listed on the New York Stock Exchange and is a constituent of the S&P 500 index. The company is structured as a Real Estate Investment Trust (REIT), allowing it to benefit from certain tax advantages while providing investors with regular dividend payments.
| Address | 8020 Katy Freeway | City | Houston | State | TX |
| Zip Code | 77024-1908 | Country | United States | Phone | 713 570 3000 |
| Fax | 713 570 3100 | Website | crowncastle.com | Industry | REIT - Specialty |
| Sector | Real Estate | Full Time Employees | 5,000 | Previous Close | 107.79 |
| Open | 108.55 | Day Low | 106.8811 | Day High | 108.94 |
| Dividend Rate | 6.26 | Dividend Yield | 5.80% | Payout Ratio | 174.86% |
| 5 Year Avg Dividend Yield | 3.62 | Beta | 0.766 | Trailing PE | 30.16 |
| Forward PE | 36.72 | Volume | 4,177,296 | Average Volume | 3,609,080 |
| Average Volume 10 days | 3,214,340 | Bid | 107.55 | Ask | 108.39 |
| Market Cap | 46,825,402,368 | 52 Week Low | 84.72 | 52 Week High | 153.98 |
| Price to Sales TTM | 6.622 | Enterprise Value | 75,437,383,680 | Profit Margins | 21.96% |
| Shares Outstanding | 433,688,992 | Shares Short | 3,326,977 | Held Percent Insiders | 0.389% |
| Held Percent Institutions | 92.625% | Short Ratio | 0.77 | Short Percent of Float | 0.89% |
| Book Value | 15.366 | Price to Book | 7.03 | Net Income to Common | 1,552,999,936 |
| Trailing EPS | 3.58 | Forward EPS | 2.94 | Enterprise To Revenue | 10.669 |
| Enterprise To EBITDA | 17.953 | Earnings Quarterly Growth | -36.8% | Revenue Growth | -4.5% |
| Gross Margins | 71.051% | EBITDA Margins | 59.426% | Operating Margins | 33.953% |
| Total Cash | 117,000,000 | Total Debt | 28,728,999,936 | Total Revenue | 7,071,000,064 |
| Sharpe Ratio | -16.236541691087147 | Sortino Ratio | -260.5249477557004 |
| Treynor Ratio | -0.2163229047002663 | Calmar Ratio | -0.5183281374175105 |
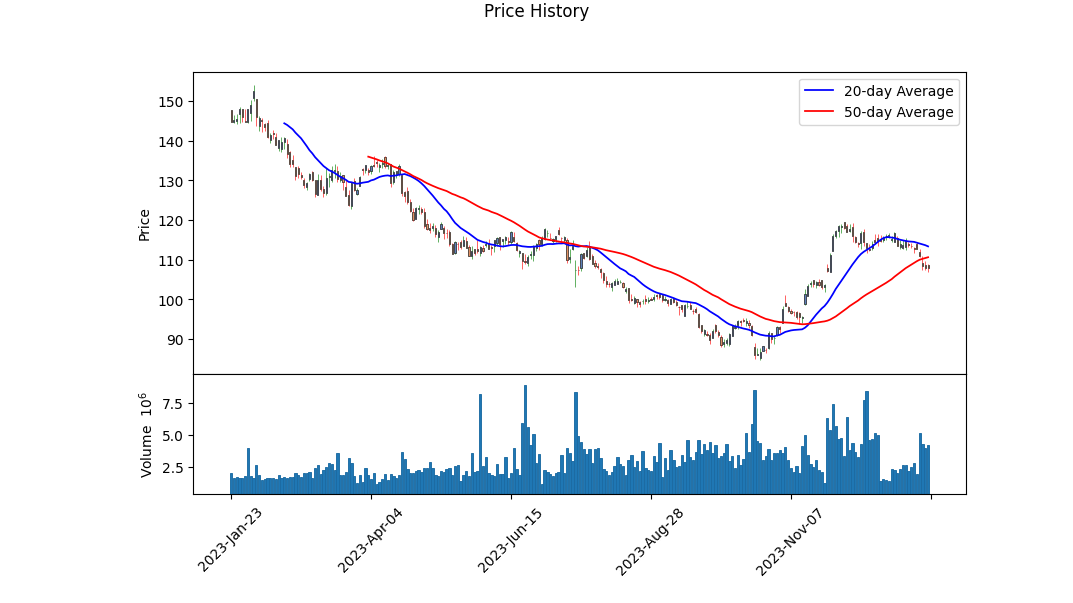
Technical Analysis provides us with a meticulous view of the stock's behavior over the selected timeframe. The Ending Balance on the Volume of Balance (OBV) shows positive momentum which, alongside an improvement from negative to less negative values in the MACD histogram, suggests that the stock's momentum might be shifting towards the positive. This could indicate higher investor interest and buying activity that may support a bullish trend.
Examining our companys fundamentals presents a mixed image. The trailing PEG ratio is above 4, which may suggest the stock is overvalued based on expected growth rates. This could be a point of concern for growth-oriented investors, signifying that the stocks price may not be supported by projected earnings growth. EBITDA and gross margins maintain healthy values, signifying efficient operations and strong profitabilityat least at the core business level. Evaluating recent reporting periods reveals increases in revenue and net income, suggesting a company that is growing and efficiently managing its revenues and expenses.
The company's balance sheet must be assessed with caution. A high level of net debt compared to cash balances could be a cause for concern, indicating reliance on leverage for operations and growth. This observation should be balanced with the consideration of industry standards and the company's track record in handling its debt.
Analyst expectations are pivotal in assessing future performance. Current EPS estimates alongside the revenue and earnings history suggest that the company might be facing challenges in meeting analysts' expectations. The EPS revisions and growth estimates denote a slightly bearish sentiment given the reduction in estimates and a projection for decreased growth in the coming year.
However, exceptionally negative values on the risk-adjusted return ratiosSharpe, Sortino, Treynor, and Calmarsuggest recent performance has been disappointing relative to the risk taken on by investors. These statistics warn us that the stock has not compensated investors adequately for the volatility endured and that recent returns have been quite adverse.
The financial scorecard shows an Altman Z-Score that places the company in the 'distress' zone, alluding to potential bankruptcy risk, while a Piotroski score of 6 out of 9 indicates a moderate level of financial soundness. The data also shows a negative working capital situation and retained earnings deficit, which could indicate liquidity issues and potentially inefficient management of resources or aggressive dividend payments in the past.
In conclusion, while some technical indicators may signal a potential uptick in price momentum, a holistic assessment considering risk-return metrics, fundamental analysis, and analyst sentiment suggests that cautious optimism should be exercised. One could argue that the shifting momentum could yield short-term gains, yet the backdrop of financial and valuation concerns alongside negative growth revisions entails the possibility of price correction or continued volatility. Staying attuned to the forthcoming quarterly reports, conference calls, and any strategic shifts will be vital in discerning the trajectory of the company's stock price movement in the upcoming months. Decisions should be tuned to the evolving market conditions and emerging data points affecting the company's industry and financial performance.
| Statistic Name | Statistic Value |
| R-squared | 0.359 |
| Adjusted R-squared | 0.359 |
| F-statistic | 703.5 |
| Prob (F-statistic) | 2.06e-123 |
| Log-Likelihood | -2,267.3 |
| No. Observations | 1,256 |
| AIC | 4,539 |
| BIC | 4,549 |
| coef (CCI) | 0.8367 |
| std err | 0.032 |
| t (CCI) | 26.523 |
| P>|t| | 0.000 |
| [0.025 | 0.775 |
| 0.975] | 0.899 |
| const | -0.0234 |
| Omnibus | 58.245 |
| Prob(Omnibus) | 0.000 |
| Jarque-Bera (JB) | 189.490 |
| Prob(JB) | 7.12e-42 |
| Skew | -0.015 |
| Kurtosis | 4.903 |
| Cond. No. | 1.32 |
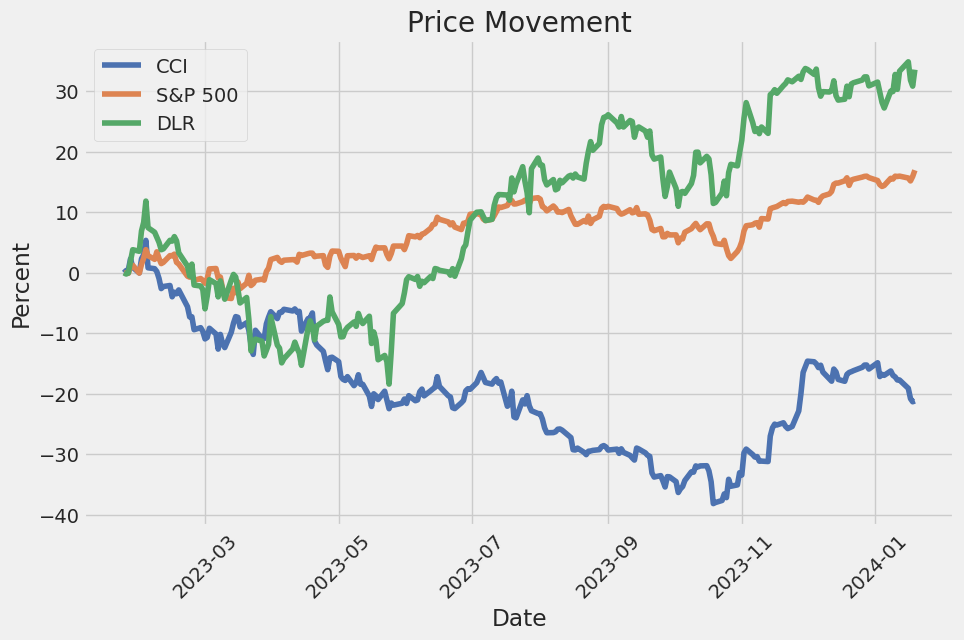
The linear regression model analyzing the relationship between CCI (Commodity Channel Indexan indicator used in technical analysis to identify cyclical trends in commodities) and SPY (the ETF that tracks the S&P 500, often used as a representation of the entire market) suggests that there is a positive, albeit not strong, linear relationship between these two variables up until the current day. This is evident from the model's positive beta coefficient of approximately 0.837, indicating that for every one point increase in the CCI, there is an average increase of 0.837 points in the value of SPY. However, the R-squared value of 0.359 implies that only about 35.9% of the variability in SPY can be explained by changes in CCI, which means that while there is a correlation, many other factors also affect SPY's performance.
The alpha of the model, which represents the y-intercept or the expected value of SPY when CCI is zero, is approximately -0.0234. In financial context, alpha is often interpreted as the excess return or active return on an investment. However, in the context of this linear regression, a negative alpha indicates that when CCI is at zero, the expected value of SPY would theoretically be slightly negative. Though statistically, the alpha's p-value is higher than the common significance level, and we cannot reject the null hypothesis that the alpha could be zero. Therefore, this model's alpha, with a high p-value of 0.573, is not statistically significant, undermining its reliability as a predictor of SPY's performance when CCI is at zero.
Executive Summary: Crown Castle's Q3 2023 Earnings Call
Crown Castle Inc. held its third-quarter 2023 earnings conference call. Key speakers included CEO Jay Brown and CFO Dan Schlanger, with Kris Hinson from Corporate Finance overseeing the call. Despite industry changes, Crown Castle's results showcased consistent growth, and they expect a return to growth in adjusted funds from operations (AFFO) in the second half of 2024.
The company remains committed to its full-year 2023 outlook for revenue, adjusted EBITDA, and AFFO, and plans to maintain the dividend in 2024 despite non-recurring Sprint-related churn and lower service contributions. Jay Brown affirmed the company's strategy to grow by leveraging its tower business combined with its portfolio of small cells and fiber. This diversified approach aims to capture demand as customers focus on 5G network densification. They expect organic revenue growth across their business assets to be up from 4% in 2023 to 5% in 2024.
Crown Castle has refined its operational processes, resulting in a workforce reduction and $105 million in annual savings. They plan to move about 1,000 employee positions to a centralized location by Q3 2024 to further consolidate operations and improve customer experience. The company has reiterated its confidence in maintaining its annualized dividend, which is backed by strong organic growth and efficient operating leverage from cost reduction actions.
Their differentiated investment strategy in towers, small cells, and fiber assets positions them well to capitalize on long-term data demand growth. They predict a significant increase in small cell deployments in 2024, with plans to deploy an unprecedented number of new nodes. Crown Castle has developed a renowned capacity for operating fiber networks essential for small cell functionality and navigating complicated municipal permitting processes effectively.
Furthermore, disciplined capital allocation is central to their operations as Crown Castle ensures investments are adjusted to the returns required. Their investment strategy has proven successful in towers and is expected to replicate in the small cell business, where they predict continued long-term value creation. Dan Schlanger's impending departure from the company was also announced, expressing gratitude for his contribution to the company's growth and the initiation of a search for his replacement. Crown Castle forecasts a challenging first half of 2024 but remains confident in their ability to self-fund CapEx, maintain dividends, and achieve sustainable growth in the coming years.
Q&A Highlights
Questions from analysts covered topics such as leasing activity, returns on small cells compared to traditional towers, centralization of business operations, potential non-core assets, and strategic asset sales or M&A opportunities. Crown Castle's leasing guidance for towers in 2024 assumes a stable activity level from the second half of 2023, with a focus on organic growth from both towers and small cells. The company remains disciplined in evaluating returns against capital costs, considering repurchases as the stock price influences investment opportunities.
Centralizing operations is viewed as a strategy to reduce costs and enhance customer experience without causing operational disruption. Small cell returns are reported to be robust, and the company expects increased colocation on multi-tenant systems to continue driving returns well into the future. They also addressed the increase in operational costs expected in 2024 as well as Crown Castles ability to maintain the dividend in the face of cash AFFO possibly being below dividend obligations for a period of time, detailing multiple sources of funding to cover this gap.
Finally, there was discussion on continued strategic investments and the relationship between cash expenditures and node deployments, with an emphasis on the planned increase in new small cell nodes in 2024 and an assurance that these would be fully covered by current resources without affecting the planned capex.
to interest rate risk by maintaining a mix of fixed and floating rate debt that we believe is appropriate after evaluating current market conditions and economic expectations. As of September 30, 2023, 86% of our total debt had fixed coupon rates, with the remainder having floating interest rates.
A hypothetical 1% increase in the interest rate would have a minimal impact on our floating rate debt given its relatively small proportion of our total debt portfolio. However, any significant increase in market interest rates would increase borrowing costs for future debt issuances, including the use of our available credit facilities, such as the 2016 Revolver, and could potentially increase the cost of financing our discretionary investments, such as construction and acquisitions.
For the first nine months of 2023, interest expense and amortization of deferred financing costs, net, were $627 million, a 24% increase from the same period in 2022. The rise primarily resulted from an increase in variable interest rates on our 2016 Term Loan A, 2016 Revolver, and outstanding Commercial Paper Notes, as well as an increase in our overall outstanding indebtedness owing to financing our discretionary capital expenditures.
Operational investments in our business through capital expenditures represent a significant use of our liquidity sources. For the nine months ended September 30, 2023, we reported discretionary capital expenditures of $961 million, which were predominately related to enhancements, construction of new communications infrastructure, and land purchases. Sustaining capital expenditures accounted for $55 million, primarily covering maintenance and ordinary corporate expenses. Our focus on efficient capital investment supports our growth strategy targeting long-term dividends per share.
As of October 30, 2023, we had $160 million drawn and $6.8 billion in undrawn capacity under our 2016 Revolver. We intend to maintain available commitments under this Revolver equal to the amount of any outstanding commercial paper, to ensure we have adequate liquidity to cover such obligations.
Our liquidity position also includes cash generated from operations, which primarily support dividend payments, discretionary and sustaining capital expenditures, and charges associated with the restructuring initiative initiated in July 2023. The restructuring plan includes reducing our workforce by approximately 15%, discontinuing certain services in the tower segment, and consolidating office space. For the third quarter of 2023, we incurred $72 million in restructuring charges, with cash expenditures primarily associated with employee severance, facility lease obligations, and asset write-downs.
Looking forward, we expect our site rental revenue growth to be positively influenced by ongoing demand for data-driven tenant additions, with $160 million received primarily in the first half of 2023 in relation to the Sprint Cancellations. We anticipate continued investments in constructing small cells and fiber solutions, reflecting robust market demand and expected contributions to overall cash flow growth and long-term value creation for our shareholders.
For the three months ended September 30, 2023, net income was $265 million, a decrease from $419 million in the same period the previous year. This reduction was due to several factors, including a decrease in towers' operating profit, increases in restructuring charges, interest expenses, and depreciation and amortization costs. Adjusted EBITDA decreased by $30 million, or 3%, for the quarter compared to the prior year.
Our financial strategy emphasizes a balanced approach to managing our leverage ratio, targeted at around five times Adjusted EBITDA, dividend payments to our stockholders, and prudent capital investments to stimulate long-term growth in our cash flows and dividends per share. We remain vigilant over market conditions and interest rate volatility as we continue to manage our capital structure and investment decisions.
In the milieu of dividend stocks garnering investor attention for the year 2024, Crown Castle Inc. (NYSE: CCI) stands out as an intriguing company amid an uncertain economic landscape. Crown Castle, a REIT specializing in communication infrastructure such as cell towers and fiber networks, has a compelling profile that merits a closer look. With over 40,000 cell towers and around 85,000 route miles of fiber across the United States, the company generates significant revenue from servicing major telecommunications operators.
Despite a challenging fiscal landscape wherein many stocks underwent valuation declines, Crown Castle has managed to spark interest among investor circles. This interest is partly due to the impactful involvement of Elliott Management, an activist investment firm known for advocating change to unlock shareholder value. The firm's engagement in Crown Castle underscores investor confidence and the potential for shifts in corporate governance.
Crown Castle's commitment to paying dividends is notable, particularly when compared to its historical performance, which boasts a resilient track record of payouts despite market fluctuations. Such stability is attractive to investors looking for long-term income generation.
From an analytical standpoint, Crown Castle exhibits strong financial indicators. Zacks Equity Research points out that although there was a downturn in Crown Castle's stock performance reflected on December 19, 2023, the company showed an uptick of 1.4% over a recent trading session. Furthermore, Crown Castle's comparison within its industry reveals that it is trading at a premium with a Forward Price-to-Earnings (P/E) ratio higher than the industry average.
Even as the company faced headwinds, including increased competition and threats from satellite communications, it has maintained an active investment approach. Plans for discretionary capital expenditures and investments in fiber and tower infrastructure demonstrate Crown Castle's strategic initiative to uphold and expand its competitive edge in telecom services.
Moreover, Crown Castle's strategic positions on investment and future projections, discussed on Seeking Alpha, indicate a robust growth forecast, particularly in the small cell segment and fiber solutions. This growth is expected to contribute positively to the company's organic revenue. The assessment underscores Crown Castle's capabilities in dealing with the shifting telecommunications domain and reflects its position within the larger 5G network infrastructure puzzle.
On a valuation basis, despite modest projections, Crown Castle is reflected as potentially undervalued. Discussions on Seeking Alpha and Zacks Equity Research bring to light a notable upside based on current valuations and Crown Castle's unique assets and market position. It's also important to note that macroeconomic predictions of possible rate cuts could further bolster the attractiveness of Crown Castle as an investment.
Comparatively, in the REIT and Equity Trust sector, Crown Castle has been juxtaposed against other stocks to evaluate its value proposition. For instance, in a January 4, 2024, article by Zacks, Outfront Media emerged as the more compelling value stock when compared to Crown Castle, which may guide investors with specific value-centric criteria in their decision-making process.
Crown Castle's near-term operational challenges include its decision to halt dividend increases until at least 2025; however, the company's capacity for strategic changesuch as the potential divestiture of its fiber and small cell businesscould alter its course favorably.
As insights from The Motley Fool and other sources converge, they emphasize Crown Castle's readiness to rebound from current market conditions and benefit from future economic shifts, especially within the REIT sector, that favor reduced interest rates. The combination of factors such as Crown Castle's substantial infrastructure, the potential loosening of monetary policy, and strategic reviews make it a candidate for consideration among dividend stock options for 2024.
Investors are encouraged to follow the developments around Crown Castle and review in-depth analyses from various financial platforms, including Zacks, Seeking Alpha, and The Motley Fool, to remain informed on the nuances of Crown Castle's financial performance and strategic direction as they consider its place in their portfolios.
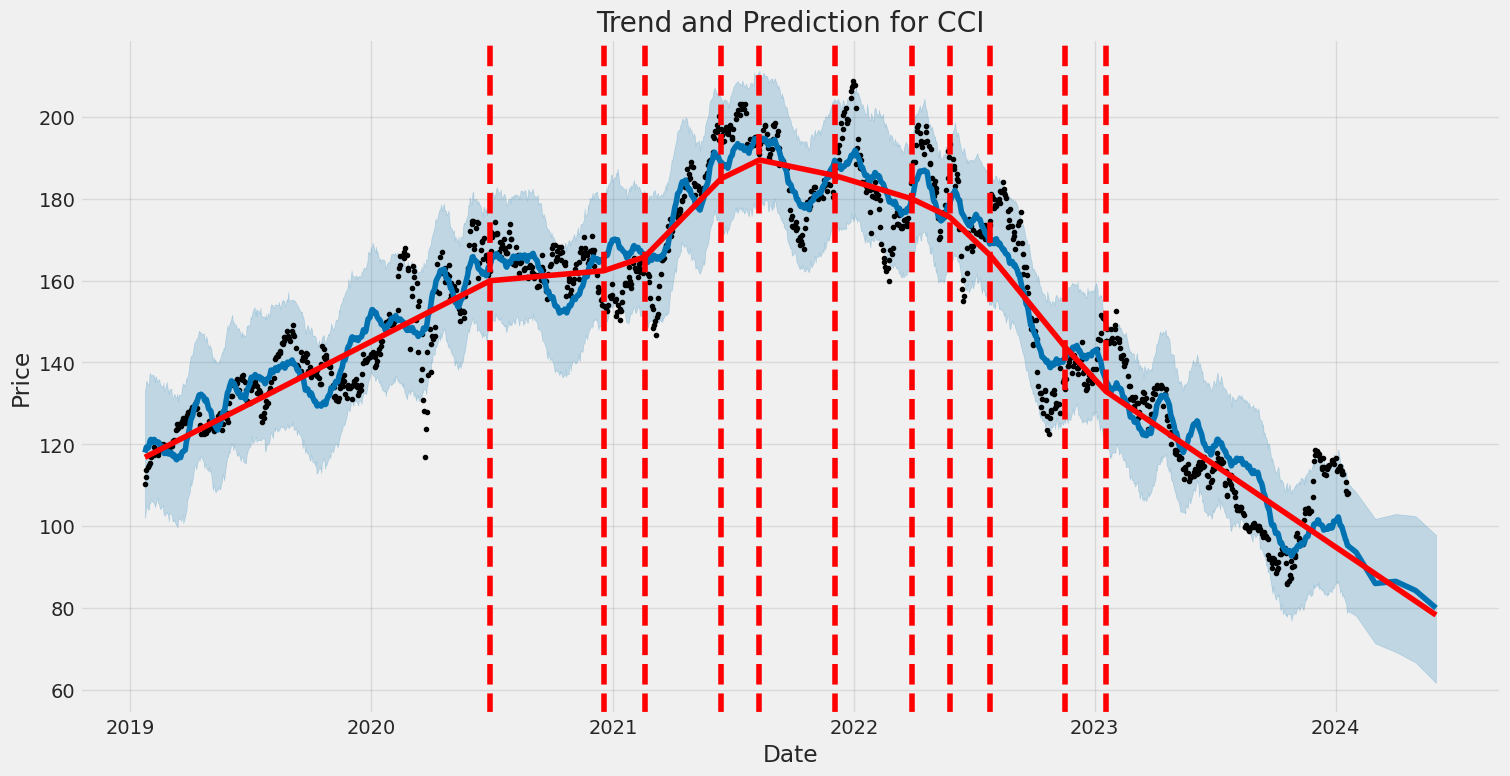
The Crown Castle Inc. (CCI) experienced notable fluctuations between January 2019 and January 2024, as indicated by a zero-mean ARCH model analysis. Despite the absence of an overall trend in returns (zero mean), the volatility is evident with a significant omega coefficient, suggesting there is a baseline level of variation in returns. Also, the significant alpha parameter indicates past shocks have influenced future volatility, signifying that larger movements in the stock's returns tend to predict similarly large movements following them.
| Statistic Name | Statistic Value |
|---|---|
| Mean Model | Zero Mean |
| Vol Model | ARCH |
| Log-Likelihood | -2,456.24 |
| AIC | 4,916.49 |
| BIC | 4,926.76 |
| No. Observations | 1,256 |
| Df Residuals | 1,256 |
| omega | 2.1439 |
| alpha[1] | 0.3712 |
To analyze the financial risk associated with a $10,000 investment in Crown Castle Inc. (CCI) over a year, a combination of volatility modeling and machine learning predictions was employed. Volatility modeling, a statistical approach that captures the temporal dynamics of asset price volatility, is crucial for understanding how the volatility of CCI's stock evolves over time. In this case, the model is typically designed to estimate the conditional variance of the stock's returns, relying on past data to forecast future volatility.
The volatility model estimates would support assessing the risk profile of Crown Castle Inc. by providing an insight into the expected level of fluctuation in the stock's returns. More volatile stocks indicate higher risk, as the price can change dramatically in either direction within a short period. For an investor holding the stock, understanding this volatility helps to predict the range of potential price movements and assess the probability of extreme declines.
On the other hand, machine learning predictions are leveraged to forecast future stock returns. The machine learning algorithm used is akin to a Random Forest Regressor, which operates by constructing multiple decision trees during training and outputs the mean prediction of those trees for regression tasks. This method is particularly adept at capturing complex nonlinear relationships between features, without the need for the underlying relationships to be specified a priori.
In predicting the future returns of CCI, machine learning can consider a multitude of predictive features, including past prices, volume, market indices, macroeconomic indicators, and even sentiment derived from news articles or financial reports. The machine learning model can refine its predictions through learning from these features, providing an educated forecast of what the stock's future price movements might be.
Combined, the volatility model sets the stage for understanding risk, while the machine learning predictions aim to provide a direct forecast of future price movements. When considering the $10,000 investment in CCI, these tools can be particularly powerful. By applying the forecasts of volatility and expected returns to compute the Value at Risk (VaR), one can estimate the potential loss in value of the investment in a worst-case scenario.
The calculated VaR at a 95% confidence interval is a statistical metric that presents the maximum expected loss over a one-year horizon with 95% certainty. In the case of CCI, the VaR of $290.29 suggests that there is a 95% probability that the investor will not lose more than $290.29 of the original $10,000 investment over one year due to price declines in CCI's stock.
This computed VaR provides a single, quantifiable figure that expresses risk in dollar terms, allowing investors to gauge whether the level of risk aligns with their risk tolerance and investment strategy. While the combined use of volatility modeling and machine learning predictions enhances risk assessment capabilities, it's important to note that all predictions and risk assessments are subject to inherent uncertainty, and theres always a 5% chance that losses could exceed the VaR estimate due to unforeseen market events or changes.
Similar Companies in REITOffice:
Report: Digital Realty Trust, Inc. (DLR), Digital Realty Trust, Inc. (DLR), Report: Equinix, Inc. (EQIX), Equinix, Inc. (EQIX), Report: SBA Communications Corporation (SBAC), SBA Communications Corporation (SBAC), Report: Iron Mountain Incorporated (IRM), Iron Mountain Incorporated (IRM), Report: American Tower Corporation (AMT), American Tower Corporation (AMT), Report: Hannon Armstrong Sustainable Infrastructure Capital, Inc. (HASI), Hannon Armstrong Sustainable Infrastructure Capital, Inc. (HASI), Gaming and Leisure Properties, Inc. (GLPI), Report: EPR Properties (EPR), EPR Properties (EPR), Uniti Group Inc. (UNIT)
https://seekingalpha.com/article/4657374-crown-castle-buy-the-market-bottom
https://seekingalpha.com/article/4657503-crown-castle-the-rebound-looks-sustainable
https://www.youtube.com/watch?v=Qvom43e6LwA
https://www.zacks.com/stock/news/2197067/crown-castle-cci-stock-sinks-as-market-gains-here-s-why
https://seekingalpha.com/article/4657362-10-of-the-best-reits-to-buy-for-2024
https://www.fool.com/investing/2023/12/26/bull-market-buys-3-dividend-stocks-to-own-for-the/
https://seekingalpha.com/article/4659818-2-reits-that-could-soar-in-2024
https://seekingalpha.com/article/4659819-why-reits-will-likely-surge-2024
https://seekingalpha.com/article/4660808-3-specialty-reits-you-definitely-should-not-ignore-in-2024
https://www.zacks.com/stock/news/2205801/out-vs-cci-which-stock-is-the-better-value-option
https://finance.yahoo.com/news/3-top-5g-stocks-powering-235014295.html
https://www.sec.gov/Archives/edgar/data/1051470/000105147023000162/cci-20230930.htm
Copyright © 2024 Tiny Computers (email@tinycomputers.io)
Report ID: VoXTmH
Cost: $1.20780
https://reports.tinycomputers.io/CCI/CCI-2024-01-21.html Home