Cleveland-Cliffs Inc. (ticker: CLF)
2024-02-05
 Cleveland-Cliffs Inc. (Ticker: CLF) stands as a prominent player in the North American mining and steel manufacturing industry. With a history stretching back to 1847, the company has evolved into the largest flat-rolled steel producer and the largest supplier of iron ore pellets in North America. Cleveland-Cliffs focuses on serving the needs of the North American steel market with an emphasis on automotive, infrastructure, and manufacturing sectors. Throughout its growth trajectory, Cleveland-Cliffs has executed strategic acquisitions, including notable ones such as AK Steel in 2019 and ArcelorMittal USA in 2020, significantly expanding its operational footprint and product range. The company's operations span across mining, pelletizing, and steelmaking, enabling it to maintain a degree of control over its supply chain, a critical factor in its ability to deliver quality products and services to its clientele. Financially, CLF has demonstrated resilience and adaptability, navigating through market cycles with strategic investments in technology and sustainability initiatives aimed at minimizing its environmental footprint while enhancing operational efficiency. Investors and market watchers closely monitor Cleveland-Cliffs for its pivotal role in the vital sectors of the economy, its financial health, and its strategies for managing the challenges and opportunities in the dynamic global steel industry.
| City | Cleveland | State | OH | Country | United States |
| Full Time Employees | 28,000 | Industry | Steel | Sector | Basic Materials |
| Previous Close | 20.34 | Market Cap | 10,046,733,312 | Volume | 11,284,031 |
| Five Year Avg Dividend Yield | 4.7 | Beta | 2.027 | Trailing PE | 25.512821 |
| Forward PE | 9.900497 | Fifty Two Week Low | 13.61 | Fifty Two Week High | 22.83 |
| Enterprise Value | 13,109,000,192 | Profit Margins | 0.01814 | Total Revenue | 21,995,999,232 |
| Debt to Equity | 38.623 | Revenue Per Share | 43.0 | Return on Assets | 0.03506 |
| Return on Equity | 0.055560004 | Free Cashflow | 1,835,624,960 | Operating Cashflow | 2,267,000,064 |
| Revenue Growth | 0.013 | Gross Margins | 0.06324 | EBITDA Margins | 0.09052 |
| Sharpe Ratio | -0.010923921839455354 | Sortino Ratio | -0.1791321816013112 |
| Treynor Ratio | -0.0027799367441361414 | Calmar Ratio | -0.11575817491150349 |
Technical, fundamental, and risk-adjusted performance metrics offer a comprehensive overview of CLF's present position and potential future performance. Despite visible volatility and risk, as inferable from the negative Sharpe, Sortino, Treynor, and Calmar ratios, there is a nuanced understanding that needs to be applied when forecasting CLF's stock movement.
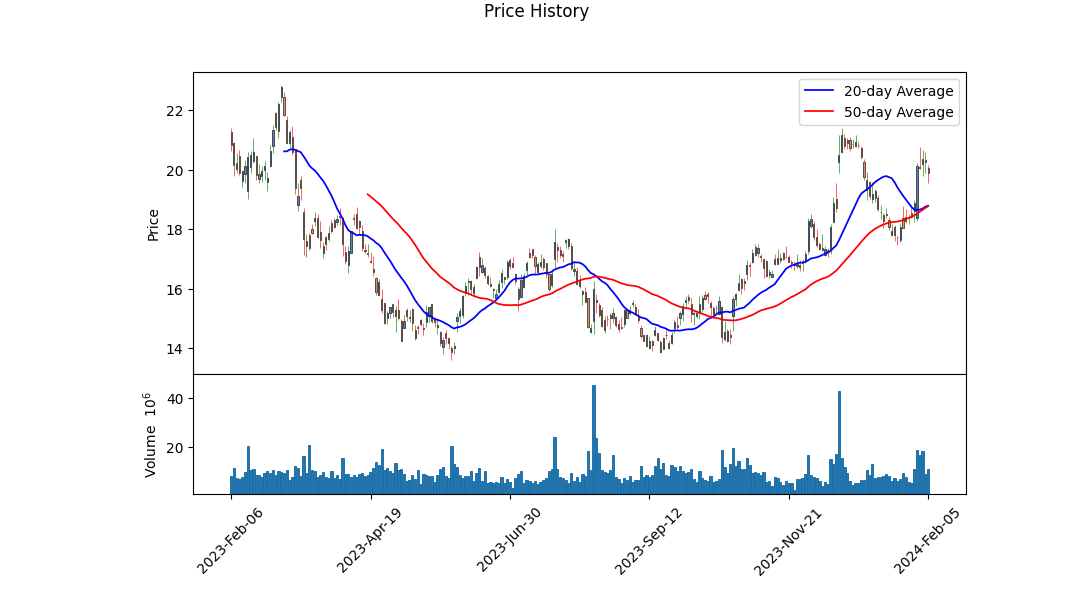
The closing price has seen a notable uptrend in recent months, jumping from around $15.33 to over $20. This growth is underpinned by a consistent volume, as suggested by the On-Balance Volume (OBV) which confirms buying pressure. The Moving Average Convergence Divergence (MACD) histogram shows a growing positive trend towards the last recorded period, pointing towards continued bullish momentum. These indicators are essential in establishing market sentiment and potential future movements.
The fundamental analysis reveals mixed signals but highlights significant strengths. The gross, EBITDA, and operating margins suggest a company managing its costs and operations efficiently relative to its revenue, yet with ample room for improvement. With significant retained earnings and a robust working capital position, the balance sheet denotes a company with solid financial health and operational stability. Such fundamentals could provide a cushion or platform for future growth, making the company potentially more resilient to market volatility.
However, the risk-adjusted performance metrics, specifically the Sharpe, Sortino, Treynor, and Calmar ratios, are in negative territory. These figures generally indicate poor risk-adjusted returns over the past year. Given these ratios are annual figures, they reflect not just the recent uptrend, but also periods of significant volatility or underperformance. In the context of potential investment, these would generally suggest a cautious approach due to the stock's ability, in the recent past, to compensate for the risks it presented to investors.
The market's sentiment, depicted through analyst expectations, shows a voted confidence towards CLF's future, with earnings estimates for the next year indicating growth. This optimism, indicated by upward revisions in earnings estimates, despite the negative past performance ratios, suggests market participants may see enduring value or turnaround potential not fully reflected in past performance metrics.
Combined, the technical indicators suggest a short- to medium-term bullish outlook for CLF, with fundamentals indicating solidity in an overall strong balance sheet. However, the prudent observer would remain cautious due to the negative risk-adjusted performance ratios, understanding they signal past volatility and underperformance relative to the risk. Investors might look forward to growth but should weigh the recent positive signals against historical performance challenges. The decision to invest should consider both the potential for growth reflected in the analyst sentiments and the underlying risks highlighted by past performance ratios.
In the comprehensive analysis of Cleveland-Cliffs Inc. (CLF), a prominent player in the mining and natural resources sector, the financial metrics of return on capital (ROC) and earnings yield stand out prominently, providing insightful reflections of the company's operational efficiency and investment attractiveness. The calculated return on capital (ROC) for Cleveland-Cliffs Inc. stands at an impressive 12.751545442588451%, illustrating the company's adeptness in generating substantial returns from the capital employed in its business operations, a testament to its effective management and operational efficiency. Parallelly, the earnings yield of Cleveland-Cliffs Inc. is observed to be 12.914572864321608%, which showcases the company's profitability from an investor's standpoint. Highly indicative of the firms capacity to generate earnings relative to its share price, this earnings yield underscores Cleveland-Cliffs Inc.'s attractiveness as an investment opportunity, blending appealing returns with a potentially lower risk profile. Together, these metrics not only provide a solid basis for evaluating Cleveland-Cliffs Inc.'s financial health but also contribute to a deeper understanding of its market standing and investment potential.
Based on the extensive data provided for Cleveland-Cliffs Inc. (CLF) across several periods, we can identify several key trends and aspects related to the principles outlined by Benjamin Graham in "The Intelligent Investor." Specifically, we'll look at trends and indicators relevant to Graham's ideas on fundamental investing, including financial stability, earnings growth, and intrinsic value assessment through the lens of the information provided.
Margin of Safety: Graham's concept of the margin of safety involves buying securities at prices significantly lower than their intrinsic value. This can be partially assessed through the price-to-book (P/B) ratio, where lower ratios may indicate undervalued stocks. Over the periods reported, the P/B ratios are not directly provided, but the data suggests significant growth in assets and potentially intrinsic value, which could be compared against market prices to assess the margin of safety.
Debt-to-Equity Ratio: Graham preferred companies with a low debt-to-equity ratio, as this indicated lower financial risk. The data showcases CLF's long-term debt over various periods, but without equity figures for each corresponding period, calculating the exact ratio is challenging. However, increases in assets and shareholder equity suggest an aspect of financial growth and potential stability.
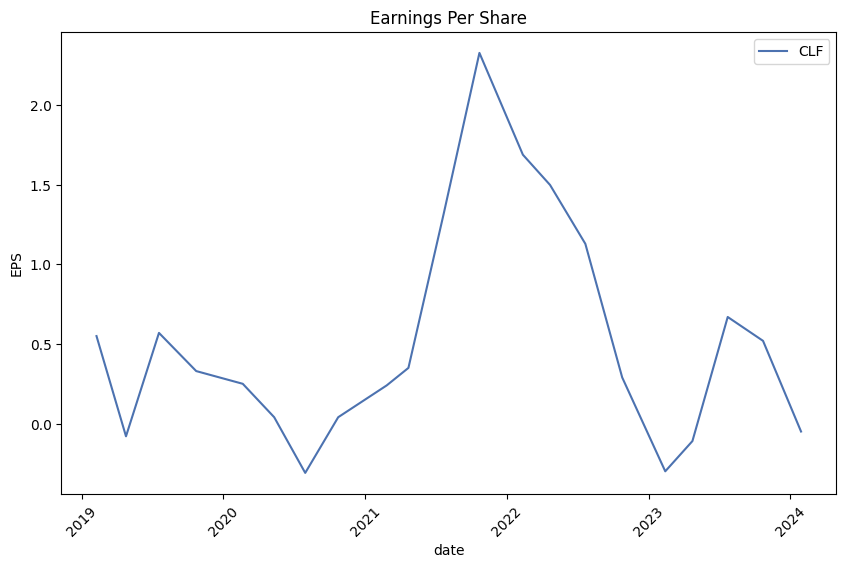
Earnings Growth: Graham looked for companies that showed consistent earnings growth over time. CLF's reported net income presents a positive trajectory in earnings, especially noticeable in the narrative from losses to significant profits. This is a positive indicator under Graham's criteria, although a longer historical perspective would be needed for a comprehensive assessment.
Price-to-Earnings (P/E) Ratio: A low P/E ratio may indicate an undervalued company relative to its earnings. While specific P/E ratios are not provided in the data, the earnings per share (EPS) data and net income growth suggest an improving profit scenario for CLF. Investors would need to compare the market price against these earnings metrics to gauge P/E accurately.
Dividend Record: Consistent dividend payments can indicate financial stability and profitability. Though specific dividend information is not detailed in the provided data, any consistent dividend payment history could be a positive sign aligned with Graham's principles.
Price-to-Book (P/B) Ratio: A metric Graham often used, the P/B ratio for CLF isn't directly provided but can be inferred from shareholder equity and other asset-related information. Growth in total assets and shareholder equity suggest potentially favorable P/B ratios, reflecting higher intrinsic value, but specific calculations would be required.
Analysis Summary: Overall, Cleveland-Cliffs Inc. shows signs of growth in assets, net income, and possibly earnings per share, which are indicators valued by Graham's investment philosophy. However, without direct P/E and P/B ratio calculations, debt-to-equity ratios for each period, and a clear record of dividend payments, a complete application of Graham's methods for assessing CLF's investment potential is partially constrained. Investors should seek to calculate these ratios where possible and consider the apparent growth trends in conjunction with Graham's investment principles for a more comprehensive analysis.
| Statistic Name | Statistic Value |
| R-squared | 0.288 |
| Adj. R-squared | 0.288 |
| F-statistic | 508.4 |
| Prob (F-statistic) | 8.76e-95 |
| Log-Likelihood | -3275.7 |
| No. Observations | 1256 |
| AIC | 6555 |
| BIC | 6566 |
| coef (const) | 0.0295 |
| coef (0) | 1.5873 |
| std err (const) | 0.093 |
| std err (0) | 0.070 |
| t (const) | 0.318 |
| t (0) | 22.548 |
| P>|t| (const) | 0.751 |
| P>|t| (0) | 0.000 |
| [0.025 (const)] | -0.153 |
| [0.975 (const)] | 0.212 |
| [0.025 (0)] | 1.449 |
| [0.975 (0)] | 1.725 |
| Omnibus | 96.108 |
| Prob(Omnibus) | 0.000 |
| Skew | 0.291 |
| Kurtosis | 5.523 |
| Durbin-Watson | 1.993 |
| Cond. No. | 1.32 |
| Alpha | 0.02951871037392763 |
| Beta | 1.587306927652615 |
In the regression model with SPY as a representation of the market and CLF as the dependent variable, an alpha of 0.0295 indicates a slight positive baseline return when market returns are zero. This alpha value, although positive, is marginal and suggests that the performance of CLF relative to a risk-free rate could be minimally positive without the influence of the market. The beta value of 1.5873 implies that CLF has a higher volatility compared to the market and tends to move more significantly in response to market movements. A beta greater than 1 is indicative of a security that is theoretically more volatile than the market.
Considering the statistical values obtained from the model, particularly the significance of the beta coefficient with a P value of practically 0.000, it is demonstrated that the relationship between CLF and SPY is statistically significant. The R-squared value of 0.288, however, denotes that only 28.8% of the variability in CLF's returns can be explained by movements in the SPY index. This suggests that while there is some degree of linear association between CLF and the market as represented by SPY, a significant portion of CLF's return variability is driven by factors not captured by the market index movements.
Cleveland-Cliffs Inc. discussed its financial results and strategic endeavors during their full-year and fourth-quarter 2023 earnings conference call, emphasizing their recent involvement in the U.S. Steel sale process and outlining their M&A strategy and capital allocation priorities moving forward. Notably, the company critiqued U.S. Steel's decision to sell to Nippon Steel, highlighting the misjudgments made by U.S. Steel's board and management. Cleveland-Cliffs proposed a final offer to acquire U.S. Steel which underscored the industrial logic and potential synergies of the transaction, alongside remedies to mitigate antitrust risks. However, their proposal was overlooked in favor of a lower-value offer from a foreign buyer, which Cleveland-Cliffs argued was fraught with significant regulatory, union-related, and political risks.
Financially, Cleveland-Cliffs achieved a robust performance in 2023, generating over $1.6 billion in free cash flow and reducing net debt significantly. Going forward, the company prioritizes aggressive share buybacks and further debt reduction, leveraging its stable balance sheet and free cash flow to enhance shareholder value. Operationally, 2023 was marked by record shipments, cost reductions, and an adjusted EBITDA of $1.9 billion. The company also highlighted its successful negotiation of coal and alloy supply agreements and anticipated further cost reductions in 2024.
Cleveland-Cliffs' strategic focus includes innovation in environmental practices, particularly through the implementation of the Cliffs H surcharge for steel produced using environmentally-friendly methods. The company is experimenting with hydrogen injection in blast furnaces as part of its commitment to producing green steel, leveraging partnerships and technology to reduce CO2 emissions significantly and maintain its leadership in the American steel industry.
The Q&A session revolved around Cleveland-Cliffs' approach to pricing, the impact of import competition, and its strong stance on maintaining competitive advantage through technological innovation and responsible environmental practices. The company reaffirmed its readiness to pursue opportunistic M&A, its resilient financial position, and its dedication to delivering value to shareholders through strategic capital allocation and operational efficiencies.
activities (470) (727) Financing activities (1,140) (1,199) Net cash flow $ 5 $ 8
For the nine months ended September 30, 2023, cash provided by operating activities decreased by $319 million compared to the same period in 2022, primarily due to decreased net income driven by lower steel prices and reduced gross margins, partially offset by reduced working capital requirements. Cash used in investing activities decreased by $257 million, primarily due to lower capital expenditures as a concentration of our investment in maintenance and operational efficiency enhancements began to normalize. Cash used in financing activities decreased by $59 million due to reduced net repayments under our revolving credit facility and reduced share repurchase activities, offset by the issuance of $750 million in 6.750% 2030 Senior Notes, which increased our long-term debt.
Our capital expenditures for the nine months ended September 30, 2023, totaled $481 million, primarily directed towards enhancing and maintaining our operational efficiencies, safety, and environmental projects across our portfolio. This reflects our commitment to maintaining a high standard of operations while managing our expenditures to ensure continued financial health and flexibility.
As of September 30, 2023, we had available borrowing base on our ABL Facility of $4.75 billion, of which $4.331 billion was available for borrowing, factoring in current borrowings and letter of credit obligations. This facility, alongside our operational cash flows, supports our liquidity and enables us to manage through the cyclicality of the steel market and the volatility in commodity prices.
Our liquidity position as of September 30, 2023, remains strong, providing us with the financial capacity to navigate market fluctuations, continue strategic investments in our business, and pursue opportunities to enhance shareholder value. We continue to monitor our capital structure actively, seeking opportunities to optimize our debt profile while maintaining a prudent approach to capital management.
Lastly, our focus remains on strategically allocating our capital towards managing and growing our business effectively, ensuring regulatory compliance and operational necessities, and returning value to our shareholders through disciplined share repurchases and debt management strategies, reflecting our commitment to sustainable financial practices and long-term value creation.
Cleveland-Cliffs Inc., a beacon of the American steel and mining industry, has recently been gaining significant attention from investors and analysts alike due to a series of strategic decisions and financial performances that highlight its potential as a robust investment opportunity. One of the key aspects contributing to the burgeoning investor interest in Cleveland-Cliffs is its aggressive capital allocation strategy, aimed at reducing debt and enhancing shareholder value through dividends and share repurchase programs. This approach not only underscores the companys commitment to improving its financial health but also signals its confidence in future growth prospects.
A pivotal moment that has shaped the narrative around Cleveland-Cliffs was its audacious, though ultimately unsuccessful, bid to acquire U.S. Steel. The company's determination to expand its market dominance was evident in its proposed offer, which showcased its financial capability and strategic intent to consolidate the industry further. Although the deal did not materialize, with U.S. Steel opting for a merger with Nippon Steel instead, Cleveland-Cliffs ambition highlighted the orientation of its growth strategy towards enhancing its production capacity and market reach. This move also sparked discussions around antitrust considerations and the broader implications for the steel industry's competitive landscape.
Cleveland-Cliffs' operational strategies have been instrumental in its rising stock value, with a notable performance in December following the announcement of accelerated share repurchases. This reaction from the market, a 19% increase in stock value, underscores the positive investor sentiment towards the company's financial maneuvers and its ability to generate substantial free cash flow, which was notably over $1.6 billion in 2023. The strategic shift towards rewarding shareholders post the failed acquisition bid exemplifies Cleveland-Cliffs' adaptability and its focus on optimizing shareholder returns.
The companys financial outlook has been further bolstered by the revised earnings estimate, as reported by Zacks Equity Research. Analysts project a significant improvement in Cleveland-Cliffs earnings per share, marking a promising shift that has led to the company being awarded a Zacks Rank #2 (Buy). This optimistic financial projection is based on an upward revision of earnings estimates, indicative of the confidence financial experts have in Cleveland-Cliffs operational efficacy and market strategy.
Operational excellence remains a cornerstone of Cleveland-Cliffs strategy, focusing on enhancing production efficiency and reducing costs. The company's emphasis on integrating innovations, such as the introduction of a surcharge for green steel produced using hydrogen in blast furnaces, showcases its commitment to sustainability and operational efficiency. These efforts not only align with global trends towards greener manufacturing practices but also provide Cleveland-Cliffs with a competitive edge in attracting clients conscious of their carbon footprint.
Moreover, Cleveland-Cliffs has demonstrated prudence in navigating the cyclical nature of the steel industry, leveraging its strategic acquisitions to diversify its product portfolio and stabilize its supply chain. The companys financial discipline, manifested in its debt reduction efforts and strategic investment in growth opportunities, has solidified its market position, offering a cushion against market volatilities.
In engaging with trade policies and market dynamics, Cleveland-Cliffs has been vocal about ensuring fair trade practices, advocating for the enforcement of trade laws to sustain a level playing field. This stance is particularly relevant in the context of increasing global competition and the criticality of maintaining domestic manufacturing capabilities.
As Cleveland-Cliffs continues to navigate the complexities of the steel and mining industry, its strategic focus on operational efficiency, financial health, sustainability, and market expansion through strategic acquisitions and mergers underscores its potential for sustainable growth. Investors and market watchers remain optimistic about Cleveland-Cliffs trajectory, recognizing its strategic maneuvers not only as a pathway to bolstering its market presence but also as indicative of its resilience and adaptability in an ever-evolving industry landscape.
Over the specified date range, Cleveland-Cliffs Inc. (CLF) exhibited notable volatility, indicating fluctuating investment risks and opportunities. The company's returns were unpredictable, as highlighted by a zero mean model and underscored by an ARCH model that captures variability in data over time. Key volatility features include an omega coefficient of 11.8632, signifying baseline variance, and an alpha[1] coefficient of 0.2327, indicating the impact of past squared shocks on future variance.
| Statistic Name | Statistic Value |
|---|---|
| Log-Likelihood | -3462.40 |
| AIC | 6928.80 |
| BIC | 6939.08 |
| No. Observations | 1256 |
| omega | 11.8632 |
| alpha[1] | 0.2327 |
To analyze the financial risk associated with a $10,000 investment in Cleveland-Cliffs Inc. (CLF) over one year, a sophisticated approach combining volatility modeling and machine learning predictions was employed. This multifaceted methodology incorporates the strengths of both statistical and predictive modeling to offer a nuanced understanding of potential investment outcomes.
Initially, volatility modeling was utilized to assess the stock's historical volatility. This approach is pivotal for understanding how the price of Cleveland-Cliffs Inc. has fluctuated over time, thus providing insights into the potential range of price movements it could experience in the future. By analyzing historical price data, volatility modeling allows for the quantification of the stock's variability, which is a crucial factor in risk assessment. This method effectively accounts for past market behavior and price patterns to estimate future volatility.
Subsequently, machine learning predictions, specifically through the use of a model trained to predict future returns, were implemented. This predictive model, designed to analyze historical data and identify patterns that might not be immediately apparent through traditional analysis, plays a crucial role in forecasting the stock's future price movements. By integrating various market indicators and stock performance metrics, the predictive model offers a forward-looking perspective, supplementing the retrospective insights provided by volatility modeling.
The combination of volatility modeling and machine learning predictions enables a more comprehensive analysis of the financial risk associated with investing in Cleveland-Cliffs Inc. This hybrid approach not only considers the historical volatility of the stock but also incorporates predictive insights into future stock performance. Such a dual analysis framework enhances the robustness of the investment risk assessment.
Focusing on the calculated Value at Risk (VaR) at a 95% confidence interval for a $10,000 investment, which stands at $429.57, offers a concrete estimate of the potential downside risk. VaR is a widely used risk measure that quantifies the maximum expected loss over a specified time frame, under normal market conditions, and at a given confidence level. In this context, the calculated VaR indicates that there is a 95% chance that the investor will not lose more than $429.57 on their $10,000 investment in Cleveland-Cliffs Inc. over the assessed one-year period. This value provides investors with a numerical threshold for potential losses, facilitating informed decision-making regarding their investment in CLF.
Through the integration of volatility modeling to assess historical stock behavior and machine learning predictions for future returns, this analysis offers a nuanced perspective on the investment risk in Cleveland-Cliffs Inc. Such an approach demonstrates the effectiveness of leveraging both historical volatility assessments and predictive analytics, providing investors with a well-rounded understanding of potential financial risks.
Analyzing the options chain for Cleveland-Cliffs Inc. (CLF) call options, our goal is to identify the most profitable options, focusing on a target stock price increase of 5% over the current price. To do this, we consider "the Greeks" - Delta, Gamma, Vega, Theta, and Rho - as well as other factors like premium, days to expiration, and potential return on investment (ROI).
Delta measures the sensitivity of an option's theoretical value to a change in the price of the underlying asset. Options with a higher Delta are more sensitive to changes in the stock price, indicating a higher probability of finishing in the money. Gamma represents the rate of change in Delta in response to price movements of the underlying asset, offering insights into the option's future sensitivity to price changes.
Vega measures the sensitivity of the option's value to changes in the volatility of the underlying asset. Theta represents the rate of time-value decay of the option, and Rho measures the sensitivity of the options price to changes in the interest rate.
Given our target of a 5% increase in the stock price over the present value, options with a higher Delta, lower Theta (less time-value decay), and an optimal combination of Vega and Rho for favorable market conditions should be considered more profitable.
For short-term investments, options such as those expiring on February 9, 2024, with strikes at $13.00, $14.00, and $20.0, and those expiring on February 16, 2024, with a strike of $14.0, present themselves as highly attractive due to their high ROI, which signifies potential for high return on the invested premium. The $20.0 strike option expiring on February 9, 2024, in particular, shows a strikingly high ROI of approximately 1.8871, coupled with high Delta values, indicating a high probability of being in the money at expiration. Despite the relatively short days to expire, their high Gamma and Vega suggest they could benefit well from price movements of CLF and volatility shifts in the near term.
For medium-term positions, looking into options expiring on March 1, 2024, particularly those with strikes around $15.0, could be beneficial due to their balanced combination of Greeks, specifically a Delta near 0.9698 and a substantial Vega, indicating sensitivity to shifts in underlying volatility, which may be advantageous if expecting an increase in market volatility.
Long-term strategies could consider the February 9, 2024, expiry options at strikes $13.0 and $17.0. These options show a promising balance between Delta and the other Greeks, suggesting a strong position over time with less negative impact from Theta, alongside having several months until expiration, granting more opportunity for the desired stock price movement to occur.
Lastly, it's essential to factor in the associated premium costs relative to the projected profits. Options with lower premiums but high ROIs, such as those with strikes at $20.5 expiring on February 9, 2024, and $19.0 for the February 16, 2024, expiry, offer potentially high returns for lower upfront investment, which can be appealing for investors seeking to maximize leverage while minimizing costs.
Please note this analysis is based on theoretical values and should be complemented with further market research and analysis considering potential volatility shifts, interest rate changes, and company-specific news that might affect stock price and option valuation before making any investment decisions.
Similar Companies in Steel:
Report: Nucor Corporation (NUE), Nucor Corporation (NUE), Report: Steel Dynamics, Inc. (STLD), Steel Dynamics, Inc. (STLD), Report: ArcelorMittal S.A. (MT), ArcelorMittal S.A. (MT), Report: Gerdau S.A. (GGB), Gerdau S.A. (GGB), Report: United States Steel Corporation (X), United States Steel Corporation (X), Report: Reliance Steel & Aluminum Co. (RS), Reliance Steel & Aluminum Co. (RS), Report: Commercial Metals Company (CMC), Commercial Metals Company (CMC), POSCO Holdings Inc. (PKX), Ternium S.A. (TX), Companhia Siderurgica Nacional (SID)
https://seekingalpha.com/article/4659369-cleveland-cliffs-is-still-bargain
https://www.youtube.com/watch?v=BKZ_5r17lXQ
https://www.fool.com/investing/2024/01/04/why-cleveland-cliffs-stock-scaled-mountains-in-dec/
https://seekingalpha.com/article/4666058-cleveland-cliffs-inc-clf-q4-2023-earnings-call-transcript
https://www.youtube.com/watch?v=nx680EV89SU
https://finance.yahoo.com/m/631e63fa-5c8e-3f48-b0fc-16f5fb38a3a4/cleveland-cliffs-stock.html
https://finance.yahoo.com/news/cleveland-cliffs-inc-nyse-clf-133138613.html
https://finance.yahoo.com/news/director-ron-bloom-acquires-25-200230722.html
https://finance.yahoo.com/news/cliffs-ceo-says-us-steel-202650531.html
https://finance.yahoo.com/news/american-steel-buyers-hail-nippon-150000728.html
https://seekingalpha.com/article/4667322-cleveland-cliffs-bolsters-shareholder-value
https://www.fool.com/investing/2024/02/04/the-bull-market-is-here-2-stocks-still-at-bargain/
https://finance.yahoo.com/m/7cc99739-8af3-3bbd-98f6-7752240d6dd5/the-bull-market-is-here%3A-2.html
https://finance.yahoo.com/news/cleveland-cliffs-clf-run-higher-172004100.html
https://www.sec.gov/Archives/edgar/data/764065/000076406523000162/clf-20230930.htm
Copyright © 2024 Tiny Computers (email@tinycomputers.io)
Report ID: hhBOvs
Cost: $0.89749
https://reports.tinycomputers.io/CLF/CLF-2024-02-05.html Home